Home > Comparison > Technology > FICO vs PAYC
The strategic rivalry between Fair Isaac Corporation and Paycom Software, Inc. defines the evolving landscape of technology-driven software solutions. Fair Isaac operates as a mature, data-analytics powerhouse with a global footprint, while Paycom delivers agile, cloud-based human capital management software focused on US mid-sized firms. This head-to-head pits established analytic depth against innovative SaaS growth. This analysis will identify which trajectory offers superior risk-adjusted returns for a diversified portfolio in the dynamic tech sector.
Table of contents
Companies Overview
Fair Isaac Corporation and Paycom Software, Inc. occupy critical roles in the software application market, driving innovation in decision analytics and human capital management.
Fair Isaac Corporation: Analytics Powerhouse for Decision Automation
Fair Isaac Corporation dominates with its analytic and data management products that automate complex decisions globally. Its revenue stems from two segments: Scores, offering business-to-business consumer scoring, and Software, delivering modular decision management solutions. In 2026, the company sharpens focus on expanding its FICO Platform to support advanced analytics and configurable decisioning software.
Paycom Software, Inc.: Cloud-Based Human Capital Management Leader
Paycom Software excels as a cloud-based human capital management (HCM) provider for small and mid-sized U.S. businesses. It generates revenue through a comprehensive SaaS suite covering talent acquisition, payroll, compliance, and workforce analytics. The 2026 strategy emphasizes enhancing user experience with manager mobility tools and data-driven employment predictors.
Strategic Collision: Similarities & Divergences
Both firms lead in software but diverge on core philosophy: Fair Isaac pursues a modular, analytic-driven platform, while Paycom offers an integrated, end-to-end HCM suite. Their primary competition lies in providing actionable insights—decision automation versus workforce management. Investors face contrasting profiles: Fair Isaac holds a higher market cap with global reach; Paycom emphasizes domestic growth with scalable SaaS adoption.
Income Statement Comparison
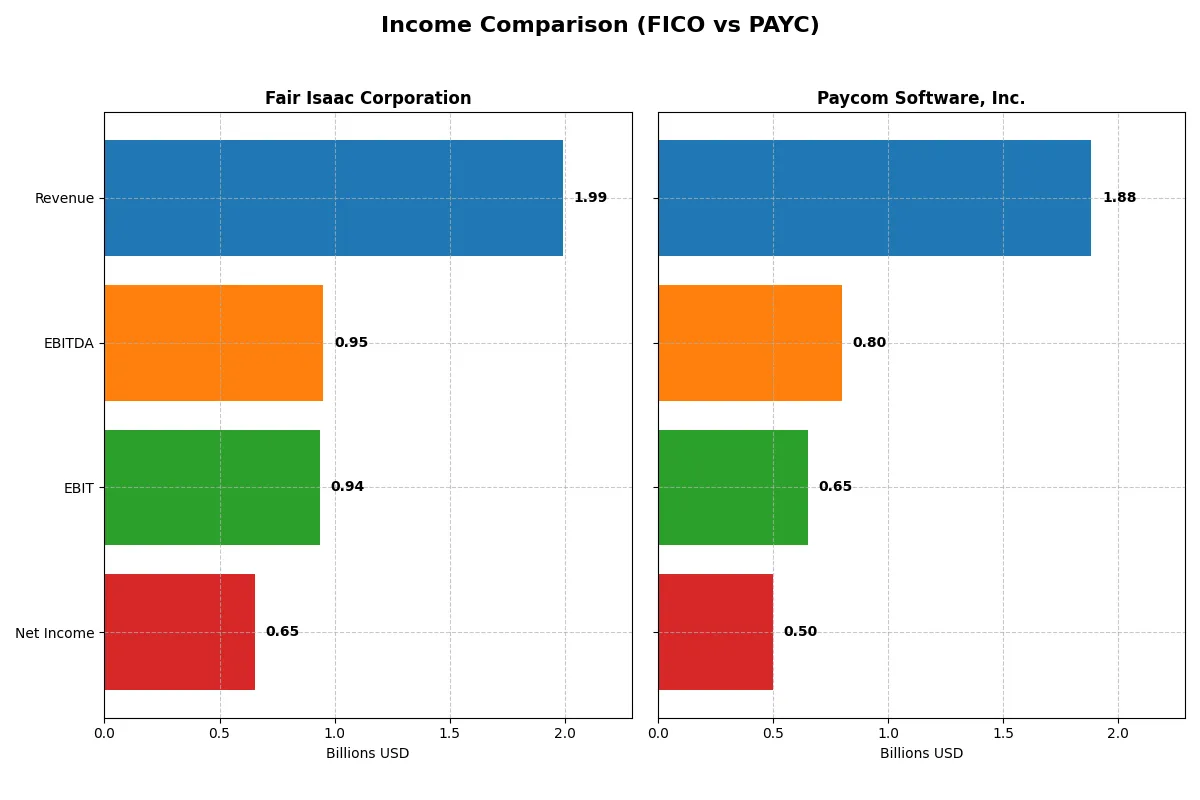
This data dissects the core profitability and scalability of both corporate engines to reveal who dominates the bottom line:
| Metric | Fair Isaac Corporation (FICO) | Paycom Software, Inc. (PAYC) |
|---|---|---|
| Revenue | 1.99B | 1.88B |
| Cost of Revenue | 354M | 335M |
| Operating Expenses | 712M | 914M |
| Gross Profit | 1.64B | 1.55B |
| EBITDA | 951M | 798M |
| EBIT | 936M | 652M |
| Interest Expense | 134M | 3.4M |
| Net Income | 652M | 502M |
| EPS | 26.9 | 8.93 |
| Fiscal Year | 2025 | 2024 |
Income Statement Analysis: The Bottom-Line Duel
This income statement comparison reveals which company runs the more efficient and profitable corporate engine through revenue and margin dynamics.
Fair Isaac Corporation (FICO) Analysis
FICO’s revenue grew steadily from 1.32B in 2021 to nearly 2B in 2025, with net income climbing from 392M to 652M. The company maintains robust margins, boasting an 82.2% gross margin and a 32.8% net margin in 2025. Its EBIT margin improved to 47%, signaling strong operational efficiency and healthy momentum.
Paycom Software, Inc. (PAYC) Analysis
PAYC expanded revenue from 841M in 2020 to 1.88B in 2024, with net income surging from 143M to 502M. The firm keeps a consistent gross margin at 82.2% and a solid net margin of 26.7% in 2024. PAYC demonstrates notable EBIT growth and margin expansion, reflecting accelerating profitability and effective cost management.
Margin Strength vs. Growth Trajectory
FICO leads in net and EBIT margins, showcasing superior profitability and operational efficiency. PAYC outperforms in revenue and net income growth rates, highlighting impressive expansion and scaling. Investors seeking higher margins and stable profits may prefer FICO; those favoring rapid growth and momentum might lean toward PAYC’s dynamic profile.
Financial Ratios Comparison
These vital ratios act as a diagnostic tool to expose the underlying fiscal health, valuation premiums, and capital efficiency of the companies compared below:
| Ratios | Fair Isaac Corporation (FICO) | Paycom Software, Inc. (PAYC) |
|---|---|---|
| ROE | -37.3% | 31.9% |
| ROIC | 52.96% | 24.86% |
| P/E | 55.6 | 22.9 |
| P/B | -20.8 | 7.31 |
| Current Ratio | 0.83 | 1.10 |
| Quick Ratio | 0.83 | 1.10 |
| D/E (Debt-to-Equity) | -1.76 | 0.05 |
| Debt-to-Assets | 164.6% | 1.42% |
| Interest Coverage | 6.92 | 186.6 |
| Asset Turnover | 1.07 | 0.32 |
| Fixed Asset Turnover | 21.20 | 2.93 |
| Payout ratio | 0 | 16.9% |
| Dividend yield | 0 | 0.74% |
| Fiscal Year | 2025 | 2024 |
Efficiency & Valuation Duel: The Vital Signs
Financial ratios serve as a company’s DNA, exposing underlying risks and operational strengths critical to investor insight.
Fair Isaac Corporation
Fair Isaac exhibits a high ROIC at 53% but suffers from a negative ROE of -37%, signaling shareholder equity challenges. The stock trades at an expensive P/E of 55.6 and a stretched EV/Sales near 20. With no dividend payout, Fair Isaac reinvests heavily in R&D, emphasizing growth over immediate shareholder returns.
Paycom Software, Inc.
Paycom posts a solid ROE of 31.9% and a respectable ROIC of 25%, reflecting operational efficiency. Its P/E ratio at 22.95 is more moderate, suggesting fair valuation compared to peers. Paycom distributes a modest 0.74% dividend while balancing reinvestment in R&D, supporting steady growth and shareholder value.
Balanced Growth vs. High-Stakes Innovation
Fair Isaac’s high valuation and negative ROE contrast with Paycom’s steadier profitability and fairer price multiples. Paycom offers a safer risk-reward balance, suited for investors prioritizing operational stability. Fair Isaac fits those willing to bet on aggressive innovation despite valuation stretch and equity headwinds.
Which one offers the Superior Shareholder Reward?
Fair Isaac Corporation (FICO) does not pay dividends but delivers near 99% free cash flow coverage, reinvesting heavily in growth. Paycom Software, Inc. (PAYC) pays a modest 0.74% dividend yield with a 17% payout ratio but shows weaker free cash flow conversion near 64%. FICO’s aggressive buyback strategy complements its reinvestment focus, while PAYC’s buybacks are modest. Historically, I’ve observed that in high-growth tech sectors, a strong buyback and reinvestment model, like FICO’s, tends to create more sustainable long-term value. PAYC’s dividend offers income but may limit capital for growth. I conclude FICO offers a superior total shareholder return profile in 2026 due to its disciplined capital allocation and growth reinvestment.
Comparative Score Analysis: The Strategic Profile
The radar chart reveals the fundamental DNA and trade-offs of Fair Isaac Corporation and Paycom Software, highlighting their strategic strengths and vulnerabilities:
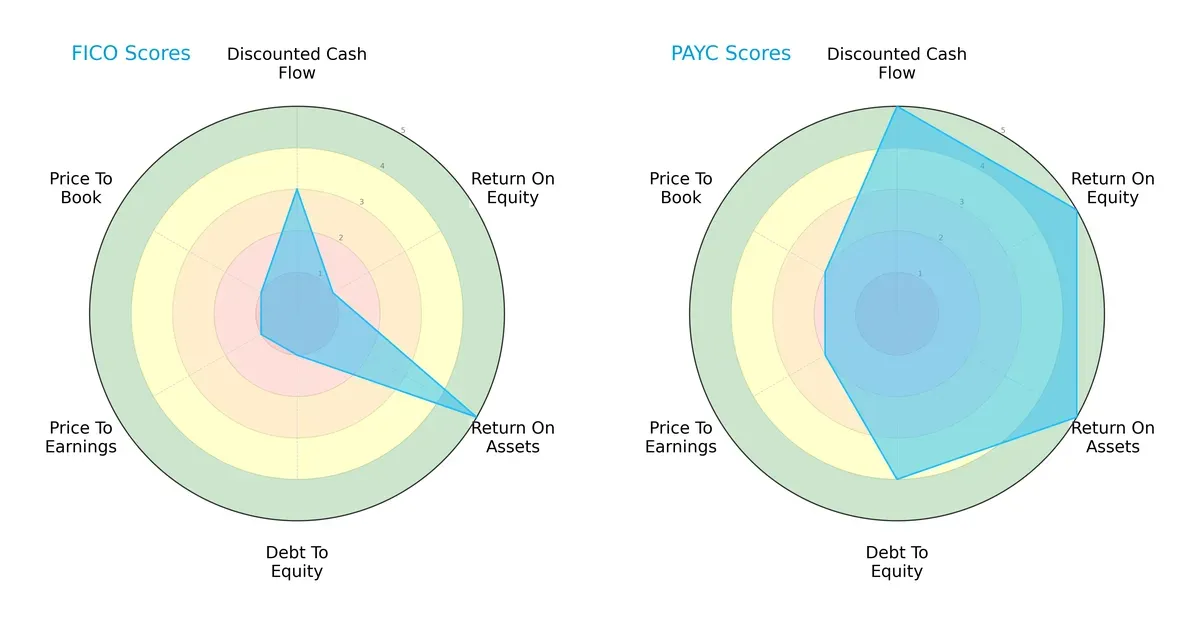
Paycom Software holds a distinctly more balanced and robust financial profile, excelling in DCF, ROE, and ROA scores with very favorable ratings. Fair Isaac leans heavily on asset efficiency (ROA) but struggles with equity returns and debt management, reflected in very unfavorable debt-to-equity and valuation scores. Paycom’s moderate valuation scores suggest room for growth without overextension, while Fair Isaac’s low scores indicate potential undervaluation but higher risk.
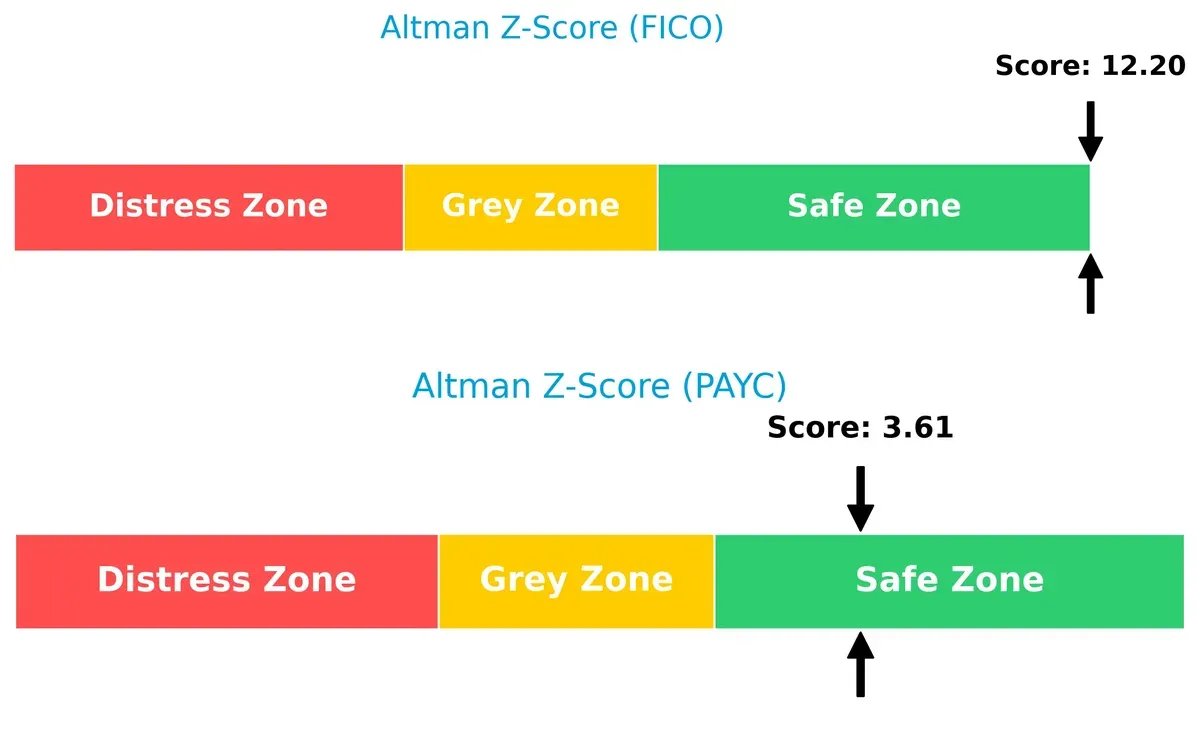
Bankruptcy Risk: Solvency Showdown
Paycom’s Altman Z-Score of 3.6 and Fair Isaac’s 12.2 both place them safely above distress thresholds, indicating strong solvency and resilience in this economic cycle:
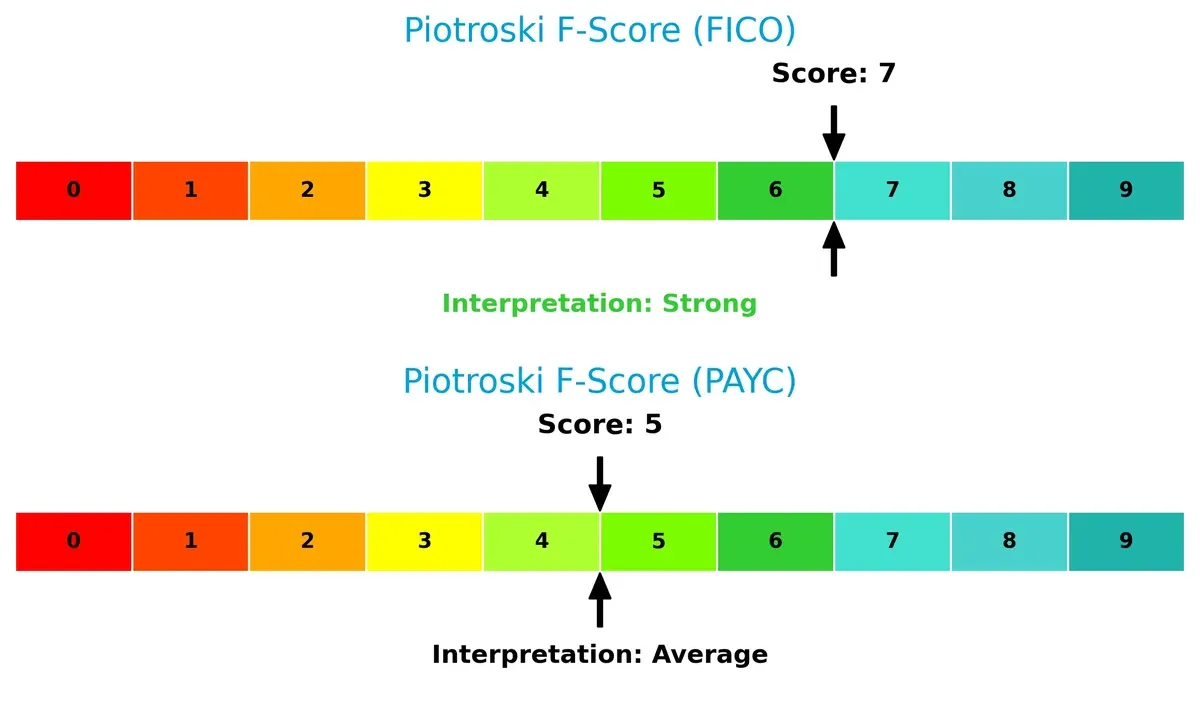
Financial Health: Quality of Operations
Fair Isaac’s Piotroski score of 7 signals strong financial health, outperforming Paycom’s average score of 5. This suggests Fair Isaac maintains better internal operational controls despite weaker market scores:
How are the two companies positioned?
This section dissects the operational DNA of FICO and PAYC by comparing their revenue distribution and internal dynamics, including strengths and weaknesses. The goal is to confront their economic moats and identify which model offers the most resilient, sustainable competitive advantage today.
Revenue Segmentation: The Strategic Mix
This revenue comparison dissects how Fair Isaac Corporation and Paycom Software diversify income streams and reveals their primary sector bets:
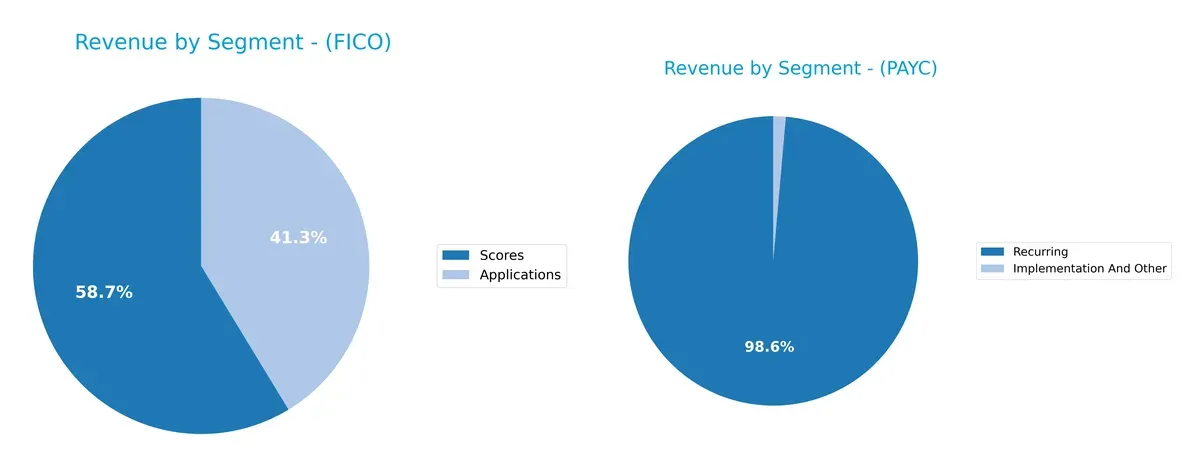
Fair Isaac Corporation pivots between two sizable segments: Scores at $1.17B and Applications near $822M in 2025. This split indicates a balanced portfolio reducing concentration risk. Paycom, however, anchors 2024 revenue heavily on Recurring services totaling $1.73B, dwarfing Implementation income at $24M. Paycom’s reliance on recurring fees signals strong ecosystem lock-in but also exposes it to subscription churn risks. Fair Isaac’s diversification offers more strategic flexibility than Paycom’s dominant single stream.
Strengths and Weaknesses Comparison
This table compares the Strengths and Weaknesses of Fair Isaac Corporation and Paycom Software, Inc.:
FICO Strengths
- High net margin at 32.75%
- Strong ROIC at 52.96% over WACC
- Favorable debt-to-equity and interest coverage
- Significant revenue from diverse product lines
- Established global presence with major Americas revenue
PAYC Strengths
- Favorable net margin at 26.66%
- Positive ROE at 31.85% and ROIC at 24.86%
- Low debt-to-assets ratio and strong interest coverage
- Recurring revenue dominance of $1.73B
- Healthy liquidity ratios, quick ratio 1.1
FICO Weaknesses
- Negative ROE at -37.34% raises concerns
- High debt-to-assets ratio at 164.6%
- Low current ratio at 0.83 signals liquidity risk
- Unfavorable P/E at 55.64 and no dividend yield
- Heavy reliance on Americas for revenue, limited geographic diversification
PAYC Weaknesses
- Lower asset turnover at 0.32 indicates less efficient asset use
- Unfavorable P/B ratio at 7.31
- Modest dividend yield at 0.74%
- No reported geographic diversification data
The comparison shows FICO benefits from strong capital returns and global sales but faces liquidity and leverage challenges. PAYC maintains solid profitability with low leverage and recurring revenue but needs better asset efficiency and broader geographic reach. Both companies’ financial profiles suggest different strategic priorities and operational risks.
The Moat Duel: Analyzing Competitive Defensibility
A structural moat is the only thing protecting long-term profits from relentless competition erosion. Let’s dissect the sources of economic advantage:
Fair Isaac Corporation (FICO): Analytics Powerhouse with Intangible Asset Moat
FICO’s moat stems from proprietary analytics and scoring algorithms, reflected in a stellar 47% EBIT margin and 44% ROIC premium over WACC. Expansion into decision management deepens this edge in 2026.
Paycom Software, Inc. (PAYC): SaaS Efficiency and Scale Through Switching Costs
PAYC’s cloud-based HCM platform creates strong switching costs, shown by rapid 37.5% EBIT growth and a 17% ROIC premium. Its scalable SaaS model fuels expansion but faces more disruption risk than FICO.
Data Science Intellect vs. SaaS Stickiness: Which Moat Runs Deeper?
FICO’s intangible asset moat is wider and more durable, with higher profitability and stronger capital efficiency. I see it better positioned to defend market share amid evolving tech landscapes.
Which stock offers better returns?
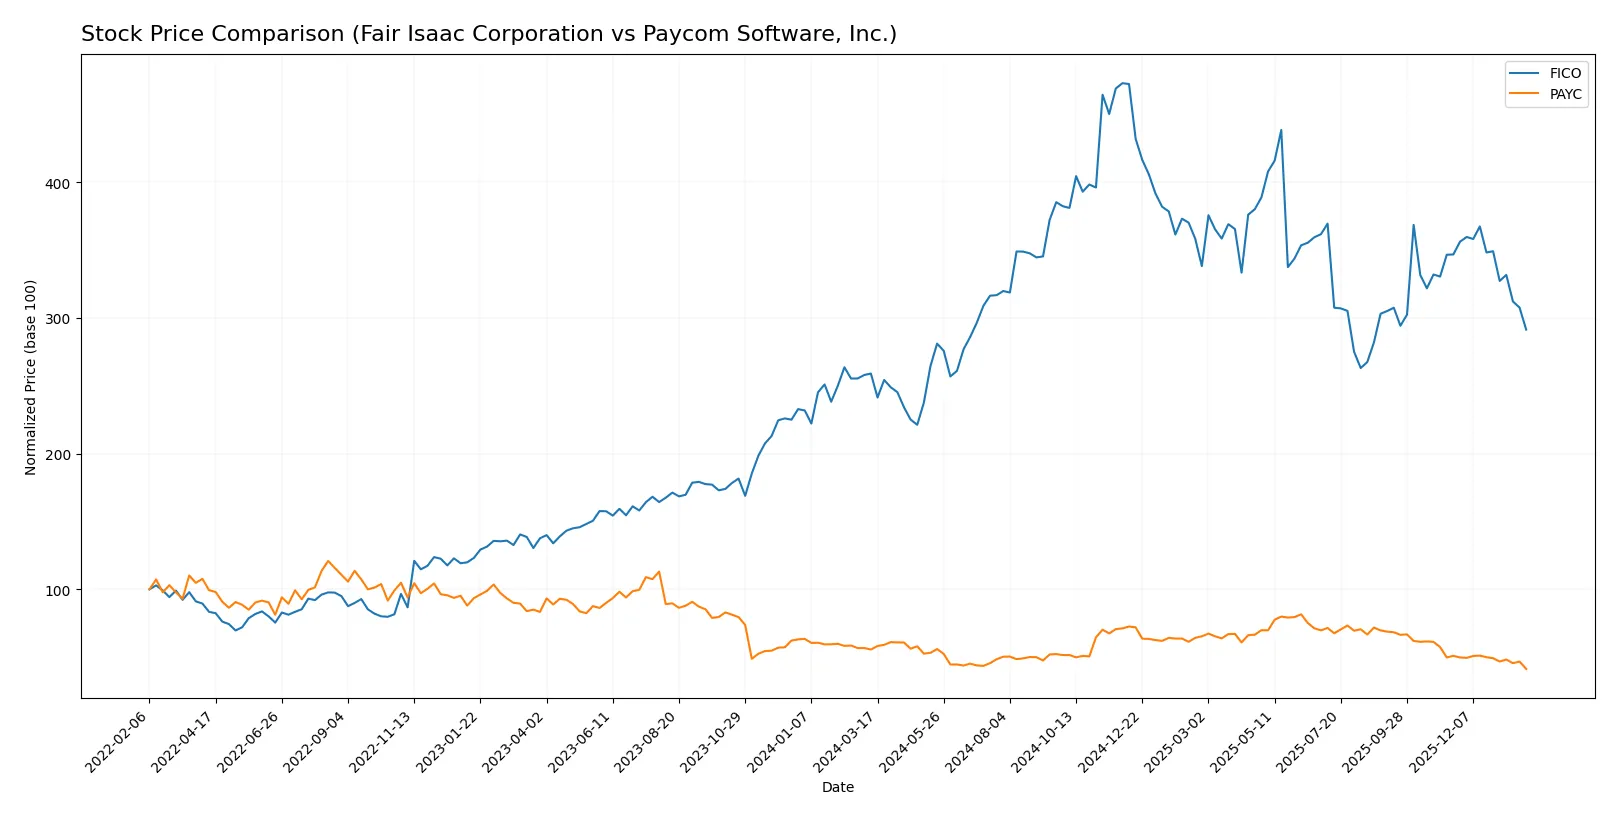
Over the past 12 months, Fair Isaac Corporation’s shares gained 12.51%, showing a bullish trend with decelerating momentum. Paycom Software, Inc. fell 25.64%, marking a bearish trend with slowing downside pressure.
Trend Comparison
Fair Isaac Corporation’s stock rose 12.51% over the past year, reflecting a bullish trend with decelerating gains. The price peaked at 2375.03 and found a low near 1110.85.
Paycom Software, Inc. declined 25.64% over the same period, confirming a bearish trend with deceleration. Its highest price was 265.71, with a low of 134.75.
Comparing trends, Fair Isaac Corporation outperformed Paycom Software, delivering the strongest market performance over the past 12 months.
Target Prices
Analysts present a confident target consensus for Fair Isaac Corporation and Paycom Software, Inc.
| Company | Target Low | Target High | Consensus |
|---|---|---|---|
| Fair Isaac Corporation | 1,640 | 2,400 | 2,115 |
| Paycom Software, Inc. | 135 | 290 | 203.13 |
The target consensus for Fair Isaac stands well above its current price of 1,463, signaling expected upside. Paycom’s consensus target also exceeds its present 135, reflecting analyst optimism despite recent volatility.

Don’t Let Luck Decide Your Entry Point
Optimize your entry points with our advanced ProRealTime indicators. You’ll get efficient buy signals with precise price targets for maximum performance. Start outperforming now!
How do institutions grade them?
Fair Isaac Corporation Grades
The table below summarizes recent grades awarded to Fair Isaac Corporation by various firms.
| Grading Company | Action | New Grade | Date |
|---|---|---|---|
| Needham | Maintain | Buy | 2026-01-29 |
| Jefferies | Maintain | Buy | 2026-01-16 |
| Wells Fargo | Maintain | Overweight | 2026-01-14 |
| JP Morgan | Maintain | Neutral | 2025-11-06 |
| Baird | Maintain | Outperform | 2025-11-06 |
| Jefferies | Maintain | Buy | 2025-11-06 |
| BMO Capital | Maintain | Outperform | 2025-11-06 |
| Wells Fargo | Maintain | Overweight | 2025-10-14 |
| Barclays | Maintain | Overweight | 2025-10-02 |
| Needham | Maintain | Buy | 2025-10-02 |
Paycom Software, Inc. Grades
Below is a summary of the latest grades assigned to Paycom Software, Inc. by credible institutions.
| Grading Company | Action | New Grade | Date |
|---|---|---|---|
| Cantor Fitzgerald | Maintain | Neutral | 2026-01-29 |
| UBS | Maintain | Buy | 2026-01-26 |
| Barclays | Maintain | Equal Weight | 2026-01-12 |
| TD Cowen | Maintain | Buy | 2026-01-08 |
| Citigroup | Maintain | Neutral | 2025-12-23 |
| Keybanc | Maintain | Overweight | 2025-11-06 |
| TD Cowen | Maintain | Buy | 2025-11-06 |
| UBS | Maintain | Buy | 2025-11-06 |
| Jefferies | Maintain | Hold | 2025-11-06 |
| Mizuho | Maintain | Neutral | 2025-11-06 |
Which company has the best grades?
Fair Isaac Corporation consistently receives higher ratings such as Buy, Overweight, and Outperform. Paycom Software shows mixed grades with more Neutral and Hold ratings. This difference may influence investor confidence and portfolio positioning.
Risks specific to each company
The following categories identify critical pressure points and systemic threats facing both firms in the 2026 market environment:
1. Market & Competition
Fair Isaac Corporation
- Faces intense competition in analytics and decision software with pressure to innovate rapidly.
Paycom Software, Inc.
- Operates in a crowded HCM SaaS market with fierce competition and constant innovation demands.
2. Capital Structure & Debt
Fair Isaac Corporation
- Exhibits a concerning debt-to-assets ratio of 165%, signaling elevated financial leverage risks.
Paycom Software, Inc.
- Maintains a very low debt-to-assets ratio (~1.4%), indicating strong balance sheet health.
3. Stock Volatility
Fair Isaac Corporation
- Higher beta (1.29) suggests greater sensitivity to market swings, increasing volatility risk.
Paycom Software, Inc.
- Lower beta (0.82) implies more stable stock behavior and reduced volatility risk.
4. Regulatory & Legal
Fair Isaac Corporation
- Potential exposure to regulatory shifts in data privacy and financial compliance.
Paycom Software, Inc.
- Faces regulatory scrutiny around payroll, labor laws, and data security compliance.
5. Supply Chain & Operations
Fair Isaac Corporation
- Relies on software development and cloud infrastructure, vulnerable to tech disruptions.
Paycom Software, Inc.
- Dependent on cloud operations and software delivery, risks from service outages or cyberthreats.
6. ESG & Climate Transition
Fair Isaac Corporation
- Moderate ESG risk given software sector exposure; climate transition impact limited but reputational risks exist.
Paycom Software, Inc.
- Faces ESG risks in governance and data security; climate transition impact minimal but evolving.
7. Geopolitical Exposure
Fair Isaac Corporation
- Operates globally, exposing it to geopolitical risks across multiple regions.
Paycom Software, Inc.
- Primarily US-focused, with lower exposure to international geopolitical risks.
Which company shows a better risk-adjusted profile?
Fair Isaac’s highest risk stems from its heavy financial leverage, raising solvency concerns despite strong operational metrics. Paycom’s main risk lies in its operational reliance on cloud infrastructure and regulatory compliance in a highly competitive SaaS space. Overall, Paycom presents a stronger risk-adjusted profile, supported by a healthier balance sheet and lower stock volatility. The stark contrast in debt-to-assets ratios and Paycom’s robust Altman Z-Score (3.6 vs. FICO’s 12.2 but with concerning leverage) justify my caution regarding Fair Isaac’s capital structure risks.
Final Verdict: Which stock to choose?
Fair Isaac Corporation’s superpower lies in its robust capital efficiency and durable competitive advantage, evidenced by a very favorable moat and strong cash generation. However, its low liquidity and elevated debt levels warrant caution. It suits portfolios aiming for aggressive growth with tolerance for financial risk.
Paycom Software commands a strategic moat through recurring revenue and strong profitability metrics, offering a safer financial profile than Fair Isaac. Its consistently favorable ratings and stable balance sheet make it attractive for investors seeking growth at a reasonable price with lower volatility.
If you prioritize high capital efficiency and are comfortable navigating financial leverage, Fair Isaac outshines as a compelling choice due to its strong ROIC and value creation. However, if you seek better stability and a cleaner balance sheet, Paycom offers superior resilience and a more balanced growth profile. Each fits distinct investor avatars with differing risk appetites.
Disclaimer: Investment carries a risk of loss of initial capital. The past performance is not a reliable indicator of future results. Be sure to understand risks before making an investment decision.
Go Further
I encourage you to read the complete analyses of Fair Isaac Corporation and Paycom Software, Inc. to enhance your investment decisions: