Home > Comparison > Technology > FICO vs MTCH
The strategic rivalry between Fair Isaac Corporation and Match Group, Inc. defines leadership in the technology sector’s software application space. Fair Isaac is a data-driven analytics and decision management provider, while Match Group dominates global online dating platforms. This head-to-head pits a capital-light, high-value analytics model against a user-driven, scalable consumer service. This analysis will weigh their corporate trajectories to identify the superior risk-adjusted investment for a diversified portfolio.
Table of contents
Companies Overview
Fair Isaac Corporation and Match Group, Inc. stand as pivotal players in the software application market with distinct market roles.
Fair Isaac Corporation: Analytics Powerhouse for Decision Automation
Fair Isaac Corporation dominates the analytics software sector by providing decision management solutions and scoring systems. Its revenue stems from two segments: Scores and Software, which automate and enhance business decisions globally. In 2026, the company focuses on expanding its modular FICO Platform to support advanced analytic use cases and integrate decision-making across industries.
Match Group, Inc.: Global Leader in Digital Dating Platforms
Match Group, Inc. leads the online dating market through a portfolio of popular brands like Tinder and Match. It generates revenue by offering subscription and advertising services across its digital platforms worldwide. In 2026, the company emphasizes growing user engagement and expanding its brand reach to capture more market share in digital social connectivity.
Strategic Collision: Similarities & Divergences
Both companies operate in software applications but diverge sharply in strategy. Fair Isaac applies a B2B analytic-driven model focused on decision automation, while Match Group pursues a B2C subscription-based social platform ecosystem. Their primary battleground is technology-driven user engagement, yet Fair Isaac’s corporate client focus contrasts with Match Group’s consumer-centric approach. This difference creates distinct risk and growth profiles for investors.
Income Statement Comparison
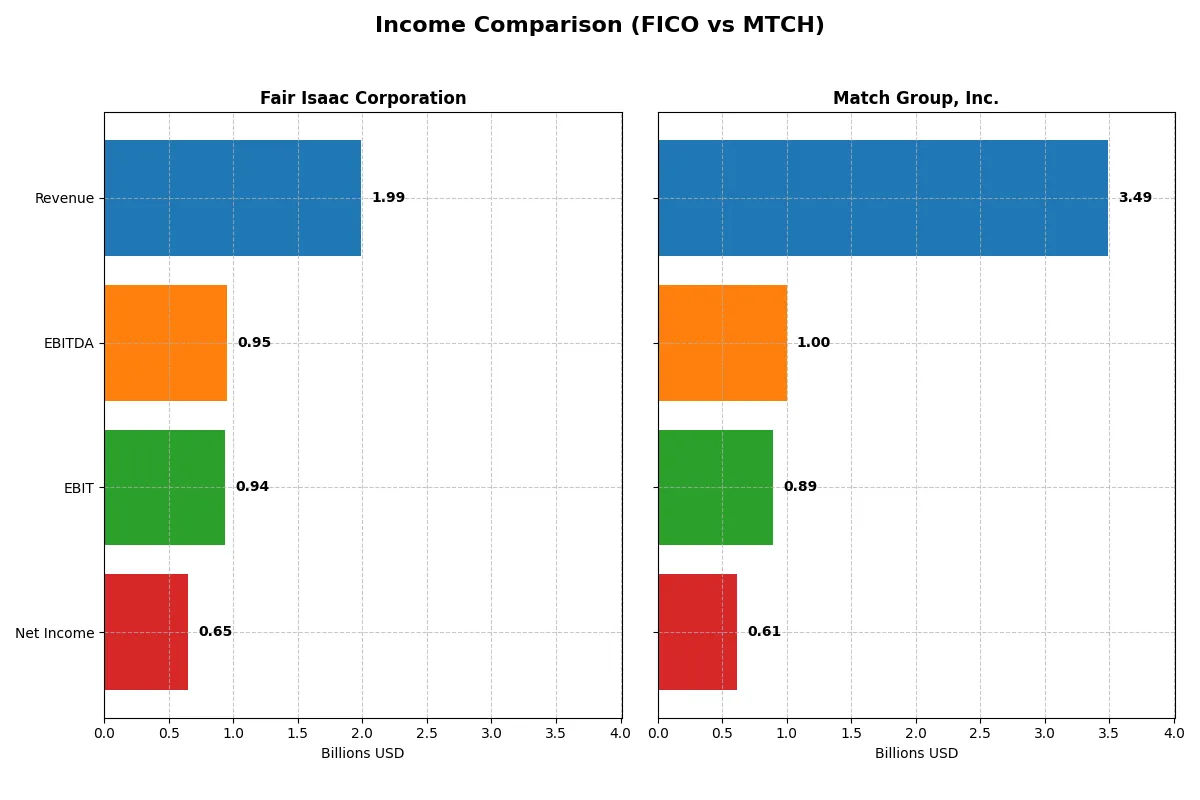
This data dissects the core profitability and scalability of both corporate engines to reveal who dominates the bottom line:
| Metric | Fair Isaac Corporation (FICO) | Match Group, Inc. (MTCH) |
|---|---|---|
| Revenue | 1.99B | 3.49B |
| Cost of Revenue | 354M | 948M |
| Operating Expenses | 712M | 1.67B |
| Gross Profit | 1.64B | 2.54B |
| EBITDA | 951M | 999M |
| EBIT | 936M | 894M |
| Interest Expense | 134M | 148M |
| Net Income | 652M | 613M |
| EPS | 26.9 | 2.53 |
| Fiscal Year | 2025 | 2025 |
Income Statement Analysis: The Bottom-Line Duel
This income statement comparison reveals which company runs a more efficient and profitable corporate engine through recent performance metrics.
Fair Isaac Corporation (FICO) Analysis
FICO’s revenue climbed 16% in 2025 to $1.99B, with net income surging 27% to $652M. The company maintains robust margins—an 82% gross margin and a 33% net margin—showcasing operational strength. Its 47% EBIT margin highlights tight cost control and growing profitability momentum entering 2026.
Match Group, Inc. (MTCH) Analysis
MTCH generated $3.49B revenue in 2025, almost flat year-over-year, while net income rose 11% to $613M. Gross and net margins stand at 73% and 18%, respectively, reflecting solid but less efficient operations than FICO. EBIT margin improved moderately to 26%, signaling cautious cost management amid slower revenue growth.
Margin Dominance vs. Scale Resilience
FICO outperforms MTCH on margin quality and revenue growth momentum, delivering nearly double the net margin and faster top-line expansion. MTCH boasts scale with triple FICO’s revenue but at the cost of thinner margins and slower growth. For investors prioritizing efficiency and profit growth, FICO’s profile proves more attractive.
Financial Ratios Comparison
These vital ratios act as a diagnostic tool to expose the underlying fiscal health, valuation premiums, and capital efficiency of the companies compared below:
| Ratios | Fair Isaac Corporation (FICO) | Match Group, Inc. (MTCH) |
|---|---|---|
| ROE | -37.3% | -241.9% |
| ROIC | 52.96% | 22.50% |
| P/E | 55.64 | 12.77 |
| P/B | -20.78 | -30.91 |
| Current Ratio | 0.83 | 1.42 |
| Quick Ratio | 0.83 | 1.42 |
| D/E (Debt/Equity) | -1.76 | -15.67 |
| Debt-to-Assets | 164.6% | 89.1% |
| Interest Coverage | 6.92 | 5.91 |
| Asset Turnover | 1.07 | 0.78 |
| Fixed Asset Turnover | 21.20 | 26.59 |
| Payout ratio | 0% | 30.4% |
| Dividend yield | 0% | 2.38% |
| Fiscal Year | 2025 | 2025 |
Efficiency & Valuation Duel: The Vital Signs
Financial ratios serve as a company’s DNA, uncovering hidden risks and operational strengths beyond surface-level metrics.
Fair Isaac Corporation
Fair Isaac exhibits strong operational efficiency with a 32.75% net margin and a robust 52.96% ROIC, well above its 9.23% WACC, indicating value creation. However, its high P/E of 55.64 signals an expensive valuation. The company pays no dividend, focusing on reinvestment through R&D and growth initiatives, which supports long-term shareholder value despite a negative ROE.
Match Group, Inc.
Match Group shows moderate profitability with a 17.59% net margin and a 22.5% ROIC, comfortably above its 7.81% WACC, reflecting efficient capital use. Its P/E of 12.77 suggests the stock trades at a reasonable multiple. The firm offers a 2.38% dividend yield, returning cash to shareholders while maintaining favorable liquidity and leverage profiles.
Premium Valuation vs. Balanced Returns
Fair Isaac commands a premium valuation driven by operational excellence but carries risks from negative returns on equity and no dividend payout. Match Group balances moderate profitability with shareholder returns and a more attractive valuation. Investors seeking growth might prefer Fair Isaac’s reinvestment focus, while those favoring income and valuation discipline may lean toward Match Group.
Which one offers the Superior Shareholder Reward?
Fair Isaac Corporation (FICO) pays no dividends but generates strong free cash flow, reinvesting heavily in growth. Match Group, Inc. (MTCH) offers a 2.38% dividend yield with a 30% payout ratio and modest buybacks. FICO’s zero payout but robust buybacks and reinvestment suggest higher long-term value creation. MTCH provides steady income but at lower growth margins. I find FICO’s distribution model superior for total shareholder reward in 2026.
Comparative Score Analysis: The Strategic Profile
The radar chart reveals the fundamental DNA and trade-offs of Fair Isaac Corporation and Match Group, Inc., highlighting their financial strengths and weaknesses:
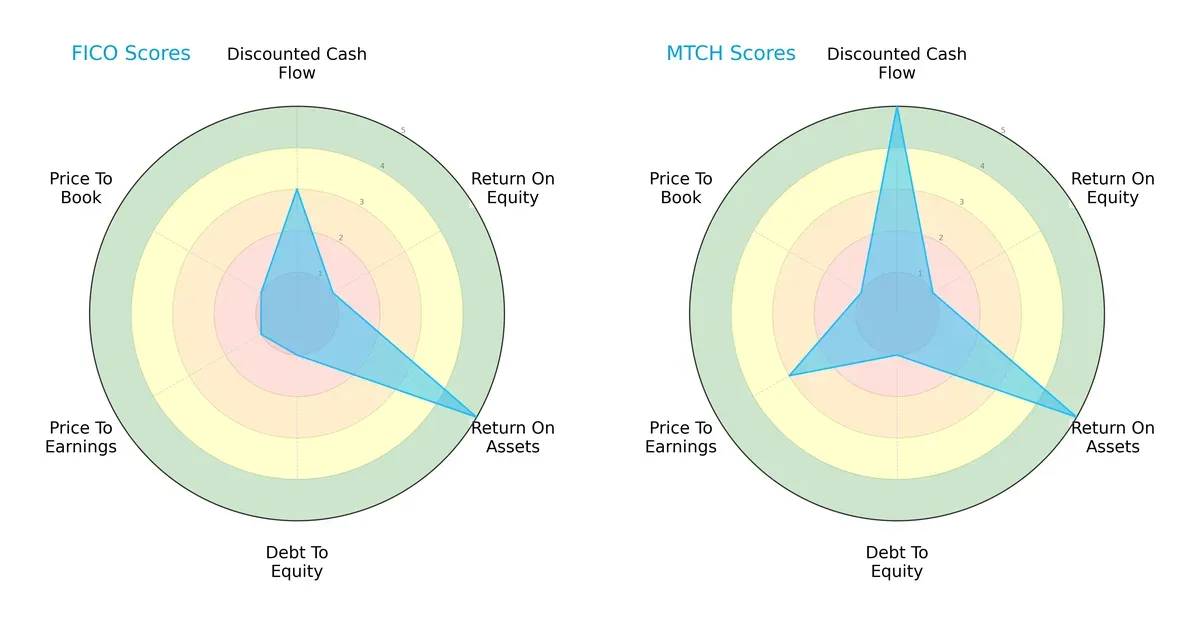
Fair Isaac shows strong asset utilization (ROA 5) but suffers from weak equity returns (ROE 1) and heavy leverage (Debt/Equity 1). Match Group also struggles with ROE and leverage but leads in discounted cash flow valuation (DCF 5) and a better price-to-earnings score (PE 3). Match Group presents a more balanced profile with superior valuation metrics, while Fair Isaac relies heavily on asset efficiency amid financial risks.
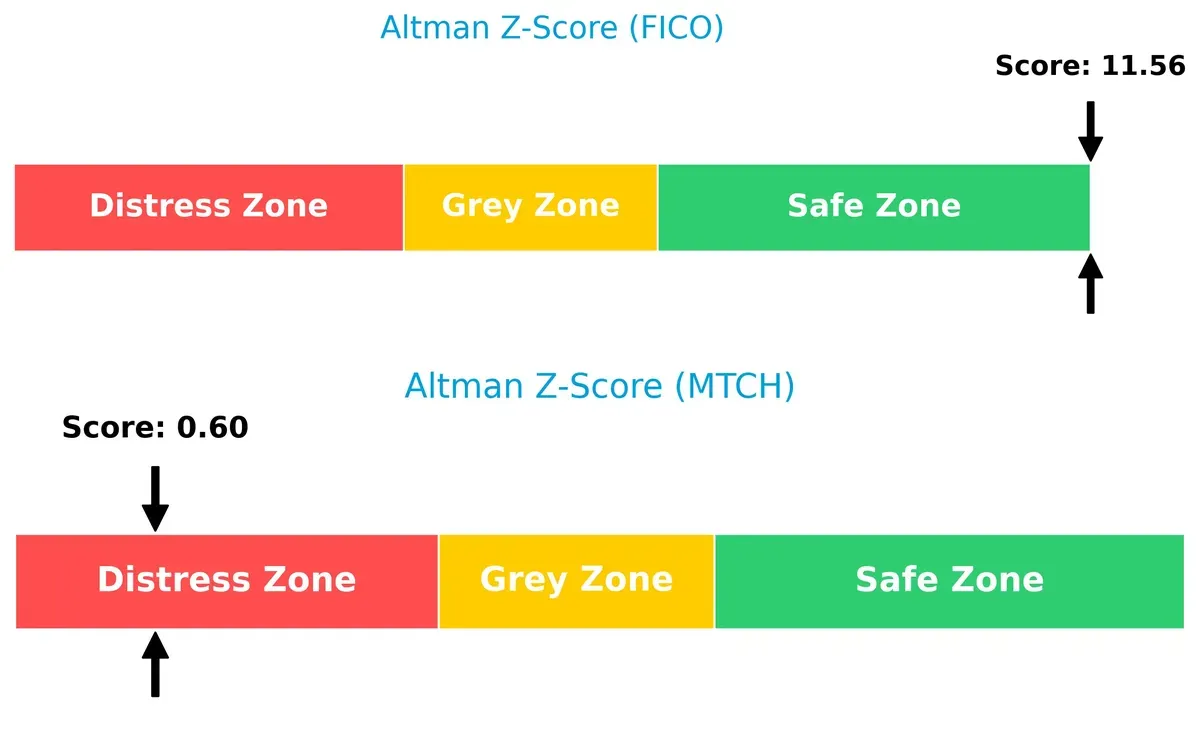
Bankruptcy Risk: Solvency Showdown
Match Group’s Altman Z-Score of 0.6 signals distress, implying high bankruptcy risk in this cycle. Fair Isaac’s robust 11.6 score places it comfortably in the safe zone, signaling strong long-term survival prospects:
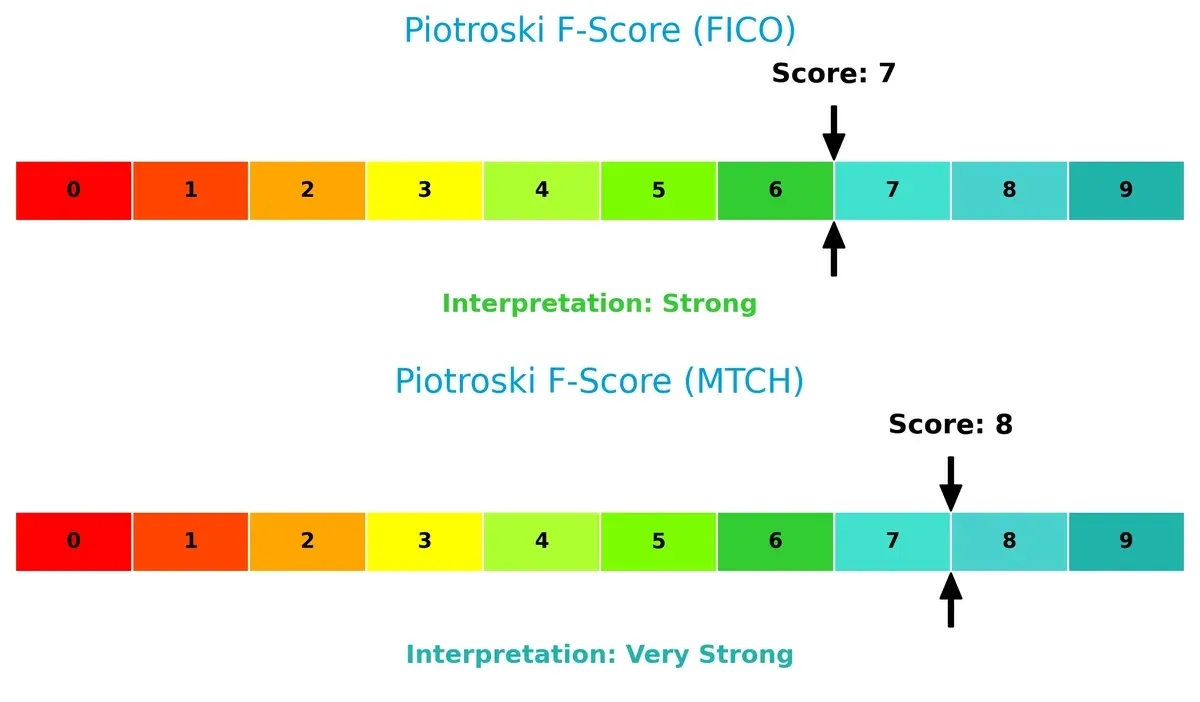
Financial Health: Quality of Operations
Both companies demonstrate solid operational quality with Piotroski scores of 7 (Fair Isaac) and 8 (Match Group). Match Group’s very strong score indicates slightly better financial health, while Fair Isaac’s strong rating shows no immediate red flags but room for improvement:
How are the two companies positioned?
This section dissects the operational DNA of FICO and MTCH by comparing their revenue distribution and internal strengths and weaknesses. The goal is to confront their economic moats to reveal which model offers the most resilient competitive advantage today.
Revenue Segmentation: The Strategic Mix
This visual comparison dissects how Fair Isaac Corporation and Match Group diversify income streams and pinpoints their primary sector bets:
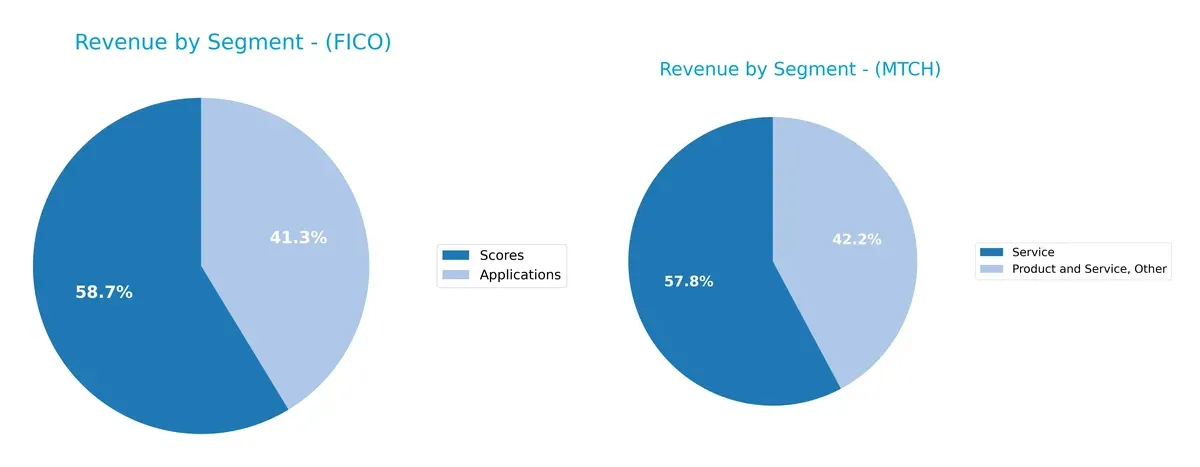
Fair Isaac Corporation pivots on two core segments: Scores at $1.17B and Applications at $822M in 2025, showing moderate diversification. Match Group relies heavily on a dominant segment—Service at $1.36B in 2020—while its secondary segment, Product and Service, Other, trails at $989M. FICO’s balanced split reduces concentration risk. Match Group’s reliance on one segment anchors its ecosystem but raises vulnerability to market shifts in its core service.
Strengths and Weaknesses Comparison
This table compares the Strengths and Weaknesses of Fair Isaac Corporation (FICO) and Match Group, Inc. (MTCH):
FICO Strengths
- High net margin at 32.75%
- Strong ROIC of 52.96%
- Favorable interest coverage at 7.01x
- High asset and fixed asset turnover
- Diverse revenue streams from Applications and Scores
- Solid global presence with significant Americas revenue
MTCH Strengths
- Favorable net margin at 17.59%
- ROIC of 22.5% exceeds WACC
- Lower PE ratio at 12.77 indicates valuation appeal
- Strong quick ratio of 1.42 supports liquidity
- High fixed asset turnover at 26.59
- Balanced US and Non-US revenue mix supports global reach
FICO Weaknesses
- Negative ROE at -37.34% signals low shareholder returns
- Current ratio below 1 at 0.83 indicates liquidity risk
- High debt-to-assets at 164.6% poses financial leverage concern
- Unfavorable PE ratio at 55.64 suggests overvaluation
- Zero dividend yield may deter income investors
MTCH Weaknesses
- Severely negative ROE at -241.99%
- Elevated debt-to-assets ratio at 89.06% raises leverage risk
- Asset turnover at 0.78 is neutral, limiting operational efficiency
- Some reliance on US market with 46% revenue concentration
- Dividend yield of 2.38% modest but positive
Both companies show strong profitability measures like ROIC and net margin, but suffer from negative ROE, signaling challenges in equity returns. FICO’s liquidity and leverage metrics raise red flags, while MTCH demonstrates better valuation and liquidity but faces extreme ROE weakness. These dynamics shape their strategic priorities around financial health and growth balance.
The Moat Duel: Analyzing Competitive Defensibility
A structural moat is the only true shield protecting long-term profits from relentless competition erosion. Let’s dissect the moats of two tech firms:
Fair Isaac Corporation: Data-Driven Analytical Moat
FICO’s competitive advantage lies in its proprietary credit scoring algorithms and extensive data assets. This creates switching costs, reflected in a high ROIC of 44% well above WACC. Continued innovation in decision management software strengthens its moat in 2026.
Match Group, Inc.: Network Effects and Brand Portfolio
MTCH leverages network effects through its diverse dating platforms. Unlike FICO’s data moat, MTCH’s strength shows in its scalable user base, driving a solid but lower ROIC of 15%. Expansion into niche markets offers growth but also invites disruption risks.
Data Dominance vs. Network Effects: The Moat Showdown
FICO’s wider moat, driven by a 43.7% ROIC premium over WACC and growing profitability, outpaces MTCH’s narrower but stable moat. FICO is better equipped to defend its market share through data and analytics superiority.
Which stock offers better returns?
The stocks of Fair Isaac Corporation and Match Group, Inc. show contrasting price movements over the past year, with FICO gaining significantly while MTCH declined moderately.
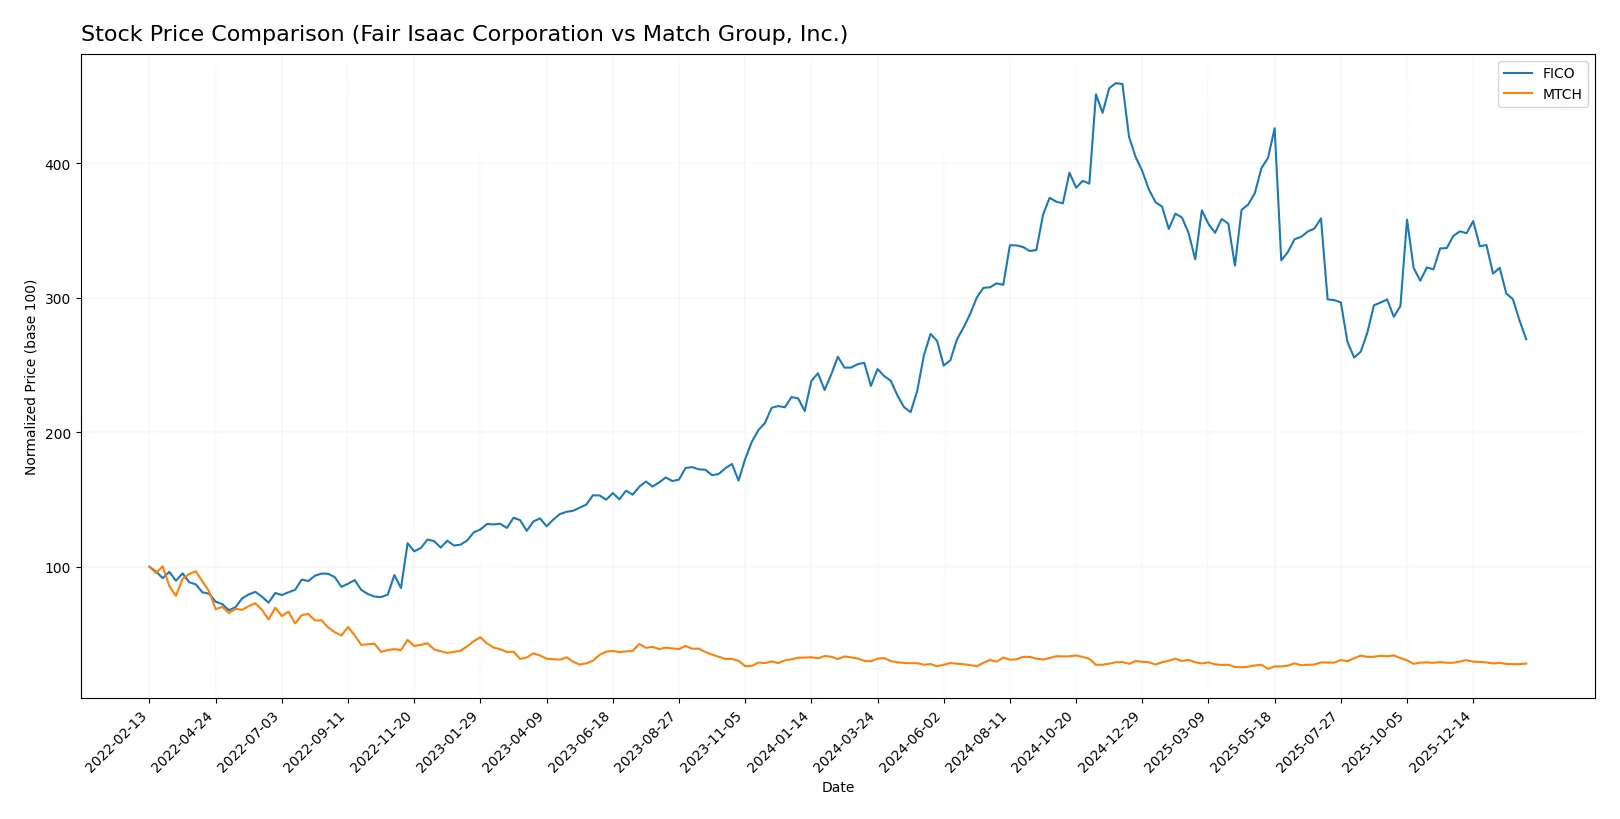
Trend Comparison
Fair Isaac Corporation’s stock gained 14.79% over the past year, indicating a bullish trend with decelerating momentum. Its price ranged from 1110.85 to 2375.03, showing notable volatility.
Match Group, Inc. experienced a 5.72% decline over the past year, marking a bearish trend with deceleration. Price fluctuated between 27.18 and 38.51, reflecting lower volatility compared to FICO.
FICO delivered the highest market performance, outperforming MTCH’s bearish trend by over 20 percentage points during the analyzed period.
Target Prices
Analysts present a constructive target price consensus for Fair Isaac Corporation and Match Group, Inc.
| Company | Target Low | Target High | Consensus |
|---|---|---|---|
| Fair Isaac Corporation | 1640 | 2400 | 2066.71 |
| Match Group, Inc. | 33 | 43 | 36 |
Fair Isaac’s target consensus at 2066.71 significantly exceeds the current price of 1391, indicating strong upside potential. Match Group’s consensus target of 36 also suggests modest appreciation above its current 31.63 price.

Don’t Let Luck Decide Your Entry Point
Optimize your entry points with our advanced ProRealTime indicators. You’ll get efficient buy signals with precise price targets for maximum performance. Start outperforming now!
How do institutions grade them?
Fair Isaac Corporation Grades
The table below summarizes recent institutional grades for Fair Isaac Corporation.
| Grading Company | Action | New Grade | Date |
|---|---|---|---|
| Goldman Sachs | Maintain | Buy | 2026-02-03 |
| Needham | Maintain | Buy | 2026-01-29 |
| Jefferies | Maintain | Buy | 2026-01-16 |
| Wells Fargo | Maintain | Overweight | 2026-01-14 |
| JP Morgan | Maintain | Neutral | 2025-11-06 |
| Baird | Maintain | Outperform | 2025-11-06 |
| Jefferies | Maintain | Buy | 2025-11-06 |
| BMO Capital | Maintain | Outperform | 2025-11-06 |
| Wells Fargo | Maintain | Overweight | 2025-10-14 |
| Barclays | Maintain | Overweight | 2025-10-02 |
Match Group, Inc. Grades
The table below summarizes recent institutional grades for Match Group, Inc.
| Grading Company | Action | New Grade | Date |
|---|---|---|---|
| TD Cowen | Maintain | Buy | 2026-02-05 |
| JP Morgan | Maintain | Neutral | 2026-02-04 |
| Truist Securities | Maintain | Hold | 2026-02-04 |
| Morgan Stanley | Maintain | Equal Weight | 2026-01-13 |
| Truist Securities | Maintain | Hold | 2025-11-05 |
| Evercore ISI Group | Maintain | In Line | 2025-11-05 |
| Wells Fargo | Maintain | Equal Weight | 2025-11-05 |
| Morgan Stanley | Maintain | Equal Weight | 2025-10-20 |
| Susquehanna | Maintain | Positive | 2025-08-07 |
| JP Morgan | Maintain | Neutral | 2025-08-06 |
Which company has the best grades?
Fair Isaac Corporation holds consistently stronger grades, including multiple Buy and Outperform ratings. Match Group’s grades cluster around Neutral to Hold. Investors may interpret Fair Isaac’s superior institutional confidence as a sign of better near-term prospects.
Risks specific to each company
The following categories identify the critical pressure points and systemic threats facing both firms in the 2026 market environment:
1. Market & Competition
Fair Isaac Corporation
- Faces intense competition in analytics software with pressure from AI-driven startups and large tech players.
Match Group, Inc.
- Operates in a highly competitive dating app market with constant innovation and shifting user preferences.
2. Capital Structure & Debt
Fair Isaac Corporation
- Exhibits very high debt-to-assets ratio (165%), signaling leverage concerns despite strong interest coverage.
Match Group, Inc.
- High debt load (89% debt-to-assets) poses risk, though interest coverage remains adequate.
3. Stock Volatility
Fair Isaac Corporation
- Beta at 1.27 indicates moderate volatility, with stock price range wide from 1284 to 2218.
Match Group, Inc.
- Slightly higher beta of 1.32 reflects elevated volatility in a consumer tech sector.
4. Regulatory & Legal
Fair Isaac Corporation
- Subject to data privacy and financial regulation risks affecting analytics and scoring products.
Match Group, Inc.
- Faces regulatory scrutiny over user data protection and content moderation on dating platforms.
5. Supply Chain & Operations
Fair Isaac Corporation
- Relies on stable software development and cloud infrastructure; operational disruption risk modest.
Match Group, Inc.
- Operational risks stem from platform reliability and scaling issues amid fluctuating user engagement.
6. ESG & Climate Transition
Fair Isaac Corporation
- Moderate exposure to ESG risks; depends on energy-efficient data centers and ethical data use.
Match Group, Inc.
- Increasing pressure to enhance ESG credentials, particularly on privacy and corporate governance.
7. Geopolitical Exposure
Fair Isaac Corporation
- Global operations expose it to geopolitical tensions affecting data flow and regulatory regimes.
Match Group, Inc.
- International user base brings risks from geopolitical instability and varied internet regulations.
Which company shows a better risk-adjusted profile?
Fair Isaac’s most impactful risk lies in its highly leveraged balance sheet, creating financial strain despite its strong operational metrics. Match Group’s primary risk centers on regulatory and legal challenges tied to user data privacy. Match Group’s overall financial ratios and rating scores are more favorable, reflecting a stronger risk-adjusted profile. Notably, Match Group’s Altman Z-Score signals distress, but its robust Piotroski Score and better liquidity metrics provide some cushion. Fair Isaac’s severe debt-to-assets ratio and unfavorable liquidity ratios raise red flags for financial stability.
Final Verdict: Which stock to choose?
Fair Isaac Corporation (FICO) wields unmatched operational efficiency and a robust economic moat, delivering consistent value creation through high ROIC over WACC. Its point of vigilance lies in liquidity constraints, signaling caution for capital flexibility. FICO suits portfolios seeking aggressive growth with a tolerance for short-term balance sheet risks.
Match Group, Inc. (MTCH) boasts a strategic moat rooted in recurring revenue and strong free cash flow yield, offering a safer financial profile than FICO. Its valuation metrics are more attractive, supporting a GARP (Growth at a Reasonable Price) approach. MTCH fits investors prioritizing stability alongside growth potential.
If you prioritize aggressive growth and operational excellence, FICO is the compelling choice due to its superior value creation and margin expansion. However, if you seek a balanced growth strategy with better liquidity and valuation safety, MTCH offers better stability and a more attractive entry point. Both present valid scenarios depending on risk appetite and investment horizon.
Disclaimer: Investment carries a risk of loss of initial capital. The past performance is not a reliable indicator of future results. Be sure to understand risks before making an investment decision.
Go Further
I encourage you to read the complete analyses of Fair Isaac Corporation and Match Group, Inc. to enhance your investment decisions: