Home > Comparison > Technology > INTU vs FICO
The strategic rivalry between Intuit Inc. and Fair Isaac Corporation shapes the Technology sector’s software-application landscape. Intuit operates as a diversified financial management platform targeting consumers and small businesses, while Fair Isaac focuses on advanced analytic and decision management software, primarily for enterprise clients. This head-to-head pits broad-market financial solutions against specialized analytic prowess. This analysis will identify which corporate strategy delivers a superior risk-adjusted return for a diversified investment portfolio.
Table of contents
Companies Overview
Intuit Inc. and Fair Isaac Corporation command critical roles in the software application sector, shaping financial technology landscapes.
Intuit Inc.: Financial Management Powerhouse
Intuit Inc. dominates with financial management and compliance products for consumers and small businesses. It generates revenue through QuickBooks, TurboTax, and Credit Karma platforms. In 2026, Intuit sharpens its strategic focus on cloud-based solutions and integrated payment processing, enhancing user experience across its Small Business & Self-Employed and Consumer segments.
Fair Isaac Corporation: Analytics and Decision Intelligence Leader
Fair Isaac Corporation specializes in analytic software and data management that automate business decisions globally. Its core revenue stems from scoring solutions and decision management software. The company’s 2026 strategy emphasizes modular, configurable platforms that solve marketing, fraud detection, and compliance challenges, targeting enterprise clients through direct and indirect sales channels.
Strategic Collision: Similarities & Divergences
Both companies leverage software to enhance financial decision-making but diverge in approach: Intuit prioritizes an integrated ecosystem for small businesses and consumers, while Fair Isaac focuses on flexible analytics platforms for enterprises. Their primary battleground lies in financial automation, yet Intuit appeals to end users, and Fair Isaac targets institutional clients. This difference shapes distinct risk profiles and growth trajectories for investors.
Income Statement Comparison
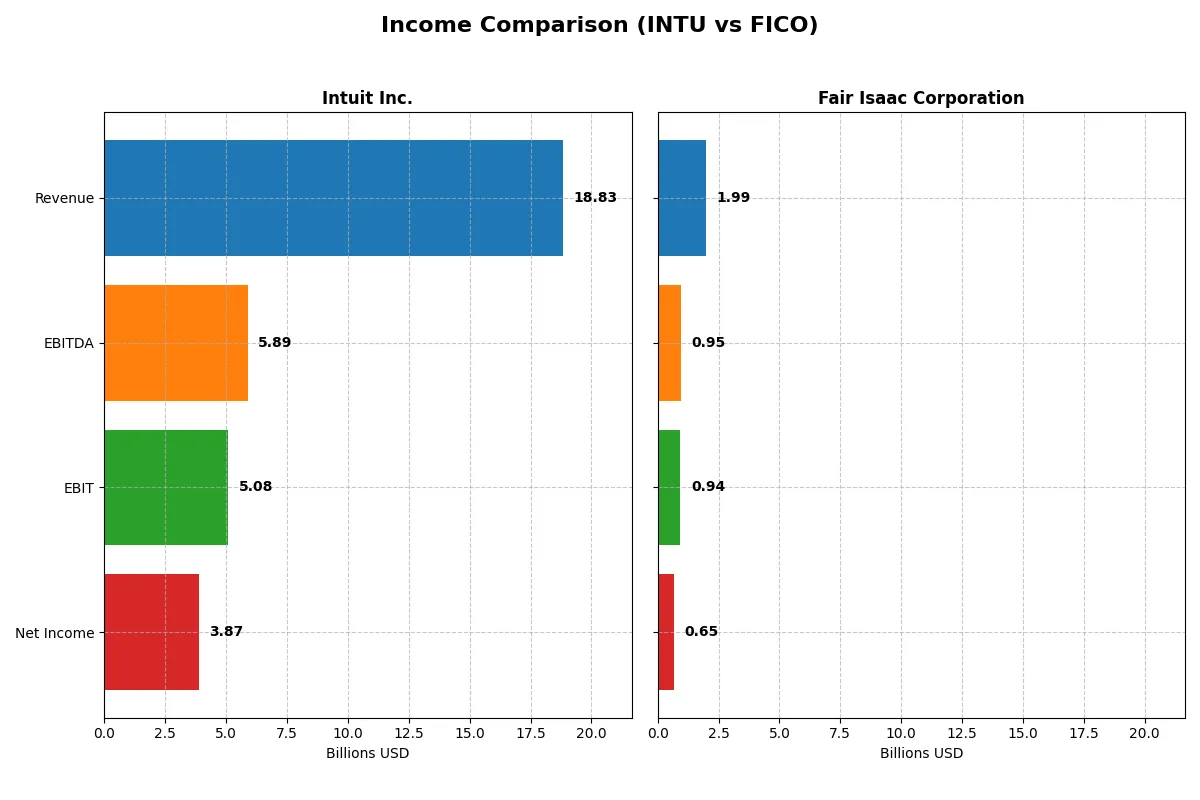
This data dissects the core profitability and scalability of both corporate engines to reveal who dominates the bottom line:
| Metric | Intuit Inc. (INTU) | Fair Isaac Corporation (FICO) |
|---|---|---|
| Revenue | 18.8B | 1.99B |
| Cost of Revenue | 3.62B | 354M |
| Operating Expenses | 10.3B | 712M |
| Gross Profit | 15.2B | 1.64B |
| EBITDA | 5.89B | 951M |
| EBIT | 5.08B | 936M |
| Interest Expense | 247M | 134M |
| Net Income | 3.87B | 652M |
| EPS | 13.82 | 26.90 |
| Fiscal Year | 2025 | 2025 |
Income Statement Analysis: The Bottom-Line Duel
The following income statement comparison exposes which company runs a more efficient and profitable business engine through recent financial performance.
Intuit Inc. Analysis
Intuit’s revenue climbed from $9.6B in 2021 to $18.8B in 2025, nearly doubling over five years. Net income surged from $2.1B to $3.9B, reflecting strong earnings momentum. The company sustains robust gross margins at 80.8% and net margins at 20.6%, signaling operational efficiency and scale benefits in 2025.
Fair Isaac Corporation Analysis
Fair Isaac’s revenue grew from $1.3B in 2021 to $2.0B in 2025, a solid 51% increase. Net income rose from $392M to $652M, showing consistent profitability gains. Its gross margin stands at 82.2%, with an impressive net margin of 32.8%, highlighting superior profitability and cost control despite a higher interest burden.
Margin Power vs. Revenue Scale
Intuit dominates in scale and absolute profit growth, nearly doubling revenue and net income in five years. Fair Isaac outpaces Intuit in margin strength, boasting a 32.8% net margin versus Intuit’s 20.6%. Investors seeking high-margin, steady profit growth may prefer Fair Isaac’s profile, while those favoring robust revenue expansion and sizeable net income might lean toward Intuit.
Financial Ratios Comparison
These vital ratios act as a diagnostic tool to expose the underlying fiscal health, valuation premiums, and capital efficiency of the companies compared:
| Ratios | Intuit Inc. (INTU) | Fair Isaac Corp (FICO) |
|---|---|---|
| ROE | 19.6% | -37.3% |
| ROIC | 14.8% | 52.9% |
| P/E | 56.8 | 55.6 |
| P/B | 11.2 | -20.8 |
| Current Ratio | 1.36 | 0.83 |
| Quick Ratio | 1.36 | 0.83 |
| D/E | 0.34 | -1.76 |
| Debt-to-Assets | 18.0% | 165.0% |
| Interest Coverage | 19.9 | 6.9 |
| Asset Turnover | 0.51 | 1.07 |
| Fixed Asset Turnover | 12.5 | 21.2 |
| Payout ratio | 31% | 0% |
| Dividend yield | 0.54% | 0% |
| Fiscal Year | 2025 | 2025 |
Efficiency & Valuation Duel: The Vital Signs
Financial ratios act as a company’s DNA, exposing operational strengths and hidden risks critical for smart investing decisions.
Intuit Inc.
Intuit delivers solid profitability with a 19.6% ROE and a strong 20.6% net margin, signaling operational efficiency. However, its valuation appears stretched, with a high P/E of 56.8 and P/B of 11.1. Shareholders receive modest dividends at 0.54%, while the company reinvests heavily in R&D to sustain growth.
Fair Isaac Corporation
Fair Isaac boasts exceptional profitability, reflected in a 32.8% net margin and a robust 53.0% ROIC, but its ROE is deeply negative at -37.3%, flagging equity challenges. The stock trades at a lofty P/E of 55.6. It pays no dividend, instead prioritizing growth and innovation amid a weak current ratio of 0.83, a liquidity concern.
Premium Valuation vs. Operational Safety
Intuit balances strong profitability and decent liquidity despite expensive multiples. Fair Isaac shows higher operational returns but suffers from poor equity returns and liquidity. Intuit suits investors favoring stability and moderate yield, while Fair Isaac fits those chasing aggressive growth with elevated risk.
Which one offers the Superior Shareholder Reward?
I see Intuit Inc. (INTU) pays a modest dividend yield of ~0.54%, with a payout ratio around 31%, well-covered by free cash flow (FCF coverage ratio near 4.7). Their buyback program is steady but not explicitly quantified here. Fair Isaac Corporation (FICO) pays no dividends, instead reinvesting heavily in growth, indicated by high operating and free cash flow margins but negative book values and substantial leverage. FICO’s buybacks are not detailed but likely minimal given capital deployment to growth and debt management. Intuit’s balanced dividend and buyback approach offers more sustainable shareholder rewards in 2026. I conclude INTU delivers a more attractive total return profile, balancing income and capital appreciation, while FICO’s reinvestment strategy carries higher risk without immediate shareholder distributions.
Comparative Score Analysis: The Strategic Profile
The radar chart reveals the fundamental DNA and trade-offs of Intuit Inc. and Fair Isaac Corporation, highlighting their core financial strengths and vulnerabilities:
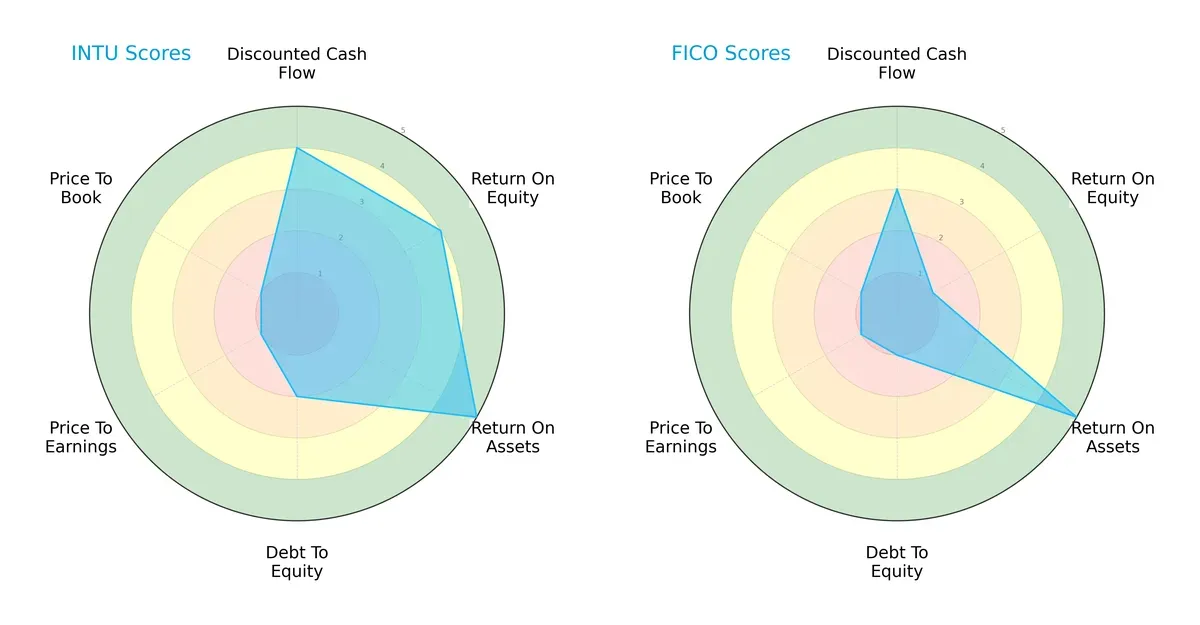
Intuit shows a more balanced profile, excelling in ROE (4) and ROA (5), but carries moderate debt risk (2) and very unfavorable valuation scores (PE and PB at 1). Fair Isaac relies heavily on asset efficiency (ROA 5) but struggles with equity returns (ROE 1) and financial leverage (debt-to-equity 1). Intuit’s stronger cash flow and equity returns suggest a sustainable moat, while Fair Isaac’s profile signals dependence on asset utilization without robust equity profitability.
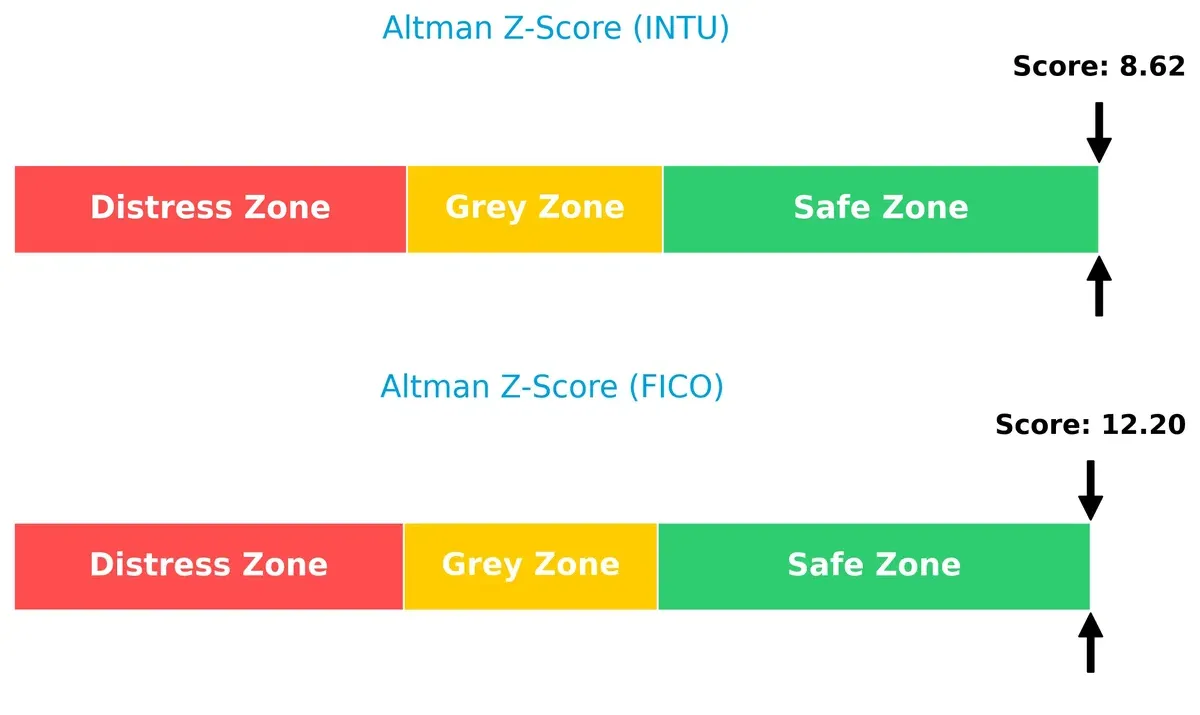
Bankruptcy Risk: Solvency Showdown
Intuit’s Altman Z-Score of 8.62 versus Fair Isaac’s 12.20 places both firms firmly in the safe zone, implying low bankruptcy risk amid current market cycles:
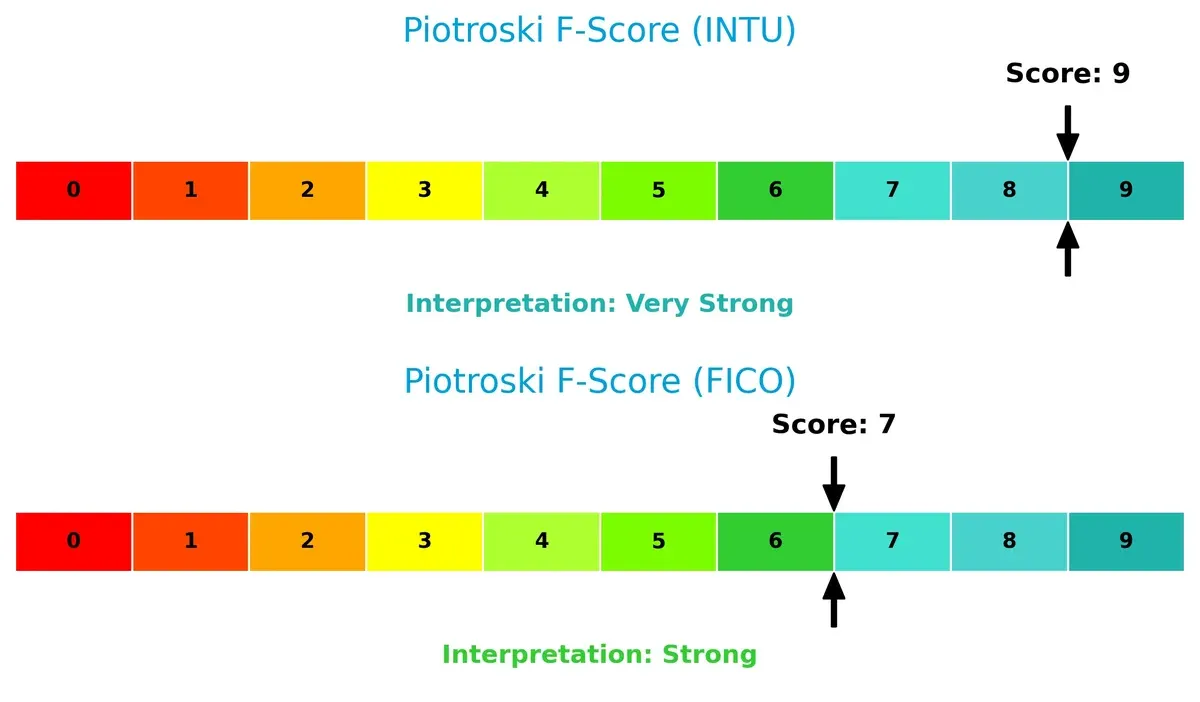
Financial Health: Quality of Operations
Intuit scores a perfect 9 on Piotroski’s scale, indicating peak financial health and operational excellence. Fair Isaac’s 7 is strong but with minor internal red flags compared to Intuit’s near-flawless score:
How are the two companies positioned?
This section dissects the operational DNA of Intuit and Fair Isaac by comparing their revenue distribution and internal strengths and weaknesses. The goal is to confront their economic moats and identify which model offers the most resilient competitive advantage today.
Revenue Segmentation: The Strategic Mix
The following visual comparison dissects how Intuit Inc. and Fair Isaac Corporation diversify their income streams and where their primary sector bets lie:
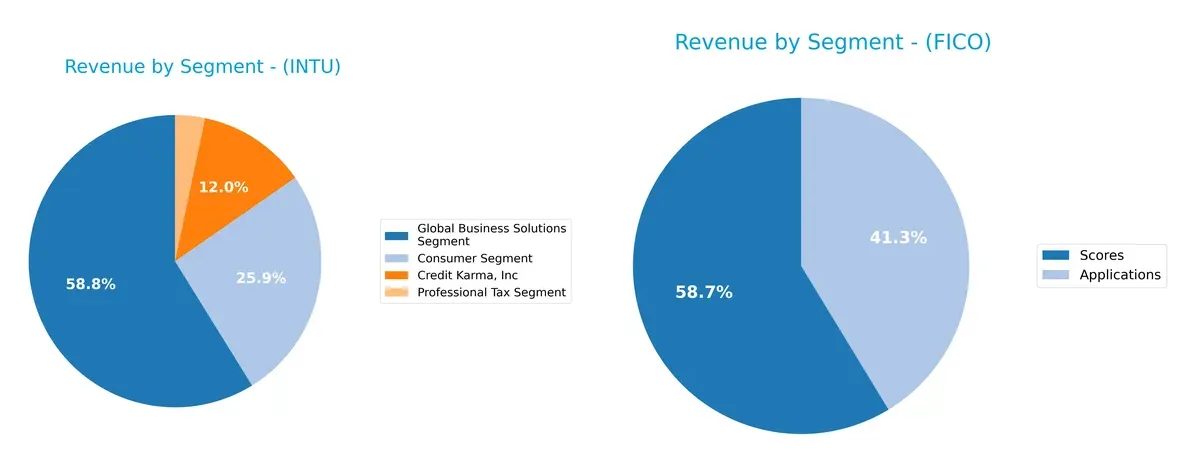
Intuit Inc. anchors revenue in its Global Business Solutions Segment with $11.1B, supplemented by $4.9B Consumer and $2.3B Credit Karma segments, showing a moderately diversified footprint. In contrast, Fair Isaac leans heavily on Scores at $1.17B, with Applications trailing at $822M, revealing concentration risk. Intuit’s mix suggests ecosystem lock-in across consumer and business verticals, while Fair Isaac pivots on data analytics dominance but faces exposure to sector-specific volatility.
Strengths and Weaknesses Comparison
This table compares the strengths and weaknesses of Intuit Inc. and Fair Isaac Corporation based on key financial and business metrics:
Intuit Inc. Strengths
- Diversified revenue from consumer, small business, and tax segments
- Favorable net margin at 20.55%
- Strong ROE at 19.63%
- Low debt-to-assets at 17.96%
- High interest coverage ratio at 20.57
- Solid quick ratio at 1.36
- Efficient fixed asset turnover at 12.54
Fair Isaac Corporation Strengths
- High net margin at 32.75%
- Exceptional ROIC at 52.96%
- Favorable PB ratio despite negative value
- Strong interest coverage at 7.01
- Higher asset and fixed asset turnover ratios
- Global presence with revenues across Americas, Asia Pacific, and EMEA
Intuit Inc. Weaknesses
- Unfavorable PE at 56.82 and PB at 11.15
- Dividend yield low at 0.54%
- Neutral current ratio at 1.36
- Moderate asset turnover at 0.51
Fair Isaac Corporation Weaknesses
- Negative ROE at -37.34%
- Unfavorable current ratio at 0.83
- High debt-to-assets at 164.6%
- Zero dividend yield
- PE ratio unfavorable at 55.64
Intuit displays balanced strengths in profitability and low leverage with moderate liquidity. Fair Isaac excels in profitability and asset efficiency but faces significant concerns from negative ROE and high leverage. These differences highlight contrasting risk profiles and capital structures.
The Moat Duel: Analyzing Competitive Defensibility
A structural moat is the only reliable shield protecting long-term profits from relentless competitive erosion. Let’s dissect two leaders’ moats:
Intuit Inc.: Switching Costs Powerhouse
Intuit’s moat stems from high switching costs embedded in its QuickBooks ecosystem. This drives stable margins and 20.5% net margin in 2025. However, declining ROIC signals emerging pressure on profitability.
Fair Isaac Corporation: Data-Driven Advantage
FICO leverages proprietary analytics and scoring algorithms as a formidable intangible asset moat. It maintains a robust 32.7% net margin and growing ROIC, reflecting a widening competitive gap. Expansion into global markets fuels future growth potential.
Durable Analytics Moat vs. Sticky Ecosystem Lock-in
FICO’s data-anchored moat outpaces Intuit’s switching cost barrier with stronger margin expansion and rising ROIC. FICO stands better positioned to defend and grow market share amid intensifying industry competition.
Which stock offers better returns?
The stock price chart highlights contrasting movements over the past year, with Intuit Inc. showing sustained decline and Fair Isaac Corporation exhibiting overall gains despite recent setbacks.
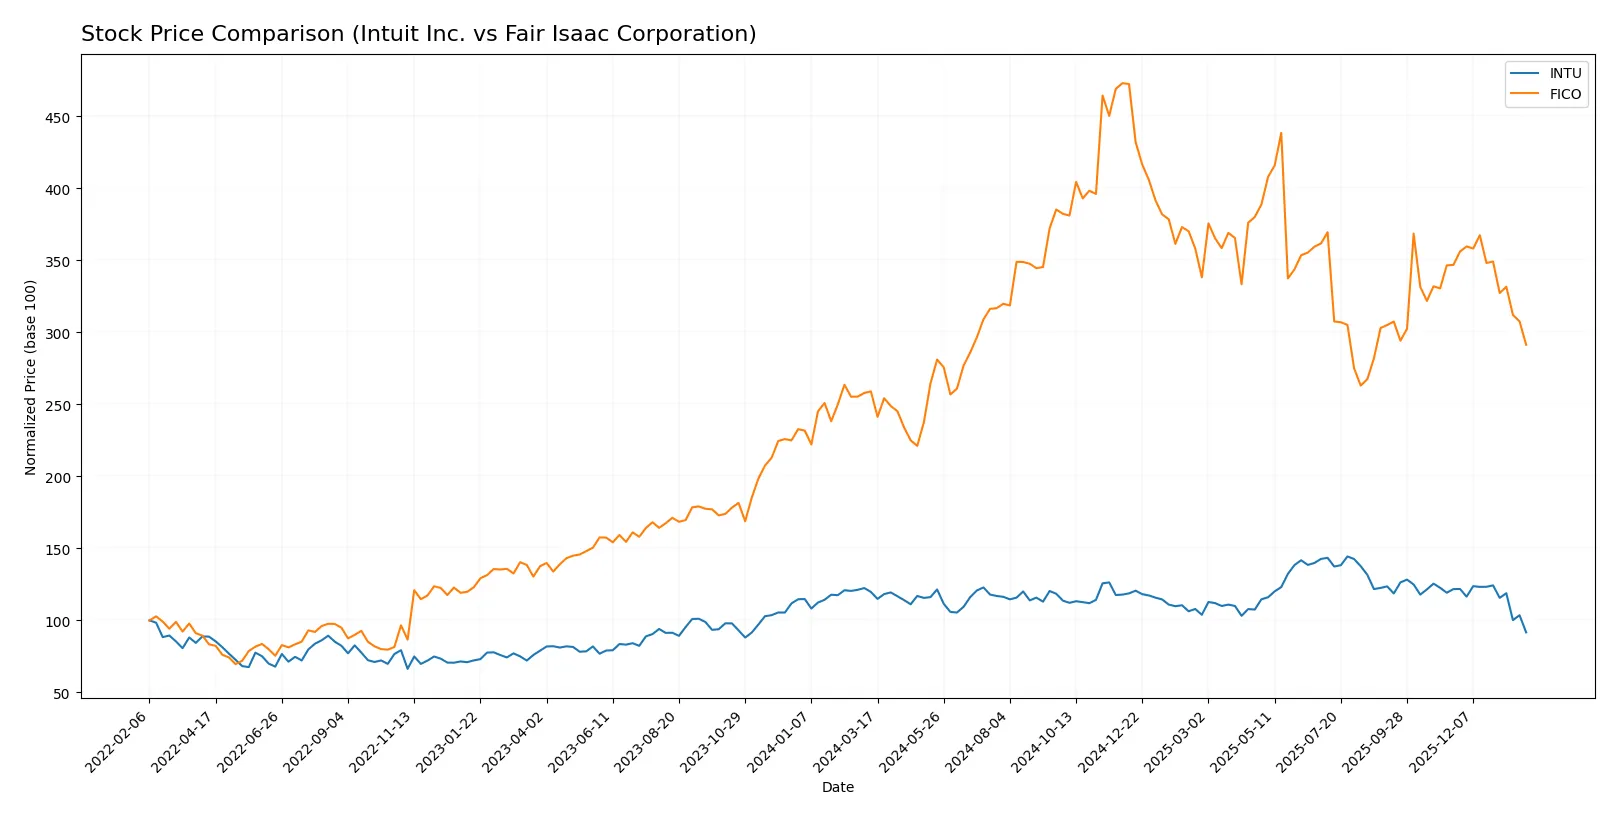
Trend Comparison
Intuit Inc. experienced a 23.45% decline over the past year, marking a bearish trend with decelerating losses and a price range between 499 and 786. Volatility remains moderate at a 54.27 standard deviation.
Fair Isaac Corporation posted a 12.51% gain over the same period, indicating a bullish trend despite recent deceleration and a sharp 15.98% drop. Price fluctuated widely, from 1,111 to 2,375, with high volatility at 285.65 standard deviation.
Fair Isaac’s stock outperformed Intuit’s over the past year, delivering positive returns versus Intuit’s significant losses, despite recent downward pressure on both stocks.
Target Prices
Analysts set optimistic targets for Intuit Inc. and Fair Isaac Corporation, indicating strong growth expectations.
| Company | Target Low | Target High | Consensus |
|---|---|---|---|
| Intuit Inc. | 700 | 880 | 798.4 |
| Fair Isaac Corp. | 1640 | 2400 | 2115 |
The target consensus for Intuit is about 60% above its current price of 499, signaling substantial upside. Fair Isaac’s consensus sits approximately 45% above its 1463 price, reflecting robust analyst confidence.

Don’t Let Luck Decide Your Entry Point
Optimize your entry points with our advanced ProRealTime indicators. You’ll get efficient buy signals with precise price targets for maximum performance. Start outperforming now!
How do institutions grade them?
Intuit Inc. Grades
The following table summarizes recent institutional grades for Intuit Inc.:
| Grading Company | Action | New Grade | Date |
|---|---|---|---|
| Wells Fargo | Downgrade | Equal Weight | 2026-01-08 |
| Wells Fargo | Maintain | Overweight | 2025-11-21 |
| RBC Capital | Maintain | Outperform | 2025-11-21 |
| BMO Capital | Maintain | Outperform | 2025-11-21 |
| Evercore ISI Group | Maintain | Outperform | 2025-11-18 |
| RBC Capital | Maintain | Outperform | 2025-09-02 |
| UBS | Maintain | Neutral | 2025-08-22 |
| Barclays | Maintain | Overweight | 2025-08-22 |
| Morgan Stanley | Maintain | Overweight | 2025-08-22 |
| Keybanc | Maintain | Overweight | 2025-08-22 |
Fair Isaac Corporation Grades
The following table summarizes recent institutional grades for Fair Isaac Corporation:
| Grading Company | Action | New Grade | Date |
|---|---|---|---|
| Needham | Maintain | Buy | 2026-01-29 |
| Jefferies | Maintain | Buy | 2026-01-16 |
| Wells Fargo | Maintain | Overweight | 2026-01-14 |
| JP Morgan | Maintain | Neutral | 2025-11-06 |
| Baird | Maintain | Outperform | 2025-11-06 |
| Jefferies | Maintain | Buy | 2025-11-06 |
| BMO Capital | Maintain | Outperform | 2025-11-06 |
| Wells Fargo | Maintain | Overweight | 2025-10-14 |
| Barclays | Maintain | Overweight | 2025-10-02 |
| Needham | Maintain | Buy | 2025-10-02 |
Which company has the best grades?
Fair Isaac Corporation consistently receives “Buy” and “Overweight” ratings, reflecting strong institutional confidence. Intuit’s ratings cluster around “Outperform” and “Overweight” but include a recent downgrade to “Equal Weight,” signaling a more cautious outlook. Investors might interpret FICO’s stronger consensus grades as indicative of higher near-term enthusiasm.
Risks specific to each company
The following categories identify the critical pressure points and systemic threats facing both firms in the 2026 market environment:
1. Market & Competition
Intuit Inc.
- Faces intense competition in financial software and tax services but benefits from diversified segments and strong brand loyalty.
Fair Isaac Corporation
- Operates in niche decision analytics and scoring, but limited scale and concentrated customer base increase competitive pressure.
2. Capital Structure & Debt
Intuit Inc.
- Maintains a conservative debt-to-equity ratio of 0.34, with strong interest coverage at 20.57 times, indicating low financial risk.
Fair Isaac Corporation
- Displays a problematic debt-to-assets ratio of 164.6%, with negative debt-to-equity, signaling potential leverage and solvency concerns.
3. Stock Volatility
Intuit Inc.
- Beta of 1.254 shows moderate volatility, in line with tech sector norms, but stock trades in a wide price range ($491.72-813.7).
Fair Isaac Corporation
- Slightly higher beta at 1.293 suggests marginally elevated volatility; trading range is broad ($1300-2217.6), indicating price swings.
4. Regulatory & Legal
Intuit Inc.
- Subject to evolving tax and data privacy regulations affecting its tax preparation and financial services products.
Fair Isaac Corporation
- Faces regulatory scrutiny around data analytics accuracy and compliance, especially in financial crimes and credit scoring domains.
5. Supply Chain & Operations
Intuit Inc.
- Relies on cloud infrastructure and software development teams; operational risks include tech disruptions and talent retention.
Fair Isaac Corporation
- Depends heavily on software platform stability and skilled technical staff; operational continuity is critical for client trust.
6. ESG & Climate Transition
Intuit Inc.
- Increasing pressure to enhance ESG disclosures and reduce carbon footprint amid investor demands for sustainability.
Fair Isaac Corporation
- Faces ESG risks related to data ethics and governance; climate transition impact is indirect but relevant for client industries.
7. Geopolitical Exposure
Intuit Inc.
- Global operations expose it to trade tensions and regulatory shifts, particularly in North America and international markets.
Fair Isaac Corporation
- Geographic concentration in the Americas and EMEA heightens sensitivity to regional political risks and regulatory changes.
Which company shows a better risk-adjusted profile?
Intuit’s most impactful risk is its high valuation multiples that may compress returns amid market volatility. Fair Isaac’s biggest concern is its stretched capital structure, risking liquidity and operational flexibility. Intuit’s conservative leverage and strong liquidity present a superior risk-adjusted profile, despite valuation risks. Fair Isaac’s negative debt metrics and weaker liquidity metrics warrant caution. Recent data show Intuit’s interest coverage ratio at a robust 20.57 versus Fair Isaac’s 7.01, underscoring Intuit’s stronger buffer against interest expense shocks.
Final Verdict: Which stock to choose?
Intuit Inc. wields a superpower in operational efficiency and consistent value creation, sustaining strong returns on invested capital despite a slight decline in profitability. Its solid financial health suits investors willing to embrace moderate risk for steady growth in a competitive software landscape. The main point of vigilance lies in its elevated valuation multiples, which could temper near-term upside.
Fair Isaac Corporation’s strategic moat centers on a durable competitive advantage with rapidly growing profitability and exceptional ROIC far exceeding its cost of capital. Although it carries more debt and liquidity risks than Intuit, its dominant position in the credit scoring niche offers a compelling growth trajectory. This profile better fits investors seeking aggressive growth tempered by a tolerance for financial leverage.
If you prioritize operational resilience and stable cash flow, Intuit is the compelling choice due to its robust balance sheet and steady value creation. However, if you seek high-growth potential with expanding profitability, Fair Isaac outshines through its durable competitive advantage and accelerating returns. Both present analytical scenarios favoring distinct investor profiles, underscoring the need to align choice with your strategic priorities.
Disclaimer: Investment carries a risk of loss of initial capital. The past performance is not a reliable indicator of future results. Be sure to understand risks before making an investment decision.
Go Further
I encourage you to read the complete analyses of Intuit Inc. and Fair Isaac Corporation to enhance your investment decisions: