Home > Comparison > Technology > FICO vs FIG
The strategic rivalry between Fair Isaac Corporation and Figma, Inc. defines the current trajectory of the technology sector. Fair Isaac, a mature software application leader, delivers data-driven decision management and scoring solutions. In contrast, Figma advances collaborative, browser-based design tools targeting dynamic product development teams. This head-to-head contrasts legacy scale with innovative agility. This analysis will determine which corporate path offers superior risk-adjusted returns for diversified portfolios in a rapidly evolving digital economy.
Table of contents
Companies Overview
Fair Isaac Corporation and Figma, Inc. represent pivotal forces in software applications shaping business and design workflows.
Fair Isaac Corporation: Data-Driven Decision Software Leader
Fair Isaac Corporation thrives as a provider of analytic and decision management software. Its core revenue stems from scoring solutions and modular software that automate critical business decisions like fraud detection and customer engagement. In 2026, it emphasizes expanding its software segment to integrate advanced analytics across diverse industries globally.
Figma, Inc.: Collaborative Design Innovation Catalyst
Figma, Inc. operates as a browser-based design platform enabling teams to build user interfaces collaboratively. Revenues come from subscription access to tools for prototyping, design systems, and AI-assisted product development. Its 2026 strategy focuses on enhancing collaborative features and AI integration to streamline creative workflows.
Strategic Collision: Similarities & Divergences
Both companies lead in software but differ in focus: Fair Isaac excels in data-driven decision automation, while Figma pioneers collaborative design innovation. Their primary battleground is enterprise software adoption—decision analytics versus creative productivity. These distinct profiles offer divergent investment characteristics: Fair Isaac with steady, analytic-driven revenue; Figma with growth fueled by innovation and platform expansion.
Income Statement Comparison
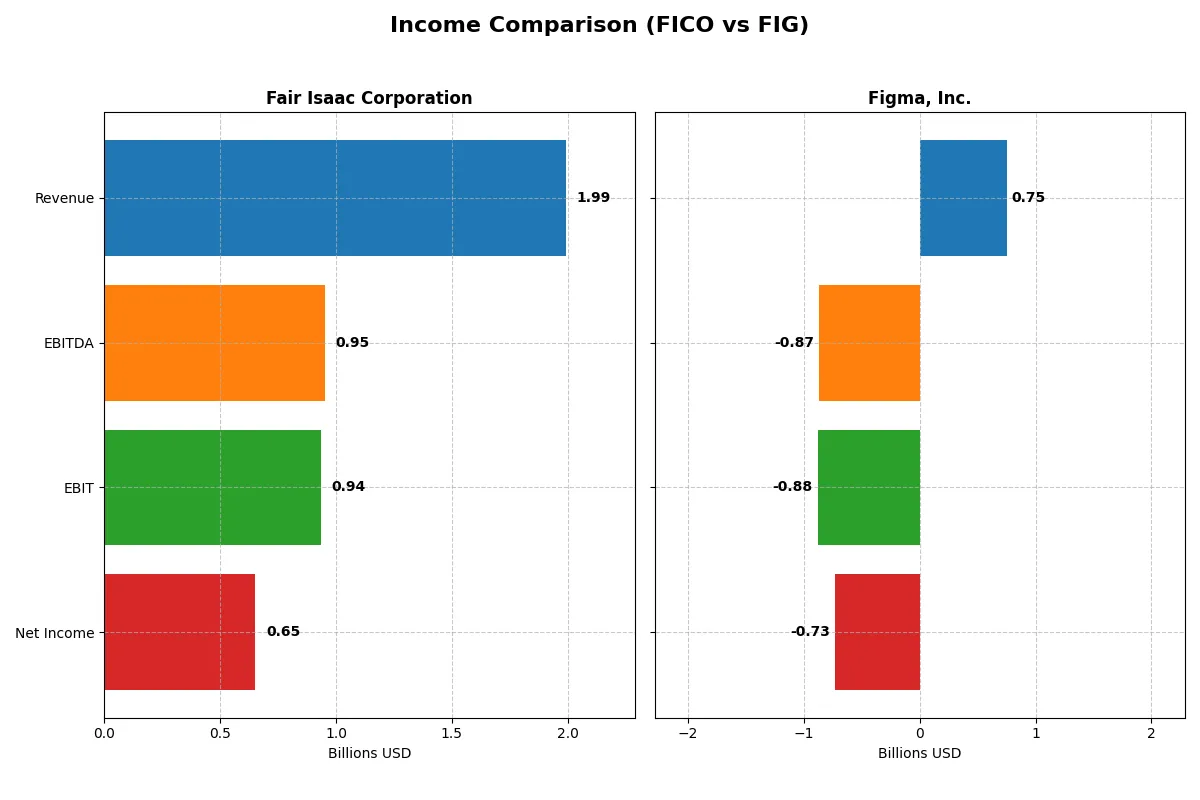
This data dissects the core profitability and scalability of both corporate engines to reveal who dominates the bottom line:
| Metric | Fair Isaac Corporation (FICO) | Figma, Inc. (FIG) |
|---|---|---|
| Revenue | 1.99B | 749M |
| Cost of Revenue | 354M | 88M |
| Operating Expenses | 712M | 1.54B |
| Gross Profit | 1.64B | 661M |
| EBITDA | 951M | -870M |
| EBIT | 936M | -877M |
| Interest Expense | 134M | 0 |
| Net Income | 652M | -732M |
| EPS | 26.9 | -3.11 |
| Fiscal Year | 2025 | 2024 |
Income Statement Analysis: The Bottom-Line Duel
This income statement comparison reveals which company operates with greater financial efficiency and profit sustainability.
Fair Isaac Corporation Analysis
Fair Isaac’s revenue surged from 1.32B in 2021 to nearly 2B in 2025, with net income rising from 392M to 652M. Gross margin remains robust above 82%, and net margin steadily improves to an impressive 32.75% in 2025. The company shows strong momentum, with a 15.9% revenue growth and 29.8% EPS growth in the latest year, signaling operational excellence.
Figma, Inc. Analysis
Figma’s revenue grew sharply from 505M in 2023 to 749M in 2024, a 48.4% jump. Despite a high gross margin of 88.3%, the company posts steep operating losses with an EBIT margin of -117%, reflecting heavy R&D and SG&A spending. Net income declined dramatically to a -732M loss in 2024, indicating a business still investing aggressively but not yet profitable.
Margin Power vs. Growth Strain
Fair Isaac clearly dominates with sustainable profitability and consistent margin expansion. Figma impresses with rapid revenue growth but suffers from large operating losses, undermining net income. Investors seeking stability and strong cash generation will find Fair Isaac’s profile more attractive, while Figma’s current losses suggest higher risk and longer runway for profitability.
Financial Ratios Comparison
These vital ratios act as a diagnostic tool to expose the underlying fiscal health, valuation premiums, and capital efficiency of the companies compared below:
| Ratios | Fair Isaac Corporation (FICO) | Figma, Inc. (FIG) |
|---|---|---|
| ROE | -37.3% | 27.4% |
| ROIC | 53.0% | -5.4% |
| P/E | 55.6 | -70.7 |
| P/B | -20.8 | 39.1 |
| Current Ratio | 0.83 | 3.66 |
| Quick Ratio | 0.83 | 3.66 |
| D/E | -1.76 | 0.02 |
| Debt-to-Assets | 164.6% | 1.6% |
| Interest Coverage | 6.92 | 0 |
| Asset Turnover | 1.07 | 0.42 |
| Fixed Asset Turnover | 21.20 | 17.09 |
| Payout ratio | 0 | 0 |
| Dividend yield | 0 | 0 |
| Fiscal Year | 2025 | 2024 |
Efficiency & Valuation Duel: The Vital Signs
Ratios form the company’s financial DNA, unveiling hidden risks and operational strengths crucial for investment decisions.
Fair Isaac Corporation
Fair Isaac shows strong operational efficiency with a high net margin of 32.75% and a robust ROIC of 52.96%. However, its ROE is deeply negative at -37.34%, signaling shareholder equity challenges. The stock trades at a steep P/E of 55.64, reflecting stretched valuation. Fair Isaac reinvests heavily in R&D rather than paying dividends, targeting growth.
Figma, Inc.
Figma posts deeply negative profitability metrics: net margin at -97.74% and ROIC at -59.68%, indicating operational losses. The P/E ratio is negative but paired with a high price-to-book of 39.1, suggesting an expensive valuation relative to assets. Figma holds a strong current ratio of 3.66, prioritizing liquidity, and invests aggressively in R&D without dividends, focusing on expansion.
Premium Valuation vs. Operational Safety
Fair Isaac balances high operational returns with stretched valuation but faces equity returns headwinds. Figma displays weaker profitability and higher risk despite strong liquidity. Investors seeking operational safety might prefer Fair Isaac, while those favoring growth and liquidity may lean toward Figma’s profile.
Which one offers the Superior Shareholder Reward?
Fair Isaac Corporation (FICO) and Figma, Inc. (FIG) both avoid dividends, focusing on reinvestment and buybacks. FICO delivers robust free cash flow (31.8/share in 2025) and a strong buyback capacity, while FIG burns cash (-0.15/share) with no buybacks. I see FICO’s model as more sustainable, offering superior long-term shareholder reward.
Comparative Score Analysis: The Strategic Profile
The radar chart reveals the fundamental DNA and trade-offs of Fair Isaac Corporation and Figma, Inc., exposing their distinct strengths and vulnerabilities:
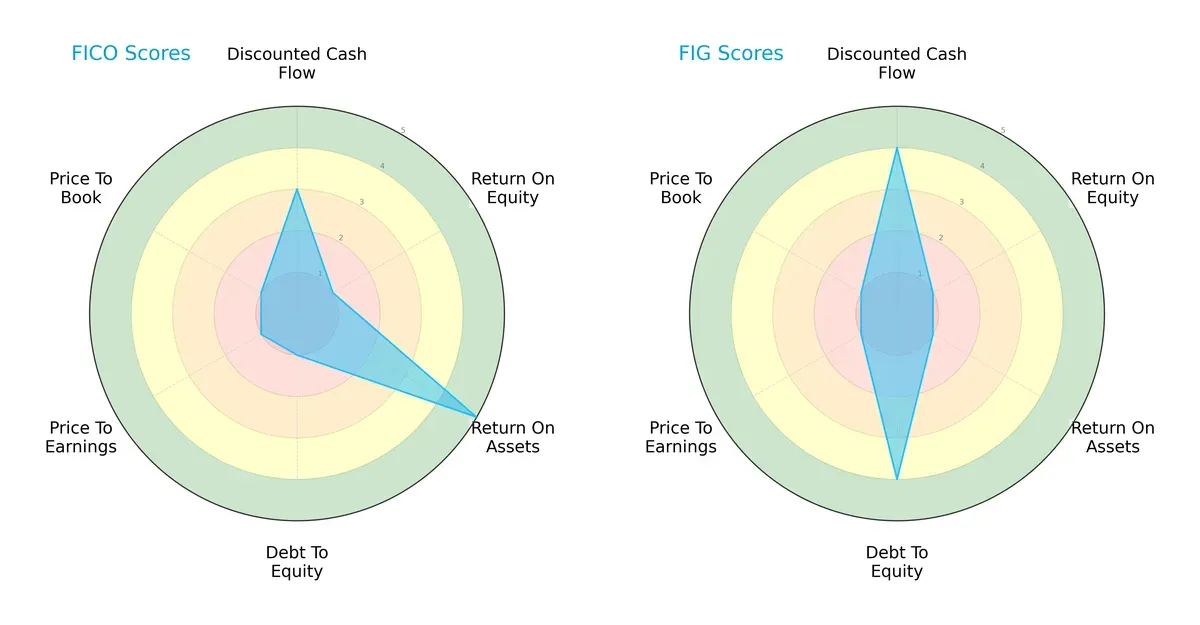
Fair Isaac Corporation (FICO) boasts a superior ROA score (5) reflecting efficient asset use, but suffers from weak ROE, high debt, and poor valuation metrics. Figma (FIG) excels in discounted cash flow (4) and maintains a stronger debt-to-equity position (4), signaling financial prudence. However, FIG’s low ROA and ROE scores highlight operational challenges. Overall, FICO presents a more asset-efficient profile, while FIG relies more on financial stability, making FICO’s profile less balanced but more operationally focused.
—
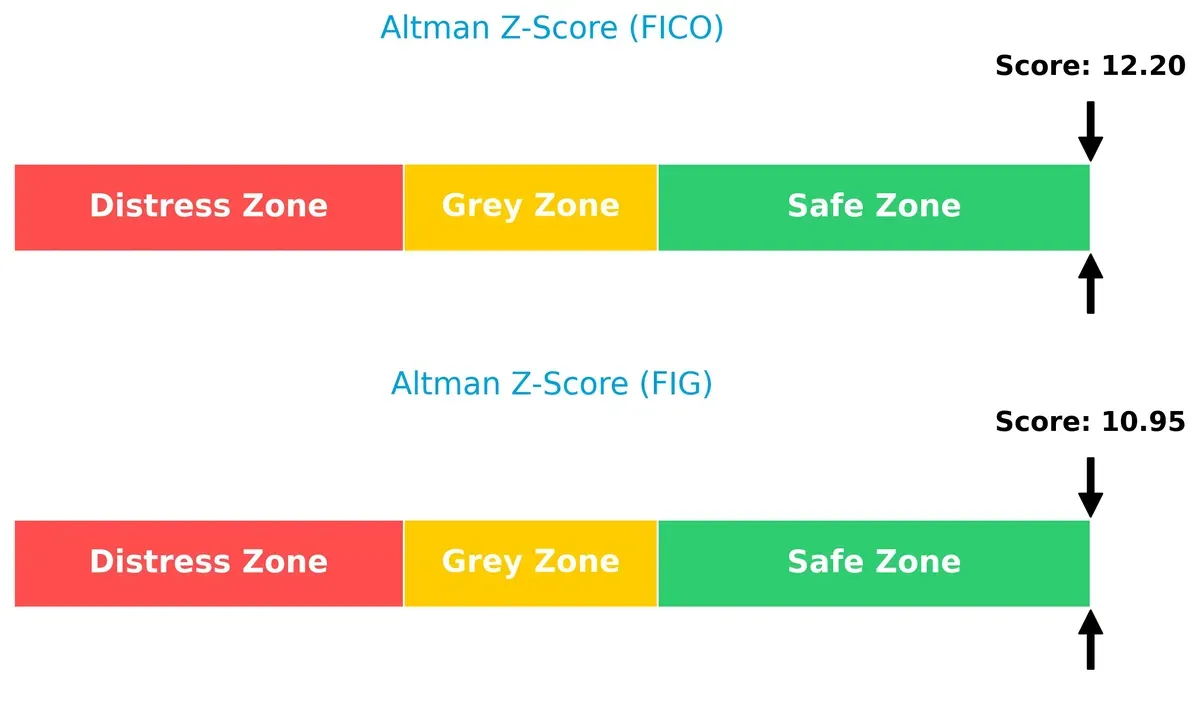
Bankruptcy Risk: Solvency Showdown
Fair Isaac’s Altman Z-Score of 12.2 versus Figma’s 10.9 places both firmly in the safe zone, signaling robust solvency and minimal bankruptcy risk in this cycle:
—
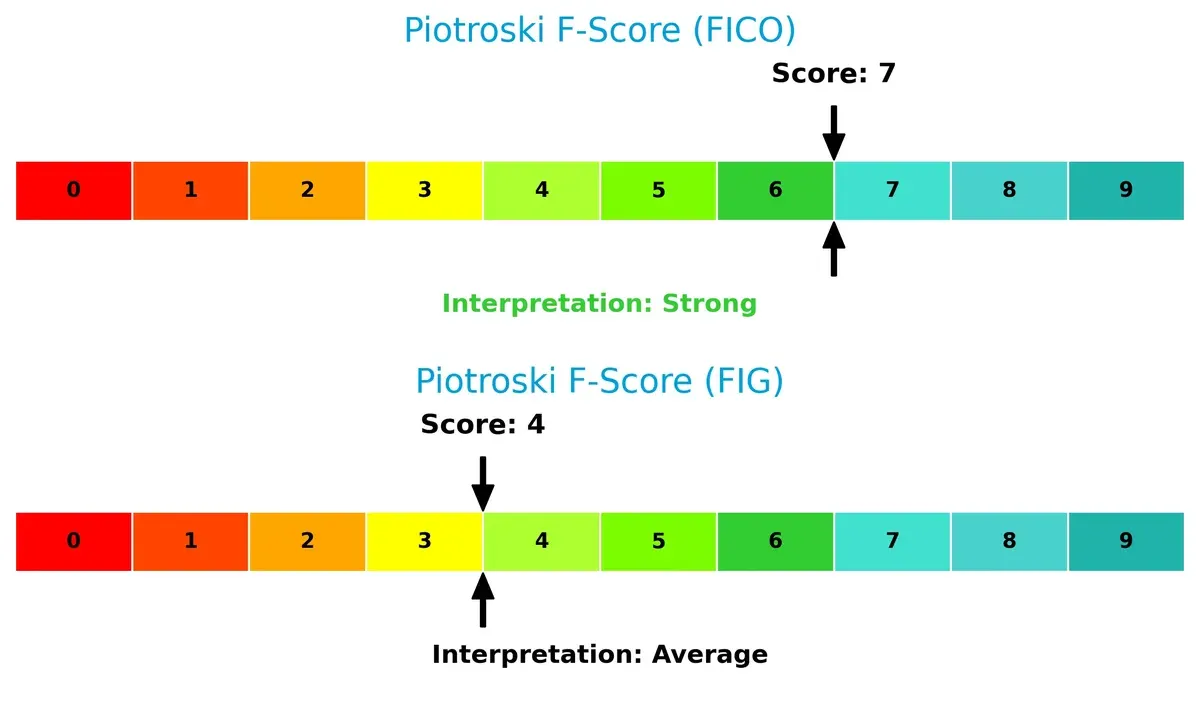
Financial Health: Quality of Operations
Fair Isaac’s Piotroski F-Score of 7 indicates strong financial health, outperforming Figma’s middling score of 4, which suggests caution on internal financial metrics:
How are the two companies positioned?
This section dissects the operational DNA of FICO and FIG by comparing their revenue distribution and internal strengths and weaknesses. The ultimate goal is to confront their economic moats and determine which model offers the most resilient competitive advantage in today’s market.
Revenue Segmentation: The Strategic Mix
This visual comparison dissects how Fair Isaac Corporation and Figma, Inc. diversify their income streams and where their primary sector bets lie:
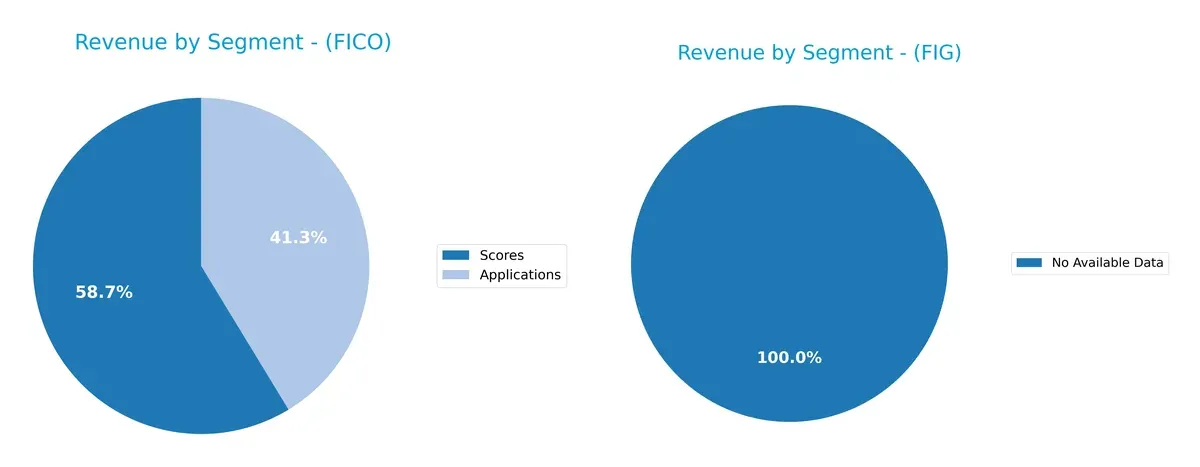
Fair Isaac Corporation pivots on two main segments: Scores at $1.17B and Applications at $822M in 2025. This showcases a balanced diversification within its analytical software ecosystem. Figma, Inc. lacks available data, preventing segmentation evaluation. FICO’s dual-segment reliance reduces concentration risk and anchors its infrastructure dominance in credit scoring and applications analytics, a strategic moat in fintech.
Strengths and Weaknesses Comparison
This table compares the Strengths and Weaknesses of Fair Isaac Corporation (FICO) and Figma, Inc. (FIG):
FICO Strengths
- Strong profitability with 32.75% net margin
- High ROIC at 52.96% above WACC
- Favorable asset and fixed asset turnover
- Low debt-to-equity ratio
- Diversified revenue from Software and Scores segments
- Established global presence with strong Americas sales
FIG Strengths
- Favorable WACC at 4.73% indicating low capital cost
- Low debt-to-assets ratio at 1.6%
- Favorable quick ratio at 3.66 signaling liquidity
- Positive fixed asset turnover of 17.09
FICO Weaknesses
- Negative ROE at -37.34% indicates weak shareholder returns
- High debt-to-assets at 164.6% is a red flag
- Current ratio below 1 at 0.83 suggests liquidity constraints
- High P/E at 55.64 signals expensive valuation
- No dividend yield
FIG Weaknesses
- Negative profitability metrics including -97.74% net margin and -59.68% ROIC
- Negative P/E ratio implies losses
- Current ratio at 3.66 marked unfavorable likely due to asset structure
- Zero interest coverage ratio raises solvency concerns
- No dividend yield
- Low asset turnover at 0.42
FICO’s strengths lie in robust profitability and efficient asset use, but high leverage and liquidity warrant caution. FIG shows liquidity and capital cost advantages but suffers from deep losses and solvency risks, challenging its financial stability.
The Moat Duel: Analyzing Competitive Defensibility
A structural moat is the only reliable shield protecting long-term profits from relentless competitive erosion. Here’s how two software firms stack up:
Fair Isaac Corporation: Data-Driven Switching Costs
Fair Isaac’s moat stems from entrenched switching costs embedded in its credit scoring and decision analytics. It sustains a very favorable ROIC 44% above WACC, with margin stability and 15%+ revenue growth. Expansion into AI-driven decision platforms in 2026 should deepen this advantage.
Figma, Inc.: Emerging Network Effects
Figma leverages collaborative design software to build network effects, contrasting Fair Isaac’s data moat. Despite 48% revenue growth, sharply negative EBIT and declining ROIC highlight a fragile moat. Scaling collaborative features and AI integration could unlock future value if profitability improves.
The Verdict: Switching Costs vs. Network Effects in Software
Fair Isaac’s durable switching-cost moat beats Figma’s nascent network effects, given consistent value creation and growing returns. Fair Isaac is better positioned to defend its market share amid intensifying competition in 2026.
Which stock offers better returns?
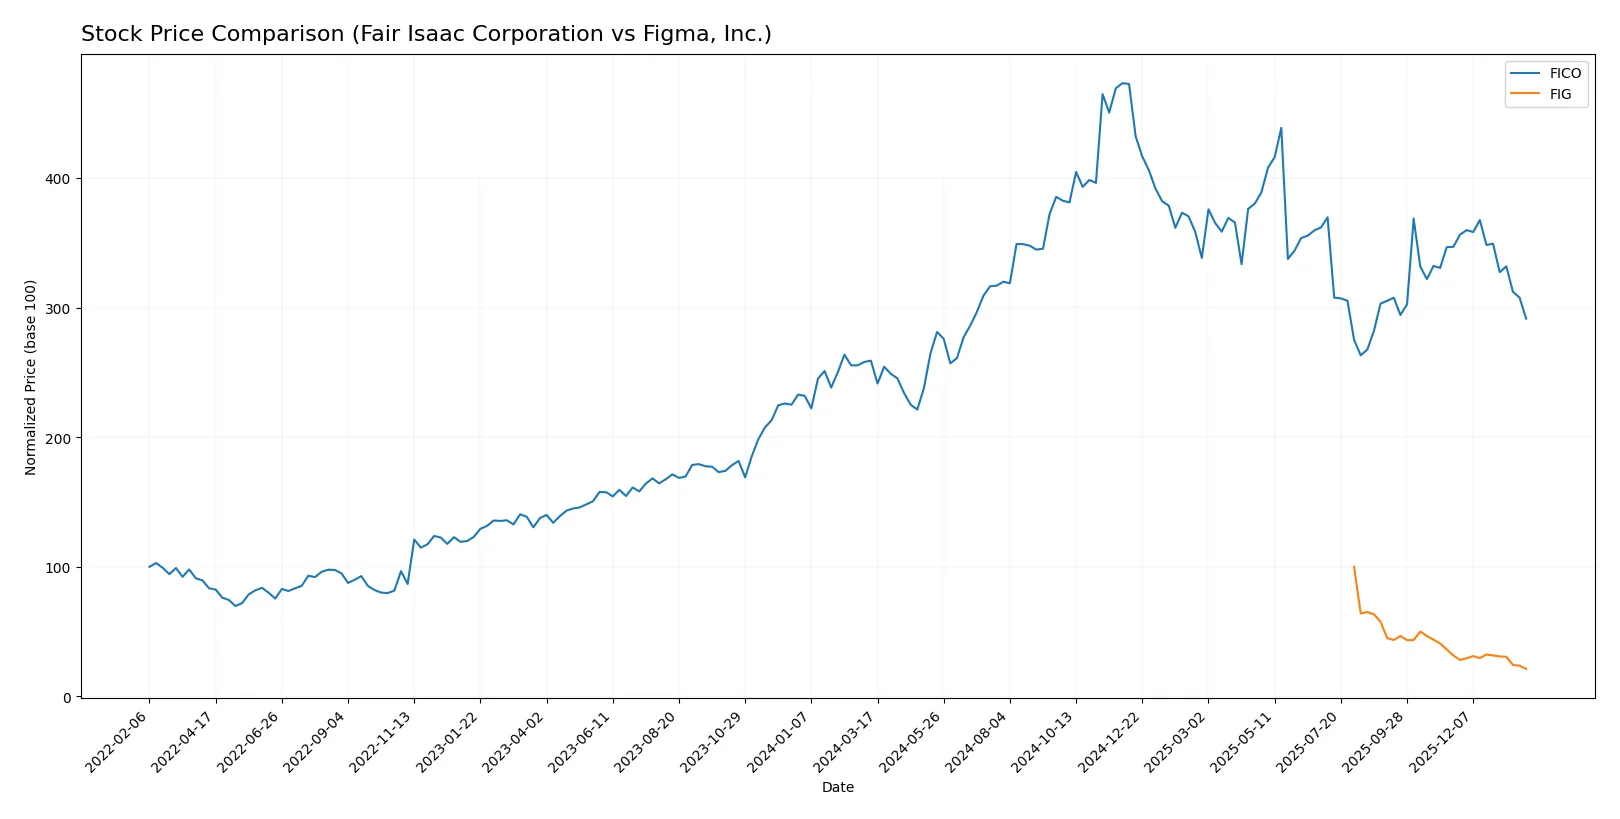
The past year shows starkly different trajectories: Fair Isaac Corporation’s stock gained 12.5% overall with recent deceleration, while Figma, Inc. plunged 78.7%, accelerating its decline amid heavy seller dominance.
Trend Comparison
Fair Isaac Corporation’s stock rose 12.5% over the past 12 months, confirming a bullish trend with decelerating momentum. It hit a high of 2375.03 and a low of 1110.85, showing solid volatility at 285.65.
Figma, Inc. suffered a 78.7% drop over the past 12 months, marking a bearish trend with accelerating losses. The stock fell from highs of 122.0 to lows near 25.92, reflecting low volatility at 20.35.
Fair Isaac Corporation outperformed Figma, Inc. by a wide margin, delivering positive returns versus a sharp decline for Figma over the one-year period.
Target Prices
Analysts present a mixed but generally optimistic consensus on target prices for Fair Isaac Corporation and Figma, Inc.
| Company | Target Low | Target High | Consensus |
|---|---|---|---|
| Fair Isaac Corporation | 1,640 | 2,400 | 2,115 |
| Figma, Inc. | 38 | 52 | 43.6 |
The consensus targets for Fair Isaac Corporation exceed its current price by about 45%, signaling strong upside potential. Figma’s target consensus more than doubles its current trading price, reflecting high growth expectations despite recent volatility.

Don’t Let Luck Decide Your Entry Point
Optimize your entry points with our advanced ProRealTime indicators. You’ll get efficient buy signals with precise price targets for maximum performance. Start outperforming now!
How do institutions grade them?
Here is a summary of recent institutional grades for Fair Isaac Corporation and Figma, Inc.:
Fair Isaac Corporation Grades
The table below shows recent grades from established grading firms for Fair Isaac Corporation.
| Grading Company | Action | New Grade | Date |
|---|---|---|---|
| Needham | Maintain | Buy | 2026-01-29 |
| Jefferies | Maintain | Buy | 2026-01-16 |
| Wells Fargo | Maintain | Overweight | 2026-01-14 |
| JP Morgan | Maintain | Neutral | 2025-11-06 |
| Baird | Maintain | Outperform | 2025-11-06 |
| Jefferies | Maintain | Buy | 2025-11-06 |
| BMO Capital | Maintain | Outperform | 2025-11-06 |
| Wells Fargo | Maintain | Overweight | 2025-10-14 |
| Barclays | Maintain | Overweight | 2025-10-02 |
| Needham | Maintain | Buy | 2025-10-02 |
Figma, Inc. Grades
The table below presents recent grades from recognized grading companies for Figma, Inc.
| Grading Company | Action | New Grade | Date |
|---|---|---|---|
| Morgan Stanley | Maintain | Equal Weight | 2026-01-15 |
| Wells Fargo | Upgrade | Overweight | 2026-01-08 |
| RBC Capital | Maintain | Sector Perform | 2026-01-05 |
| Goldman Sachs | Maintain | Neutral | 2025-11-07 |
| JP Morgan | Maintain | Neutral | 2025-11-06 |
| Piper Sandler | Maintain | Overweight | 2025-11-06 |
| Wells Fargo | Maintain | Equal Weight | 2025-11-05 |
| Wells Fargo | Maintain | Equal Weight | 2025-09-04 |
| Morgan Stanley | Maintain | Equal Weight | 2025-09-04 |
| RBC Capital | Maintain | Sector Perform | 2025-09-04 |
Which company has the best grades?
Fair Isaac Corporation consistently receives stronger grades, including multiple Buy and Outperform ratings. Figma, Inc. mostly earns Neutral, Equal Weight, or Sector Perform grades, with a recent upgrade to Overweight from Wells Fargo. This suggests Fair Isaac may currently enjoy higher institutional confidence, potentially influencing investor perception and stock momentum.
Risks specific to each company
The following categories identify the critical pressure points and systemic threats facing both firms in the 2026 market environment:
1. Market & Competition
Fair Isaac Corporation
- Established analytics leader with strong market presence but faces pressure from evolving AI-driven competitors.
Figma, Inc.
- Rapid growth in collaborative design tools but struggles with profitability and intense competition from larger incumbents.
2. Capital Structure & Debt
Fair Isaac Corporation
- High debt-to-assets ratio (165%) signals aggressive leverage, raising financial risk despite strong interest coverage.
Figma, Inc.
- Very low debt-to-assets (1.6%) reflects conservative capital structure but zero interest coverage hints at weak earnings support.
3. Stock Volatility
Fair Isaac Corporation
- Beta of 1.29 indicates moderate market sensitivity, typical for established tech firms.
Figma, Inc.
- Negative beta (-3.58) signals extreme volatility, exposing investors to high market risk and potential price swings.
4. Regulatory & Legal
Fair Isaac Corporation
- Operates globally with exposure to data privacy and financial compliance regulations, requiring ongoing adaptation.
Figma, Inc.
- Faces regulatory scrutiny around user data and intellectual property in browser-based design platforms.
5. Supply Chain & Operations
Fair Isaac Corporation
- Relies on software delivery and data management infrastructure, which demands high uptime and security controls.
Figma, Inc.
- Dependent on cloud infrastructure and internet stability, making operational continuity vulnerable to external tech disruptions.
6. ESG & Climate Transition
Fair Isaac Corporation
- Moderate ESG risks due to data center energy use; strong governance can mitigate climate transition costs.
Figma, Inc.
- Faces pressure to improve sustainability practices as a younger firm with growing environmental scrutiny.
7. Geopolitical Exposure
Fair Isaac Corporation
- Global operations expose it to geopolitical tensions, especially in emerging markets with regulatory unpredictability.
Figma, Inc.
- Primarily US-focused but expansion plans increase exposure to geopolitical risks affecting cloud service providers.
Which company shows a better risk-adjusted profile?
Fair Isaac’s most impactful risk is its heavy leverage and high debt-to-assets ratio, which heightens financial vulnerability despite strong operational metrics. Figma’s dominant risk lies in extreme stock volatility and negative profitability, signaling unstable market confidence. Overall, Fair Isaac presents a better risk-adjusted profile, supported by its safe-zone Altman Z-Score (12.2) and stronger Piotroski Score (7), while Figma’s scores reflect higher financial fragility and operational risks. The stark contrast in debt levels and beta underscores my concern about Figma’s current market instability compared to Fair Isaac’s balanced but leveraged position.
Final Verdict: Which stock to choose?
Fair Isaac Corporation (FICO) stands out as a cash-generating powerhouse with a durable competitive advantage. Its strong ROIC well above WACC signals consistent value creation. The point of vigilance lies in its tight liquidity position, which could pressure short-term flexibility. FICO suits portfolios targeting aggressive growth with disciplined capital efficiency.
Figma, Inc. (FIG) boasts a strategic moat in its innovative design platform and robust market presence. Its high current ratio suggests strong liquidity, offering relative safety compared to FICO’s tighter balance sheet. However, ongoing value destruction and negative profitability highlight significant execution risks. FIG fits investors seeking GARP with a tolerance for volatility and turnaround potential.
If you prioritize sustainable value creation and operational resilience, FICO is the compelling choice due to its proven profitability and economic moat. However, if you seek exposure to high-growth innovation with better liquidity safety, FIG offers superior upside potential despite current financial headwinds. Both scenarios require careful risk management aligned with investor risk appetite.
Disclaimer: Investment carries a risk of loss of initial capital. The past performance is not a reliable indicator of future results. Be sure to understand risks before making an investment decision.
Go Further
I encourage you to read the complete analyses of Fair Isaac Corporation and Figma, Inc. to enhance your investment decisions: