In the competitive world of financial data and analytics, S&P Global Inc. and FactSet Research Systems Inc. stand out as key players. Both companies provide critical market intelligence and workflow solutions to investors and financial professionals worldwide. While S&P Global boasts a broad, diversified portfolio, FactSet focuses on integrated financial information and analytical tools. This article will help you determine which company offers the most compelling investment opportunity in 2026.
Table of contents
Companies Overview
I will begin the comparison between S&P Global and FactSet Research Systems by providing an overview of these two companies and their main differences.
S&P Global Overview
S&P Global Inc. provides credit ratings, benchmarks, analytics, and workflow solutions across global capital, commodity, and automotive markets. Operating through six divisions, it offers a broad range of financial data and insights, including credit ratings, indices, and market intelligence. Founded in 1860 and headquartered in New York City, S&P Global serves a diverse set of market participants with comprehensive data and analytical services.
FactSet Research Systems Overview
FactSet Research Systems Inc. delivers integrated financial information and analytical applications focused on research, analytics, trading, and wealth management. It serves portfolio managers, investment banks, and asset managers worldwide. Established in 1978 and based in Norwalk, Connecticut, FactSet emphasizes workflow solutions that combine content and technology to support the investment community across multiple regions.
Key similarities and differences
Both companies operate in the financial data and analytics sector, providing services that support investment decision-making. S&P Global is larger with a $164B market cap and more diversified divisions, while FactSet has a market cap of $11B and focuses primarily on integrated workflow solutions. S&P Global’s offerings include credit ratings and indices, whereas FactSet concentrates on financial analytics and content delivery for portfolio and wealth managers.
Income Statement Comparison
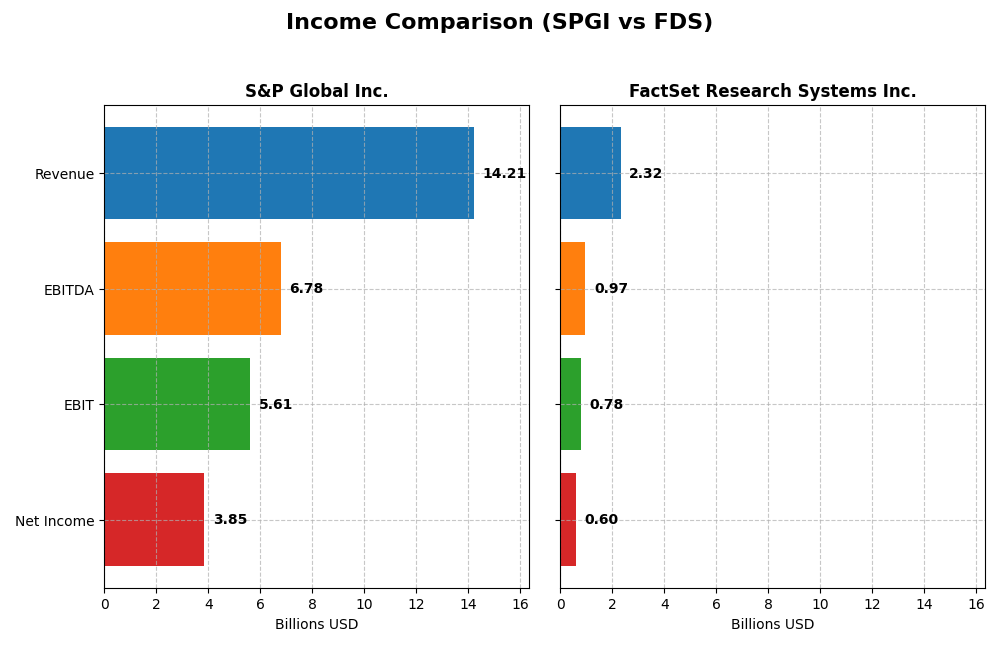
The table below compares key income statement metrics for S&P Global Inc. and FactSet Research Systems Inc. for their most recent fiscal years, highlighting revenue, profitability, and earnings per share.
| Metric | S&P Global Inc. (2024) | FactSet Research Systems Inc. (2025) |
|---|---|---|
| Market Cap | 164B | 11.2B |
| Revenue | 14.2B | 2.32B |
| EBITDA | 6.78B | 966M |
| EBIT | 5.61B | 777M |
| Net Income | 3.85B | 597M |
| EPS | 12.36 | 15.74 |
| Fiscal Year | 2024 | 2025 |
Income Statement Interpretations
S&P Global Inc.
S&P Global has shown strong revenue growth from $7.44B in 2020 to $14.21B in 2024, with net income rising from $2.34B to $3.85B. Margins remain robust, with a gross margin around 69% and net margin above 27%. In 2024, revenue growth accelerated to 13.7%, accompanied by a 29% net margin increase, highlighting improved profitability.
FactSet Research Systems Inc.
FactSet’s revenue increased from $1.59B in 2021 to $2.32B in 2025, with net income growing from $400M to $597M. Margins are solid, with a gross margin near 53% and net margin about 26%. The 2025 fiscal year saw moderate revenue growth of 5.4%, while net margin and EPS growth were favorable, indicating steady operational efficiency.
Which one has the stronger fundamentals?
S&P Global displays stronger fundamentals with higher revenue and net income growth rates and superior margins, supported by a consistent expansion in profitability metrics. FactSet shows stable growth but at a slower pace and with slightly lower margins. Both companies have favorable income statement evaluations, yet S&P Global’s scale and margin advantages suggest more robust earnings power.
Financial Ratios Comparison
The table below compares key financial ratios for S&P Global Inc. (SPGI) and FactSet Research Systems Inc. (FDS) based on the most recent full fiscal year data available.
| Ratios | S&P Global Inc. (2024) | FactSet Research Systems Inc. (2025) |
|---|---|---|
| ROE | 11.6% | 27.3% |
| ROIC | 8.1% | 16.1% |
| P/E | 40.3 | 23.7 |
| P/B | 4.68 | 6.48 |
| Current Ratio | 0.85 | 1.40 |
| Quick Ratio | 0.85 | 1.40 |
| D/E (Debt to Equity) | 0.36 | 0.71 |
| Debt-to-Assets | 19.8% | 36.2% |
| Interest Coverage | 18.8 | 13.3 |
| Asset Turnover | 0.24 | 0.54 |
| Fixed Asset Turnover | 20.96 | 11.22 |
| Payout Ratio | 29.4% | 26.8% |
| Dividend Yield | 0.73% | 1.13% |
Interpretation of the Ratios
S&P Global Inc.
S&P Global Inc. presents a mixed ratio profile with strengths in net margin (27.11%, favorable) and debt management (debt-to-equity at 0.36 and debt-to-assets at 19.82%, both favorable). However, concerns arise from its high PE ratio (40.29, unfavorable) and low current ratio (0.85, unfavorable), indicating potential liquidity risks. The company pays dividends, but with a low yield of 0.73% and payout coverage by free cash flow appearing strained, sustainability should be monitored.
FactSet Research Systems Inc.
FactSet exhibits generally strong financial ratios, including a favorable net margin (25.72%), return on equity (27.31%), and return on invested capital (16.1%). Liquidity ratios are adequate, with a current ratio of 1.4 and quick ratio also favorable at 1.4. The PE ratio is moderate (23.71, neutral), though the price-to-book ratio is unfavorable at 6.48. FactSet pays dividends with a 1.13% yield, supported by solid cash flow, reflecting a stable shareholder return profile.
Which one has the best ratios?
FactSet Research Systems Inc. demonstrates a more favorable overall ratio profile with half of its metrics rated favorable and fewer unfavorable indicators compared to S&P Global. S&P Global’s higher leverage efficiency contrasts with its liquidity and valuation concerns. FactSet’s stronger profitability ratios and healthier liquidity suggest it holds a slightly stronger financial position in this comparison.
Strategic Positioning
This section compares the strategic positioning of S&P Global Inc. and FactSet Research Systems Inc., including market position, key segments, and exposure to technological disruption:
S&P Global Inc.
- Leading global player with significant market cap; faces competitive pressure in financial data services.
- Diversified segments including ratings, indices, market intelligence, commodity insights, mobility, and engineering solutions.
- Operates in established financial data markets; no explicit mention of technological disruption exposure.
FactSet Research Systems Inc.
- Smaller market cap with focused presence; operates in competitive financial data and analytics sector.
- Concentrated on integrated financial information and analytical applications for investment professionals.
- Provides workflow solutions across multiple regions; no direct information on technological disruption risk.
S&P Global Inc. vs FactSet Research Systems Inc. Positioning
S&P Global shows a diversified strategic approach across multiple financial market segments, offering broad data and analytics services. FactSet focuses on integrated financial information and analytics, indicating a more concentrated business model with narrower segment exposure.
Which has the best competitive advantage?
FactSet displays a slightly favorable moat with value creation despite declining profitability. S&P Global has a very unfavorable moat due to value destruction and declining returns, indicating FactSet currently holds a stronger competitive advantage.
Stock Comparison
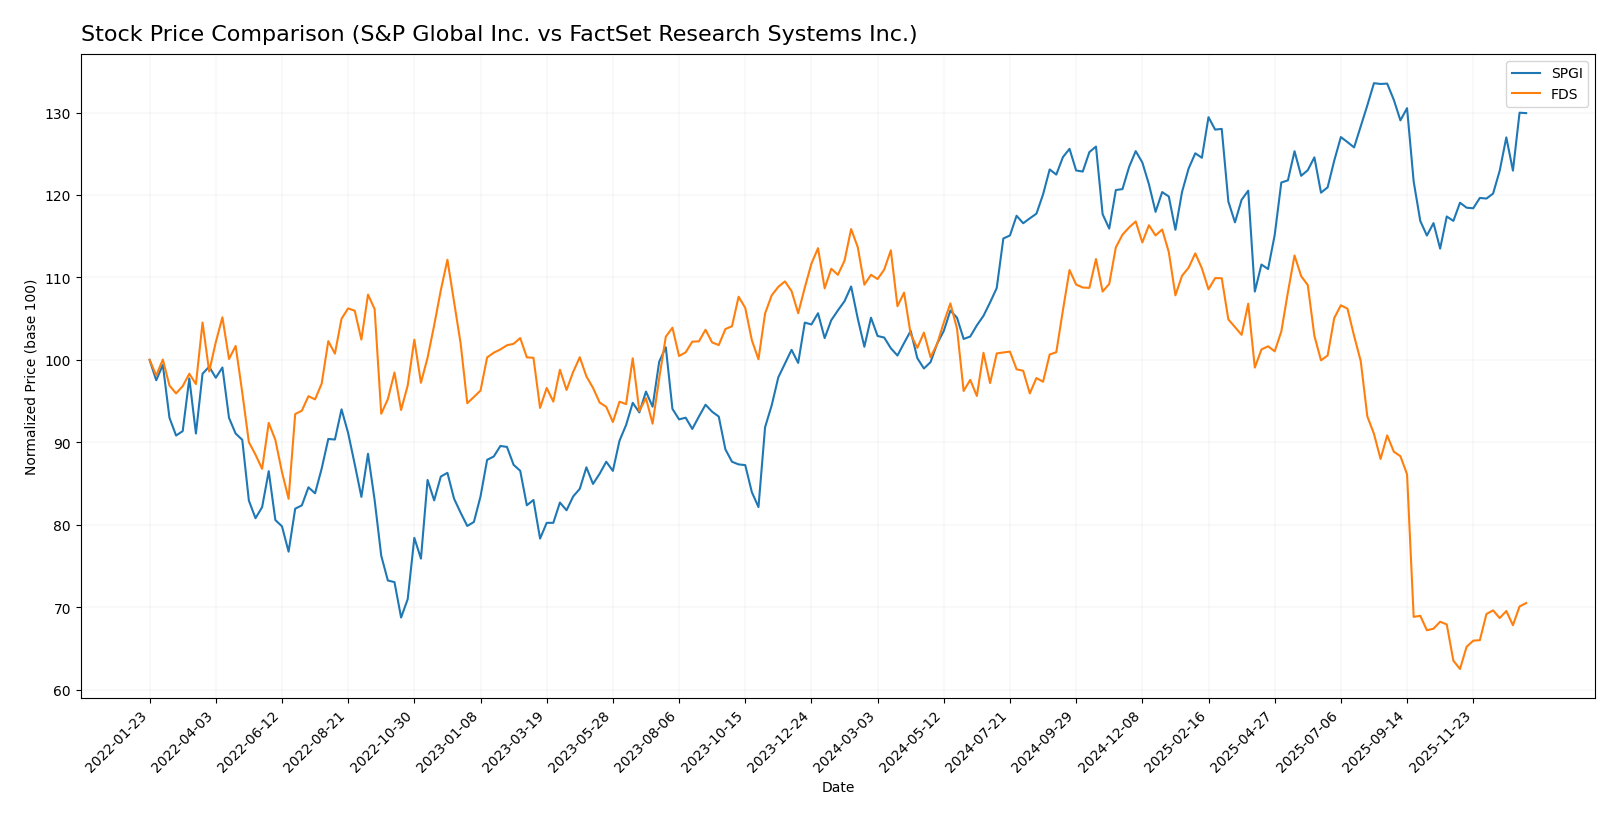
The stock price chart highlights significant movements and trading dynamics over the past 12 months, with S&P Global Inc. showing a strong bullish trend and FactSet Research Systems Inc. experiencing a marked bearish trajectory.
Trend Analysis
S&P Global Inc. recorded a 23.6% price increase over the past year, indicating a bullish trend with accelerating momentum and a price range between 412.56 and 556.87.
FactSet Research Systems Inc. faced a 36.09% decline over the same period, reflecting a bearish trend with acceleration and a wide price fluctuation from 262.6 to 490.67.
Comparing both, S&P Global Inc. delivered the highest market performance, outperforming FactSet Research Systems Inc., which showed a significant loss over the analyzed period.
Target Prices
Analysts present a clear consensus on target prices for S&P Global Inc. and FactSet Research Systems Inc.
| Company | Target High | Target Low | Consensus |
|---|---|---|---|
| S&P Global Inc. | 643 | 540 | 603.5 |
| FactSet Research Systems Inc. | 321 | 253 | 296.89 |
The consensus target prices for both companies suggest modest upside potential compared to current prices, indicating cautious optimism among analysts for future gains.
Analyst Opinions Comparison
This section compares analysts’ ratings and grades for S&P Global Inc. and FactSet Research Systems Inc.:
Rating Comparison
S&P Global Inc. Rating
- Rating: B+, classified as Very Favorable by analysts.
- Discounted Cash Flow Score: 4, considered Favorable.
- ROE Score: 4, rated Favorable for profitability.
- ROA Score: 5, rated Very Favorable for asset use.
- Debt To Equity Score: 3, indicating Moderate financial risk.
- Overall Score: 3, assessed as Moderate overall standing.
FactSet Research Systems Inc. Rating
- Rating: A-, classified as Very Favorable by analysts.
- Discounted Cash Flow Score: 5, considered Very Favorable.
- ROE Score: 5, rated Very Favorable for profitability.
- ROA Score: 5, rated Very Favorable for asset use.
- Debt To Equity Score: 2, indicating Moderate financial risk.
- Overall Score: 4, assessed as Favorable overall standing.
Which one is the best rated?
FactSet Research Systems Inc. is better rated overall with a higher rating of A- and stronger scores in discounted cash flow, return on equity, and overall financial standing compared to S&P Global Inc., which has a B+ rating and moderate overall score.
Scores Comparison
Here is a comparison of the Altman Z-Score and Piotroski Score for both companies:
SPGI Scores
- Altman Z-Score: 5.60, indicating a safe zone with low bankruptcy risk.
- Piotroski Score: 9, classified as very strong financial health.
FDS Scores
- Altman Z-Score: 5.20, also in the safe zone, signaling low bankruptcy risk.
- Piotroski Score: 6, considered average financial health.
Which company has the best scores?
SPGI has a slightly higher Altman Z-Score and a significantly stronger Piotroski Score compared to FDS. Based strictly on these scores, SPGI demonstrates better financial stability and strength.
Grades Comparison
The following presents a detailed comparison of the grading data from recognized grading companies for both firms:
S&P Global Inc. Grades
This table summarizes recent grades assigned by reputable grading firms to S&P Global Inc.:
| Grading Company | Action | New Grade | Date |
|---|---|---|---|
| Evercore ISI Group | Maintain | Outperform | 2026-01-08 |
| JP Morgan | Maintain | Overweight | 2025-10-31 |
| Stifel | Maintain | Buy | 2025-10-31 |
| Evercore ISI Group | Maintain | Outperform | 2025-10-31 |
| Mizuho | Maintain | Outperform | 2025-10-16 |
| BMO Capital | Maintain | Outperform | 2025-10-16 |
| Evercore ISI Group | Maintain | Outperform | 2025-10-14 |
| Morgan Stanley | Maintain | Overweight | 2025-10-09 |
| Wells Fargo | Maintain | Overweight | 2025-09-19 |
| Citigroup | Maintain | Buy | 2025-09-15 |
Overall, S&P Global Inc. shows a consistent trend of strong buy-side grades, predominantly “Outperform,” “Buy,” and “Overweight” ratings across multiple firms.
FactSet Research Systems Inc. Grades
This table provides the latest grades attributed to FactSet Research Systems Inc. by established grading firms:
| Grading Company | Action | New Grade | Date |
|---|---|---|---|
| Evercore ISI Group | Maintain | In Line | 2026-01-08 |
| BMO Capital | Maintain | Market Perform | 2025-12-22 |
| Goldman Sachs | Maintain | Sell | 2025-12-19 |
| Stifel | Maintain | Hold | 2025-12-19 |
| RBC Capital | Maintain | Sector Perform | 2025-12-19 |
| Morgan Stanley | Upgrade | Equal Weight | 2025-12-17 |
| Wells Fargo | Maintain | Underweight | 2025-12-05 |
| UBS | Upgrade | Buy | 2025-09-22 |
| BMO Capital | Maintain | Market Perform | 2025-09-19 |
| Wells Fargo | Maintain | Underweight | 2025-09-19 |
FactSet’s grades show a mixed to cautious sentiment, with several “Hold,” “Market Perform,” and “Underweight” ratings alongside isolated upgrades to “Buy” and “Equal Weight.”
Which company has the best grades?
S&P Global Inc. holds markedly stronger grades, dominated by “Outperform” and “Buy” ratings, reflecting greater analyst confidence. FactSet Research Systems Inc. exhibits a more cautious consensus with a prevalence of “Hold” and “Market Perform” grades, indicating higher perceived risk or uncertainty. This contrast may influence investor sentiment and portfolio positioning differently.
Strengths and Weaknesses
Below is a comparative overview of key strengths and weaknesses for S&P Global Inc. (SPGI) and FactSet Research Systems Inc. (FDS) based on the most recent financial and operational data.
| Criterion | S&P Global Inc. (SPGI) | FactSet Research Systems Inc. (FDS) |
|---|---|---|
| Diversification | Highly diversified revenue streams across Ratings, Market Intelligence, Indices, Commodity Insights, and Mobility segments; less dependence on any single product line | More concentrated revenue primarily from financial data and analytics, with limited geographic diversification (mainly U.S. and U.K.) |
| Profitability | Net margin 27.11% (favorable), ROIC 8.14% (neutral), but ROIC below WACC indicating value destruction and declining profitability | Net margin 25.72% (favorable), ROIC 16.1% (favorable), ROIC well above WACC indicating value creation, though profitability is declining |
| Innovation | Strong focus on data analytics and indices innovation, with steady revenue growth in emerging segments | Steady innovation in financial analytics tools; however, slower geographic and product diversification |
| Global presence | Significant global footprint with multiple business lines operating worldwide | More limited global presence, with most revenues from North America and UK markets |
| Market Share | Leading market position in financial ratings and indices; sizable market share across segments | Strong niche player in financial data analytics, smaller market share compared to SPGI |
Key takeaways: S&P Global stands out for its diversified business model and global reach but faces challenges with declining profitability and value destruction. FactSet demonstrates robust profitability and value creation despite a narrower product and geographic scope, though its growth potential may be limited by less diversification. Investors should weigh SPGI’s diversification against FDS’s stronger efficiency and profitability metrics.
Risk Analysis
Below is a comparative table outlining key risk factors for S&P Global Inc. (SPGI) and FactSet Research Systems Inc. (FDS) based on the latest available data from 2025-2026.
| Metric | S&P Global Inc. (SPGI) | FactSet Research Systems Inc. (FDS) |
|---|---|---|
| Market Risk | Moderate (Beta 1.21, sensitive to market swings) | Lower (Beta 0.74, less volatile) |
| Debt Level | Low (Debt/Equity 0.36, favorable rating) | Moderate (Debt/Equity 0.71, neutral rating) |
| Regulatory Risk | Medium (financial data and ratings sector scrutiny) | Medium (financial data sector, global compliance) |
| Operational Risk | Medium (diverse divisions, complex operations) | Medium (technology-focused, dependent on data accuracy) |
| Environmental Risk | Low (limited direct environmental impact) | Low (limited direct environmental impact) |
| Geopolitical Risk | Medium (global markets exposure, especially US/EU) | Medium (international presence, currency risks) |
S&P Global faces moderate market risk due to its higher beta and elevated valuation multiples, with regulatory oversight also significant given its role in credit ratings and benchmarks. FactSet is somewhat less volatile but carries moderate debt and operational risks linked to its technology and data reliance. Both companies currently exhibit strong financial health, with S&P Global in a safe zone for bankruptcy risk and FactSet showing average financial strength.
Which Stock to Choose?
S&P Global Inc. (SPGI) displays strong income growth with a 13.69% revenue rise in 2024 and a favorable net margin of 27.11%. Its financial ratios are mixed, with favorable debt levels and interest coverage but unfavorable valuation multiples and liquidity ratios. Despite a very favorable rating (B+), its economic moat evaluation is very unfavorable due to declining ROIC below WACC, indicating value destruction.
FactSet Research Systems Inc. (FDS) shows moderate income growth with a 5.39% revenue increase in 2025 and a solid net margin of 25.72%. Its financial ratios are more favorable overall, particularly in profitability and cost of capital, with a very favorable rating (A-) and a slightly favorable moat status due to positive ROIC over WACC despite a declining trend.
Investors focused on value creation and financial strength might find FactSet’s profile slightly more favorable given its better rating and moat status, while those prioritizing robust income growth and established market presence may interpret S&P Global’s income performance as appealing despite its weaker moat.
Disclaimer: Investment carries a risk of loss of initial capital. The past performance is not a reliable indicator of future results. Be sure to understand risks before making an investment decision.
Go Further
I encourage you to read the complete analyses of S&P Global Inc. and FactSet Research Systems Inc. to enhance your investment decisions: