Home > Comparison > Financial Services > NDAQ vs FDS
The strategic rivalry between Nasdaq, Inc. and FactSet Research Systems Inc. shapes the financial data and analytics industry’s evolution. Nasdaq operates a diversified marketplace platform blending technology-driven exchange services and market intelligence. In contrast, FactSet focuses on integrated financial data and workflow solutions tailored to investment professionals. This analysis will evaluate which company’s operational model delivers superior risk-adjusted returns for investors seeking exposure to financial services innovation.

Table of contents
Companies Overview
Nasdaq and FactSet stand as pivotal players in the financial data and market services sector, shaping investment intelligence and market infrastructure globally.
Nasdaq, Inc.: Market Infrastructure & Technology Leader
Nasdaq dominates as a technology company serving capital markets worldwide. It generates revenue through diversified segments: market technology SaaS solutions targeting anti-financial crime, investment intelligence selling real-time and historical data, and market services operating multiple asset class exchanges. In 2021, Nasdaq’s strategic focus sharpened on expanding its anti-financial crime technology and broadening its market platform offerings.
FactSet Research Systems Inc.: Financial Data & Analytics Powerhouse
FactSet operates as a financial data and analytics provider to global investment professionals. Its core revenue stems from integrated workflow solutions spanning research, analytics, trading, content, and wealth management. In 2021, FactSet concentrated on enhancing its workflow integration to deepen client insight and improve data-driven decision-making across diverse financial sectors.
Strategic Collision: Similarities & Divergences
Both firms compete in financial data but diverge in approach: Nasdaq emphasizes a market infrastructure ecosystem blending technology and exchange services, while FactSet focuses on workflow-centric analytics and content delivery. Their battleground centers on providing actionable intelligence to investment professionals. Nasdaq’s multi-asset exchange model contrasts with FactSet’s deep client workflow integration, crafting distinct investment profiles rooted in infrastructure versus data analytics specialization.
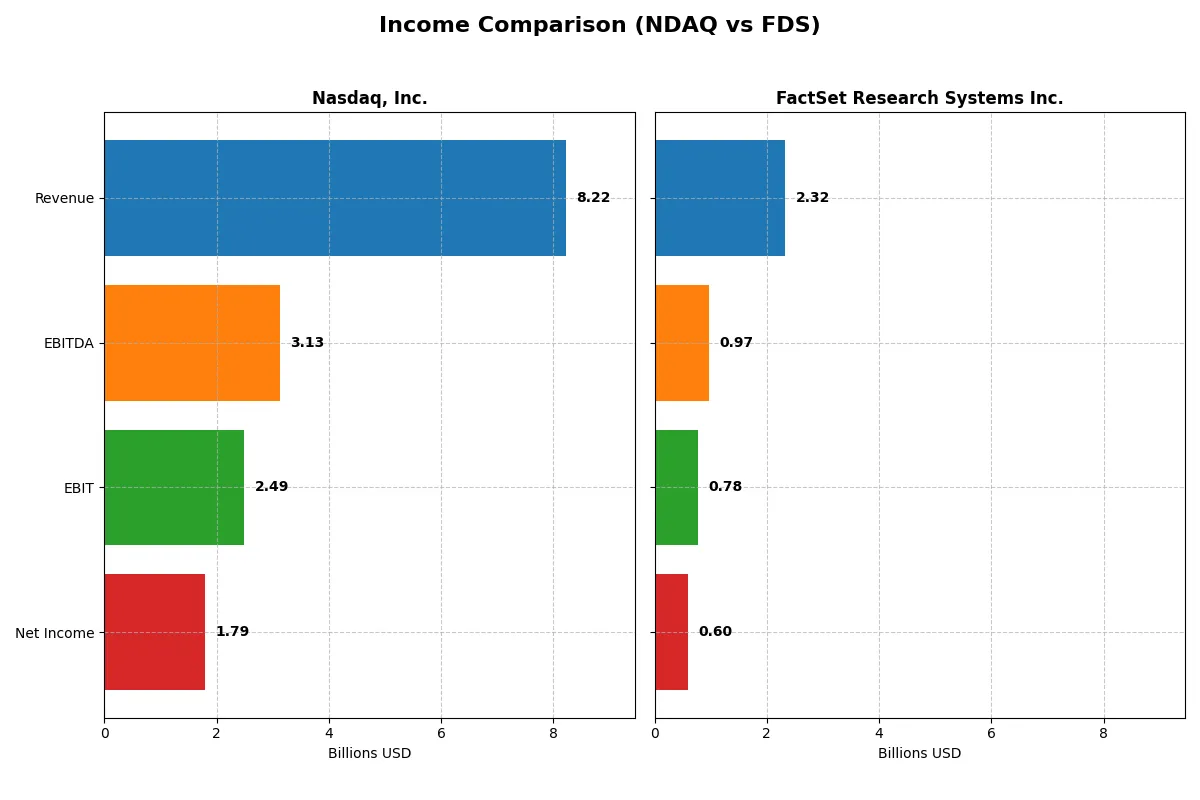
Income Statement Comparison
This data dissects the core profitability and scalability of both corporate engines to reveal who dominates the bottom line:
| Metric | Nasdaq, Inc. (NDAQ) | FactSet Research Systems Inc. (FDS) |
|---|---|---|
| Revenue | 8.22B | 2.32B |
| Cost of Revenue | 4.28B | 1.10B |
| Operating Expenses | 1.61B | 476M |
| Gross Profit | 3.94B | 1.22B |
| EBITDA | 3.13B | 966M |
| EBIT | 2.49B | 777M |
| Interest Expense | 88M | 56M |
| Net Income | 1.79B | 597M |
| EPS | 3.13 | 15.74 |
| Fiscal Year | 2025 | 2025 |
Income Statement Analysis: The Bottom-Line Duel
This income statement comparison reveals which company runs a more efficient and profitable corporate engine through recent performance metrics.
Nasdaq, Inc. Analysis
Nasdaq’s revenue grew steadily from $5.9B in 2021 to $8.2B in 2025, with net income rising from $1.19B to $1.79B. Its gross margin holds firm near 48%, while net margin improved to 21.8%. In 2025, Nasdaq accelerated profit growth with a 44% net margin expansion, showing robust operational momentum despite rising operating expenses.
FactSet Research Systems Inc. Analysis
FactSet’s revenue climbed from $1.59B in 2021 to $2.32B in 2025, with net income increasing from $400M to $597M. Its gross margin stands higher at 52.7%, and net margin at 25.7%. FactSet’s growth moderates recently, with a 5.4% revenue increase in 2025 but maintains solid margin expansion and efficient expense management, reflecting consistent profitability.
Margin Strength vs. Growth Momentum
Nasdaq delivers stronger revenue and net income growth, with a notable boost in net margin and EPS in 2025. FactSet, however, sustains superior gross and net margins but shows slower top-line momentum. Nasdaq’s profile appeals to investors seeking accelerating scale and profit growth, while FactSet suits those prioritizing margin stability and steady returns.
Financial Ratios Comparison
These vital ratios act as a diagnostic tool to expose the underlying fiscal health, valuation premiums, and capital efficiency of the companies compared below:
| Ratios | Nasdaq, Inc. (NDAQ) | FactSet Research Systems Inc. (FDS) |
|---|---|---|
| ROE | 14.6% | 27.3% |
| ROIC | -26.9% (negative) | 16.1% |
| P/E | 31.1 | 23.7 |
| P/B | 4.55 | 6.48 |
| Current Ratio | 0.00 (missing) | 1.40 |
| Quick Ratio | 0.00 (missing) | 1.40 |
| D/E (Debt-to-Equity) | 0.81 | 0.71 |
| Debt-to-Assets | 32.0% | 36.2% |
| Interest Coverage | -6.63 (negative) | 13.29 |
| Asset Turnover | 0.26 | 0.54 |
| Fixed Asset Turnover | 6.99 | 11.22 |
| Payout Ratio | 33.7% | 26.8% |
| Dividend Yield | 1.08% | 1.13% |
| Fiscal Year | 2025 | 2025 |
Efficiency & Valuation Duel: The Vital Signs
Financial ratios serve as a company’s DNA, unveiling hidden risks and operational strengths that shape investor decisions in subtle ways.
Nasdaq, Inc.
Nasdaq posts a solid net margin of 21.76% but delivers a modest ROE of 14.62%, signaling average profitability. Its P/E ratio of 31.14 suggests the stock is expensive compared to peers. The company offers a 1.08% dividend yield, balancing shareholder returns while reinvesting selectively given its unfavorable ROIC of -26.92%.
FactSet Research Systems Inc.
FactSet excels with a 25.72% net margin and a robust 27.31% ROE, reflecting strong profitability and capital efficiency. Its P/E ratio of 23.71 is more reasonable, although a high P/B of 6.48 signals some valuation tension. FactSet pays a 1.13% dividend and invests heavily in R&D, supporting growth and innovation.
Premium Valuation vs. Operational Safety
FactSet combines superior profitability with a more balanced valuation and reinvestment approach. Nasdaq’s stretched multiples and weak ROIC raise caution. Investors favoring growth with operational strength may prefer FactSet, while those accepting higher risk for market position might consider Nasdaq.
Which one offers the Superior Shareholder Reward?
Nasdaq, Inc. (NDAQ) yields around 1.08% with a 34% payout ratio and moderate buybacks, balancing income and growth. FactSet Research Systems Inc. (FDS) pays a slightly lower yield near 1.13% but maintains a more conservative ~27% payout alongside aggressive buybacks fueling capital returns. I see FDS’s buyback intensity and sustainable payout as superior for total shareholder return in 2026, offering a more compelling mix of income and capital appreciation than NDAQ’s higher payout ratio but less pronounced buyback activity.
Comparative Score Analysis: The Strategic Profile
The radar chart reveals the fundamental DNA and trade-offs of Nasdaq, Inc. and FactSet Research Systems Inc., highlighting their strategic financial strengths and vulnerabilities:
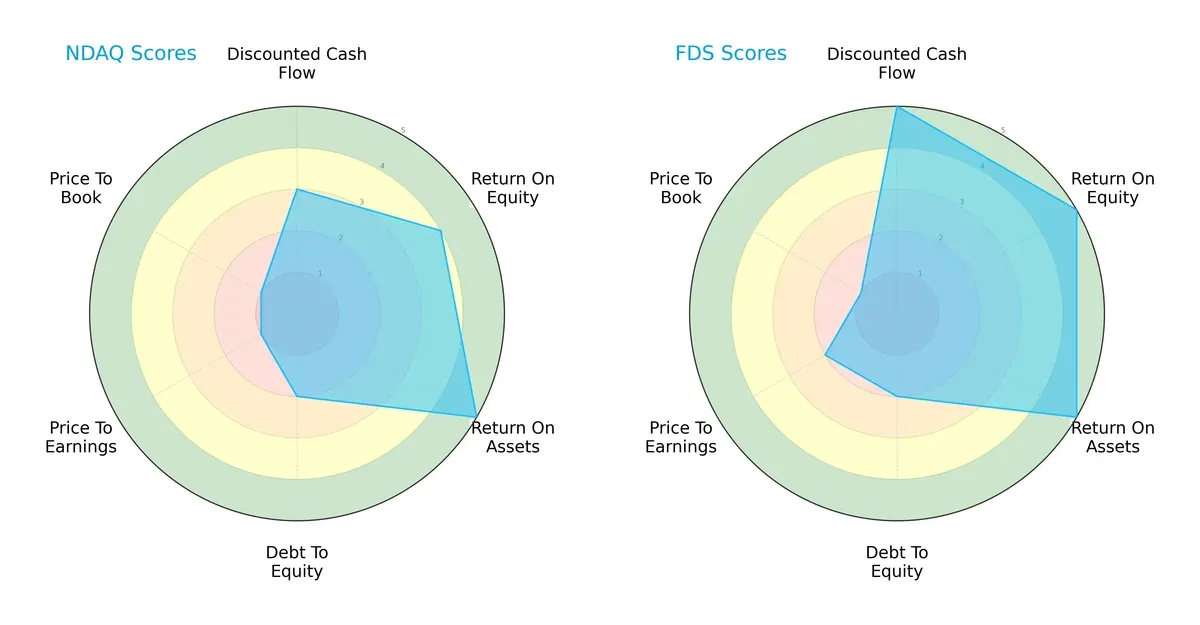
FactSet outperforms Nasdaq in overall score (4 vs. 3) and shines in discounted cash flow, ROE, and ROA, signaling superior profitability and asset efficiency. Nasdaq shows a more conservative debt profile but suffers from valuation concerns with very unfavorable P/E and P/B scores. FactSet’s profile is more balanced, leveraging strong operational metrics, while Nasdaq relies on asset efficiency amid valuation pressure.
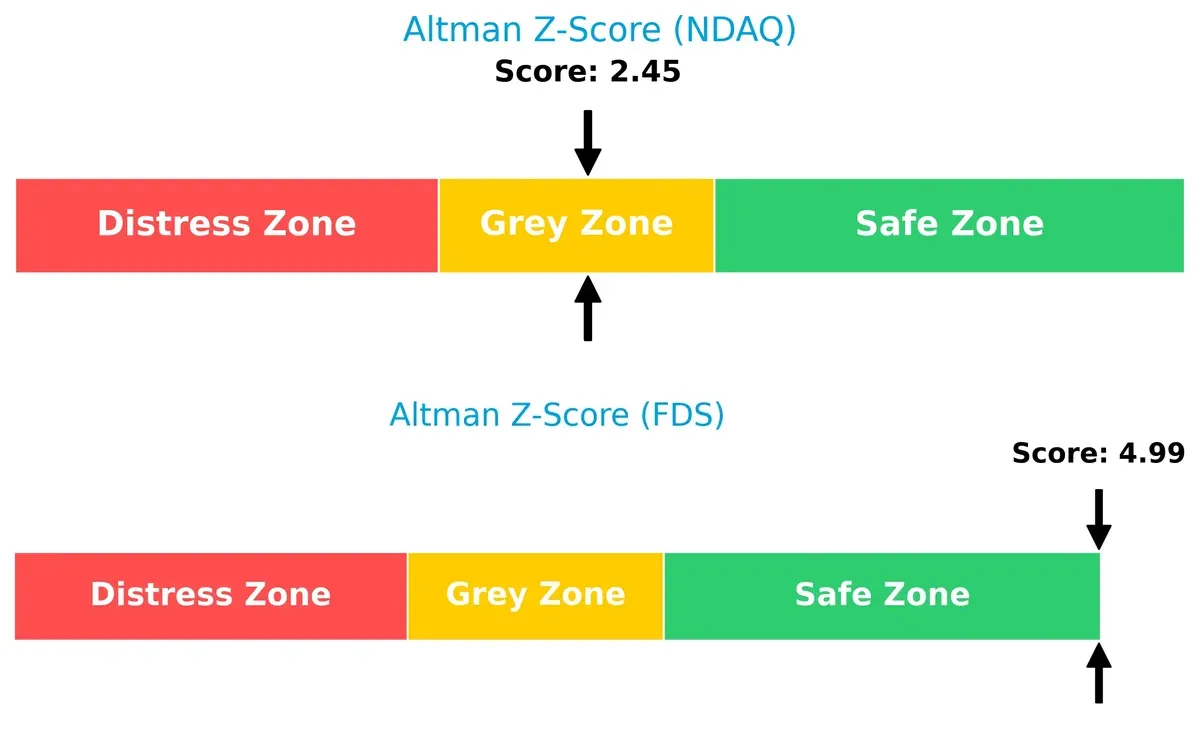
Bankruptcy Risk: Solvency Showdown
FactSet’s Altman Z-Score at 4.99 firmly places it in the safe zone, whereas Nasdaq’s 2.45 sits in the grey zone, implying higher bankruptcy risk for Nasdaq amid economic uncertainty:
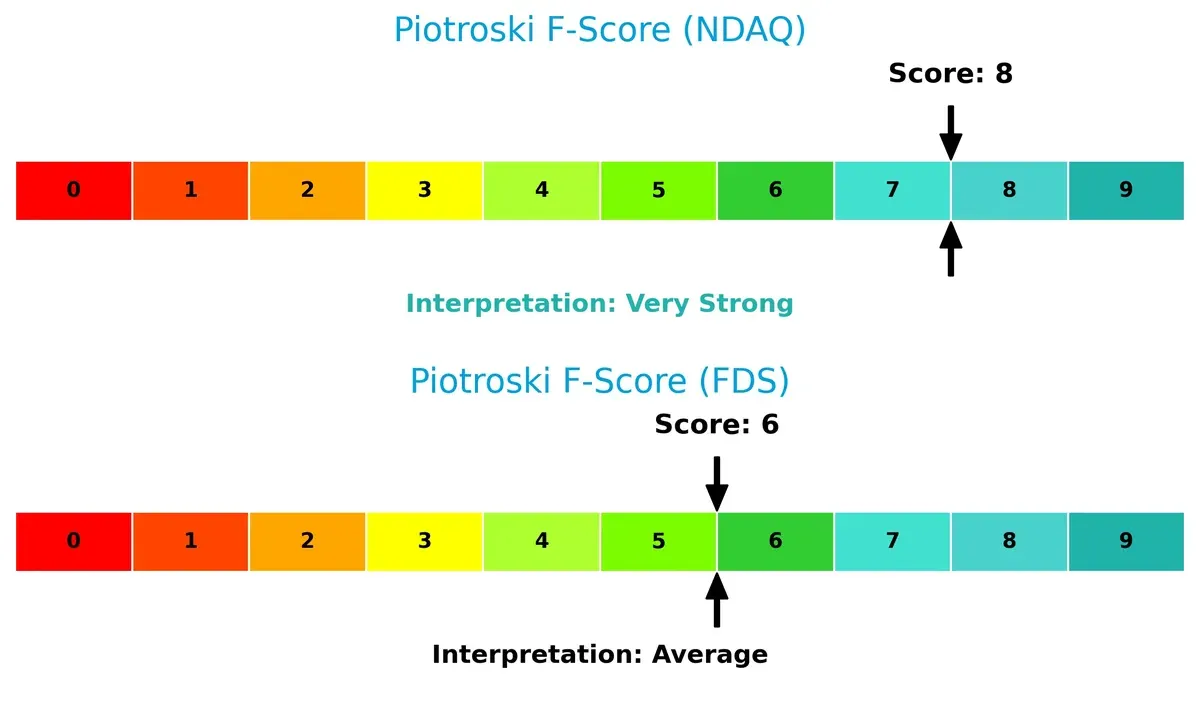
Financial Health: Quality of Operations
Nasdaq scores 8 on the Piotroski F-Score, indicating very strong internal financial health, outperforming FactSet’s average score of 6. This suggests robust profitability and operational quality for Nasdaq, while FactSet shows moderate red flags:
How are the two companies positioned?
This section dissects the operational DNA of Nasdaq and FactSet by comparing their revenue distribution by segment and analyzing internal strengths and weaknesses. The final objective is to confront their economic moats to identify which model offers the most resilient and sustainable competitive advantage in today’s market.
Revenue Segmentation: The Strategic Mix
This comparison dissects how Nasdaq, Inc. and FactSet Research Systems Inc. diversify their income streams and where their primary sector bets lie:
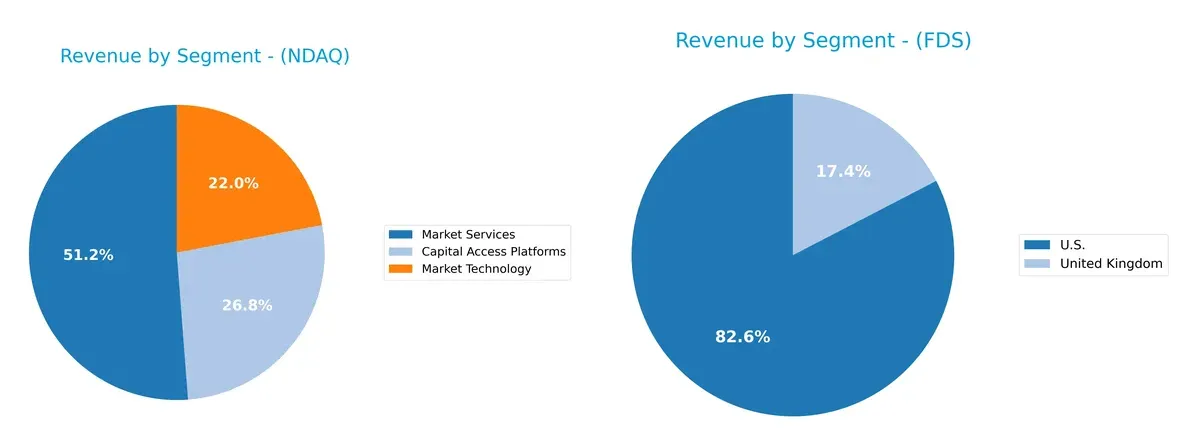
Nasdaq anchors its revenue in Market Services with $3.77B in 2024, supported by Capital Access Platforms at $1.97B and Market Technology at $1.62B. This mix shows moderate diversification, reducing concentration risk. FactSet, by contrast, relies heavily on the U.S. market ($498M) with a smaller UK segment ($105M), indicating geographic concentration risk. Nasdaq’s ecosystem lock-in contrasts with FactSet’s regional dependency, shaping different strategic resilience profiles.
Strengths and Weaknesses Comparison
This table compares the Strengths and Weaknesses of Nasdaq and FactSet based on diversification, profitability, financials, innovation, global presence, and market share:
Nasdaq Strengths
- Diverse revenue streams including Capital Access, Market Technology, and Market Services
- Strong net margin at 21.76%
- High interest coverage ratio at 28.34
- Favorable fixed asset turnover of 6.99
- Large U.S. market presence with 5.8B revenue
- Consistent dividend yield at 1.08%
FactSet Strengths
- Higher net margin at 25.72%
- Superior ROE of 27.31% and positive ROIC at 16.1%
- Favorable WACC at 6.73%
- Healthy liquidity with quick ratio of 1.4
- Strong fixed asset turnover at 11.22
- Global revenue diversification including U.S., Europe, and UK markets
Nasdaq Weaknesses
- Negative ROIC of -26.92% indicates poor capital efficiency
- Unfavorable valuation metrics with PE 31.14 and PB 4.55
- Zero current and quick ratios raise liquidity concerns
- Low asset turnover at 0.26 suggests inefficient asset use
- Slightly unfavorable overall financial ratio profile
- Heavy reliance on U.S. market with limited international revenue
FactSet Weaknesses
- Unfavorable PB ratio at 6.48
- Moderate debt to assets ratio at 36.21%
- Neutral asset turnover at 0.54 limits operational efficiency insights
- More concentrated geographic revenue than Nasdaq
- Slightly favorable but still mixed financial ratios overall
Nasdaq shows strength in diversified revenue streams and strong interest coverage but struggles with capital efficiency and liquidity ratios. FactSet demonstrates superior profitability and liquidity metrics with broader global exposure but faces challenges in valuation and moderate asset efficiency. These contrasts highlight differing strategic focuses and financial health indicators for each company.
The Moat Duel: Analyzing Competitive Defensibility
A structural moat is the sole barrier protecting long-term profits from relentless competitive erosion. Let’s dissect the moats of two industry players:
Nasdaq, Inc.: Network Effects and Platform Integration
Nasdaq’s moat stems from powerful network effects linking exchanges, data, and technology services. This drives stable margins despite intense competition. However, its negative ROIC trend signals value erosion, risking moat durability in 2026 unless innovation accelerates.
FactSet Research Systems Inc.: Intangible Assets and Data Integration
FactSet’s competitive edge lies in its proprietary financial data and analytics platforms, creating high switching costs. It maintains a modestly positive ROIC above WACC, affirming value creation, though a slight ROIC decline hints at emerging pressures. Expansion in AI-driven analytics could strengthen its moat.
Verdict: Network Effects vs. Data Proprietorship
Nasdaq commands a broader ecosystem moat rooted in network effects but struggles with declining capital returns. FactSet’s narrower moat is financially healthier, consistently creating value. FactSet appears better positioned to defend its turf amid shifting industry dynamics.
Which stock offers better returns?
Nasdaq, Inc. and FactSet Research Systems Inc. exhibit contrasting price movements over the past year, with Nasdaq showing strong gains and FactSet facing significant declines.
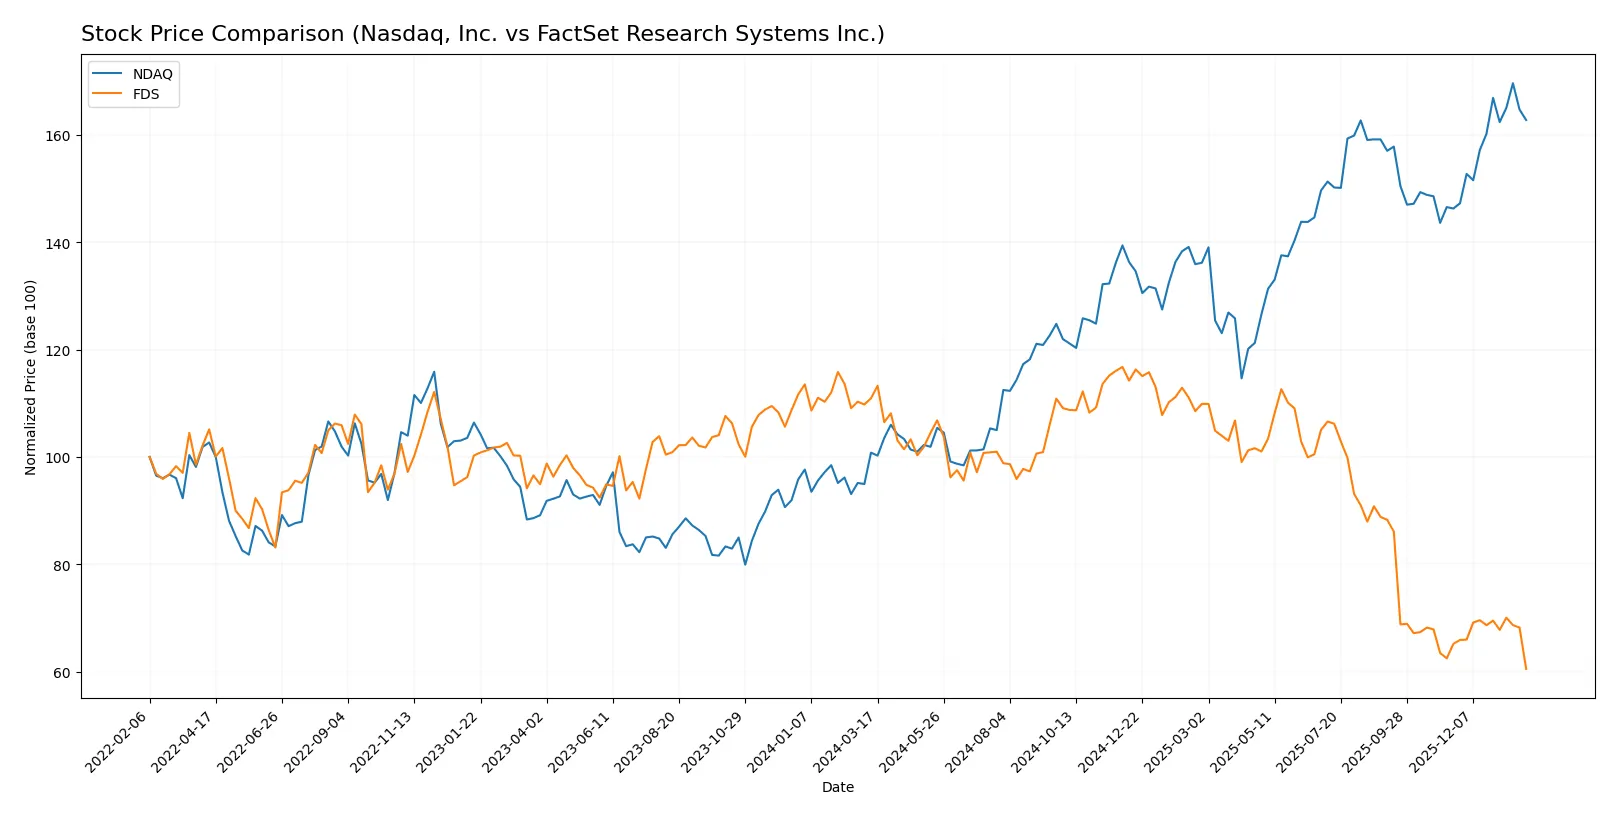
Trend Comparison
Nasdaq, Inc. posts a robust 61.46% price increase over the past year, marking a bullish trend with acceleration and moderate volatility (std dev 11.97). The stock peaked at 100.98 and troughed at 58.6.
FactSet Research Systems Inc. registers a 45.43% price decline over the same period, reflecting a bearish trend with accelerating downside and very high volatility (std dev 68.25). Its highest price was 490.67 and lowest 254.36.
Nasdaq’s strong upward momentum contrasts sharply with FactSet’s steep decline, making Nasdaq the higher performer by a wide margin in market returns.
Target Prices
Analysts set a solid target consensus for Nasdaq, Inc. and FactSet Research Systems Inc., reflecting growth expectations.
| Company | Target Low | Target High | Consensus |
|---|---|---|---|
| Nasdaq, Inc. | 100 | 120 | 111.8 |
| FactSet Research Systems Inc. | 253 | 321 | 296.89 |
The target consensus for Nasdaq, Inc. stands roughly 15% above the current 96.9 price, signaling moderate upside. FactSet’s consensus price exceeds its 254.4 share price by about 17%, indicating bullish analyst sentiment.

Don’t Let Luck Decide Your Entry Point
Optimize your entry points with our advanced ProRealTime indicators. You’ll get efficient buy signals with precise price targets for maximum performance. Start outperforming now!
How do institutions grade them?
The following tables summarize recent institutional grades for Nasdaq, Inc. and FactSet Research Systems Inc.:
Nasdaq, Inc. Grades
This table presents the latest grades from major financial institutions for Nasdaq, Inc.
| Grading Company | Action | New Grade | Date |
|---|---|---|---|
| JP Morgan | Maintain | Overweight | 2026-01-30 |
| Barclays | Maintain | Overweight | 2026-01-30 |
| RBC Capital | Maintain | Outperform | 2026-01-30 |
| Morgan Stanley | Maintain | Overweight | 2026-01-30 |
| TD Cowen | Maintain | Hold | 2026-01-30 |
| Morgan Stanley | Maintain | Overweight | 2026-01-15 |
| TD Cowen | Maintain | Hold | 2026-01-14 |
| JP Morgan | Maintain | Overweight | 2026-01-12 |
| UBS | Maintain | Buy | 2026-01-12 |
| Barclays | Maintain | Overweight | 2026-01-08 |
FactSet Research Systems Inc. Grades
This table lists recent grades from reputable firms for FactSet Research Systems Inc.
| Grading Company | Action | New Grade | Date |
|---|---|---|---|
| Wells Fargo | Maintain | Underweight | 2026-01-14 |
| Evercore ISI Group | Maintain | In Line | 2026-01-08 |
| BMO Capital | Maintain | Market Perform | 2025-12-22 |
| RBC Capital | Maintain | Sector Perform | 2025-12-19 |
| Goldman Sachs | Maintain | Sell | 2025-12-19 |
| Stifel | Maintain | Hold | 2025-12-19 |
| Morgan Stanley | Upgrade | Equal Weight | 2025-12-17 |
| Wells Fargo | Maintain | Underweight | 2025-12-05 |
| UBS | Upgrade | Buy | 2025-09-22 |
| Barclays | Maintain | Underweight | 2025-09-19 |
Which company has the best grades?
Nasdaq, Inc. consistently receives positive grades such as Overweight, Outperform, and Buy. FactSet shows mixed to negative ratings including Underweight, Sell, and Hold. Nasdaq’s stronger grades may boost investor confidence more significantly.
Risks specific to each company
The following categories identify the critical pressure points and systemic threats facing both firms in the 2026 market environment:
1. Market & Competition
Nasdaq, Inc.
- Faces intense competition from global exchanges and fintech firms innovating rapidly.
FactSet Research Systems Inc.
- Competes in a crowded financial data space but benefits from strong client relationships and integrated analytics.
2. Capital Structure & Debt
Nasdaq, Inc.
- Moderate leverage with debt-to-equity at 0.81; interest coverage strong at 28.34, signaling manageable risk.
FactSet Research Systems Inc.
- Similar leverage ratio at 0.71; interest coverage lower at 13.8 but still comfortable, reflecting solid debt management.
3. Stock Volatility
Nasdaq, Inc.
- Beta near 1.02 indicates stock moves roughly in line with the market, moderate volatility.
FactSet Research Systems Inc.
- Lower beta at 0.74 suggests more defensive stock behavior and reduced market sensitivity.
4. Regulatory & Legal
Nasdaq, Inc.
- Heavily regulated as an exchange operator; compliance costs and legal risks remain material.
FactSet Research Systems Inc.
- Faces regulatory scrutiny in data handling and privacy but less exposed to exchange-specific regulations.
5. Supply Chain & Operations
Nasdaq, Inc.
- Operational complexity across multiple asset classes poses integration and technology risks.
FactSet Research Systems Inc.
- Relies on data acquisition and software delivery; risks tied to data quality and IT infrastructure resilience.
6. ESG & Climate Transition
Nasdaq, Inc.
- Increasing pressure to enhance ESG disclosure standards for listed companies, potential compliance costs.
FactSet Research Systems Inc.
- ESG integration in analytics is an opportunity but also a compliance challenge amid evolving investor demands.
7. Geopolitical Exposure
Nasdaq, Inc.
- Global market presence exposes Nasdaq to geopolitical tensions affecting capital flows and regulations.
FactSet Research Systems Inc.
- Operates worldwide with exposure to regional data regulation and trade policy shifts impacting service delivery.
Which company shows a better risk-adjusted profile?
FactSet’s strongest risk lies in competitive pressure within the financial data sector, while Nasdaq wrestles with regulatory and operational complexity risks. FactSet’s higher Altman Z-Score (4.99, safe zone) and more favorable financial ratios point to a stronger risk-adjusted profile. Nasdaq’s unfavorable ROIC and stretched valuation metrics justify caution despite its market leadership.
Final Verdict: Which stock to choose?
Nasdaq, Inc. displays a superpower in robust income growth and expanding margins, signaling operational strength. Yet, its weakening capital efficiency and liquidity pose a point of vigilance. It suits investors with an appetite for aggressive growth who can tolerate short-term value erosion.
FactSet Research Systems commands a strategic moat through recurring revenue and high returns on invested capital. It offers better financial stability and a safer balance sheet than Nasdaq. Its profile fits well with investors seeking growth at a reasonable price and moderate risk.
If you prioritize rapid income expansion and can accept capital allocation challenges, Nasdaq outshines with its momentum. However, if you seek durable moat advantages and stronger financial health, FactSet offers better stability despite recent price softness. Both present distinct analytical scenarios aligned with differing investor risk tolerances.
Disclaimer: Investment carries a risk of loss of initial capital. The past performance is not a reliable indicator of future results. Be sure to understand risks before making an investment decision.
Go Further
I encourage you to read the complete analyses of Nasdaq, Inc. and FactSet Research Systems Inc. to enhance your investment decisions: