Home > Comparison > Financial Services > MSCI vs FDS
The strategic rivalry between MSCI Inc. and FactSet Research Systems Inc. shapes the financial data services landscape. MSCI blends index licensing with advanced ESG analytics, focusing on asset owners and private markets. FactSet, with a broader client base, excels in integrated financial data and workflow solutions. This analysis contrasts their business models to identify which offers superior risk-adjusted returns, guiding investors seeking durable growth in financial services.

Table of contents
Companies Overview
MSCI Inc. and FactSet Research Systems Inc. stand as pivotal players in financial data and analytics, shaping global investment strategies.
MSCI Inc.: Global Investment Decision Innovator
MSCI Inc. anchors itself as a leading provider of investment decision support tools worldwide. It generates revenue by licensing indexes, analytics, ESG data, and private asset insights to asset managers and financial intermediaries. In 2026, MSCI sharpens its strategic focus on expanding ESG and climate-related analytics, reflecting rising investor demand for sustainable finance solutions.
FactSet Research Systems Inc.: Integrated Financial Analytics Powerhouse
FactSet delivers comprehensive financial data and workflow solutions to the investment community globally. Its core revenue stems from subscription-based access to integrated research, analytics, and trading tools. For 2026, FactSet emphasizes enhancing technology-driven content and analytics to deepen integration across portfolio management and trading workflows.
Strategic Collision: Similarities & Divergences
Both firms excel in financial data but differ in philosophy: MSCI leads with specialized index and ESG analytics, while FactSet offers a more integrated workflow platform. They primarily compete for institutional asset managers’ subscription budgets. MSCI’s innovation in ESG analytics contrasts with FactSet’s broad workflow integration, defining two distinct profiles within financial services data vendors.
Income Statement Comparison
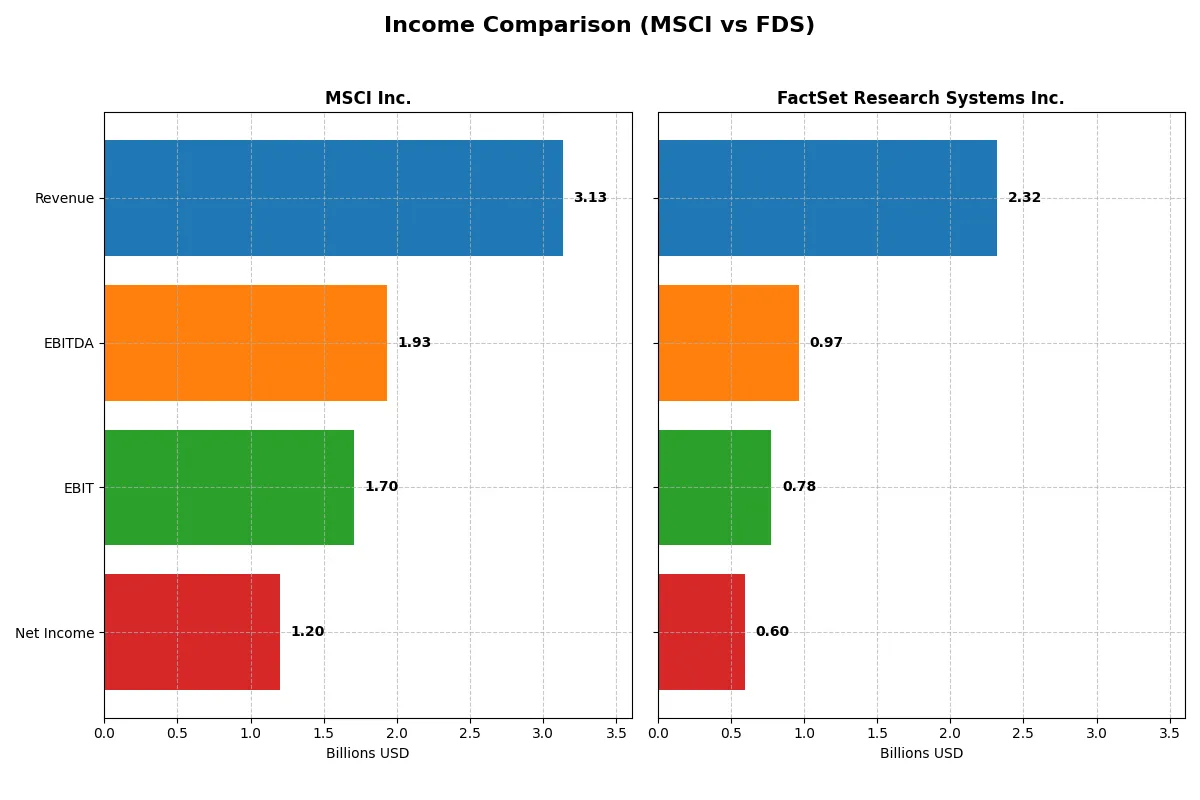
This data dissects the core profitability and scalability of both corporate engines to reveal who dominates the bottom line:
| Metric | MSCI Inc. (MSCI) | FactSet Research Systems Inc. (FDS) |
|---|---|---|
| Revenue | 3.13B | 2.32B |
| Cost of Revenue | 550M | 1.10B |
| Operating Expenses | 871M | 476M |
| Gross Profit | 2.58B | 1.22B |
| EBITDA | 1.93B | 966M |
| EBIT | 1.70B | 777M |
| Interest Expense | 210M | 56M |
| Net Income | 1.20B | 597M |
| EPS | 15.58 | 15.74 |
| Fiscal Year | 2025 | 2025 |
Income Statement Analysis: The Bottom-Line Duel
This comparison reveals which company converts revenue into profit more efficiently, exposing the true strength of each business model.
MSCI Inc. Analysis
MSCI’s revenue climbed steadily from 2.04B in 2021 to 3.13B in 2025, reflecting a 53% growth over five years. Net income surged 65% to 1.2B in 2025. The company maintains robust margins, with an 82.4% gross margin and a strong 38.4% net margin in the latest year, signaling excellent cost control and operational efficiency.
FactSet Research Systems Inc. Analysis
FactSet’s revenue rose from 1.59B in 2021 to 2.32B in 2025, a solid 46% increase. Net income grew 49% to 597M in 2025. Its margins are healthy but notably lower than MSCI’s, with a 52.7% gross margin and 25.7% net margin in the latest year. FactSet shows consistent EBIT growth and improving net margin, highlighting steady operational momentum.
Margin Dominance vs. Steady Scale Growth
MSCI outpaces FactSet with higher revenue and net income growth, supported by superior gross and net margins. FactSet delivers respectable growth but with less margin efficiency. For investors, MSCI’s profile suits those prioritizing margin strength, while FactSet appeals to those valuing steady scale gains in a competitive sector.
Financial Ratios Comparison
These vital ratios act as a diagnostic tool to expose the underlying fiscal health, valuation premiums, and capital efficiency of each company:
| Ratios | MSCI Inc. (MSCI) | FactSet Research Systems Inc. (FDS) |
|---|---|---|
| ROE | -45.3% | 27.3% |
| ROIC | 35.6% | 16.1% |
| P/E | 36.8 | 23.7 |
| P/B | -16.7 | 6.48 |
| Current Ratio | 0.90 | 1.40 |
| Quick Ratio | 0.90 | 1.40 |
| D/E | -2.42 | 0.71 |
| Debt-to-Assets | 113% | 36.2% |
| Interest Coverage | 8.16 | 13.3 |
| Asset Turnover | 0.55 | 0.54 |
| Fixed Asset Turnover | 15.7 | 11.2 |
| Payout ratio | 46.3% | 26.8% |
| Dividend yield | 1.26% | 1.13% |
| Fiscal Year | 2025 | 2025 |
Efficiency & Valuation Duel: The Vital Signs
Financial ratios act as a company’s DNA, uncovering hidden risks and operational strengths that define investment potential.
MSCI Inc.
MSCI shows strong profitability with a 38.36% net margin and a robust 35.6% ROIC versus an 8.94% WACC, indicating operational efficiency. However, a negative ROE at -45.29% and a high P/E of 36.82 suggest the stock trades at a premium and faces shareholder return challenges. Dividend yield stands modest at 1.26%, balancing some risk.
FactSet Research Systems Inc.
FactSet posts a solid 25.72% net margin and a healthy 27.31% ROE, signaling effective equity returns. Its P/E of 23.71 is more reasonable, reflecting fair valuation. The company maintains a 1.13% dividend yield and invests heavily in R&D, supporting growth while preserving capital efficiency and shareholder value.
Premium Valuation vs. Operational Safety
MSCI commands a premium valuation with superior ROIC but suffers from negative ROE and stretched balance sheet metrics. FactSet delivers steadier equity returns and more balanced leverage. For risk-averse investors, FactSet’s blend of profitability and valuation offers a safer profile, while MSCI suits those targeting operational efficiency at higher risk.
Which one offers the Superior Shareholder Reward?
I compare MSCI Inc. and FactSet Research Systems Inc. on dividends and buybacks. MSCI yields 1.26% with a 46% payout, supported by strong free cash flow (20B+ per share) and moderate buybacks. FactSet yields slightly higher at 1.13%, with a lower 27% payout ratio but also significant buybacks fueling total return. MSCI’s reinvestment capacity remains robust despite higher leverage concerns. FactSet shows healthier solvency and capital allocation balance. I find FactSet’s model more sustainable and attractive for total shareholder return in 2026 due to disciplined payouts and efficient buybacks.
Comparative Score Analysis: The Strategic Profile
The radar chart below reveals the fundamental DNA and trade-offs of MSCI Inc. and FactSet Research Systems Inc.:
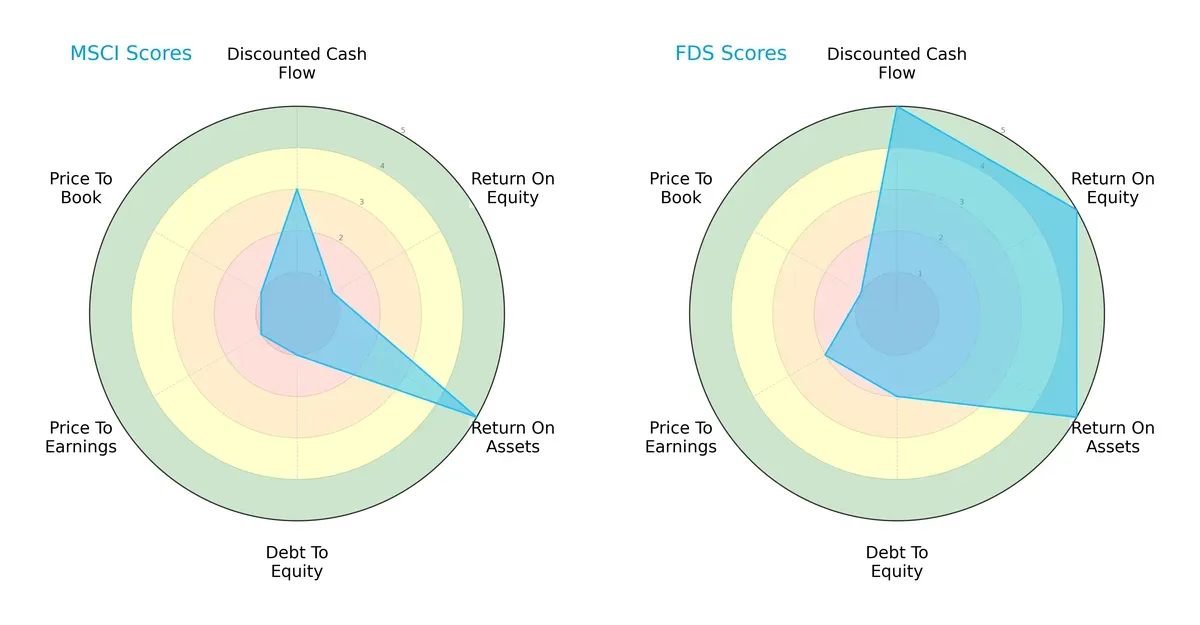
FactSet exhibits a balanced profile with very favorable scores in DCF, ROE, and ROA, signaling efficient capital use and strong profitability. MSCI leans heavily on asset efficiency (high ROA) but suffers from weak equity returns and heavy debt (low ROE, debt-to-equity). FactSet’s valuation metrics, while not perfect, remain more attractive than MSCI’s expensive multiples. Overall, FactSet dominates with a more stable and well-rounded financial stance.
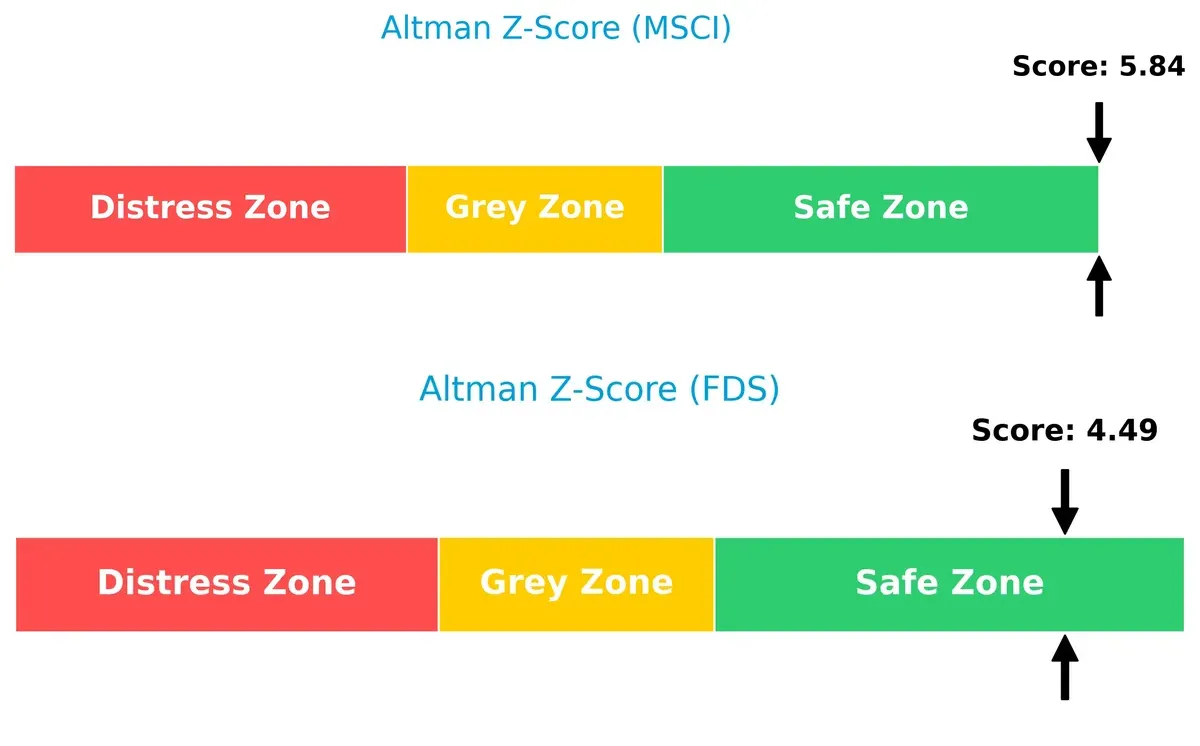
Bankruptcy Risk: Solvency Showdown
FactSet’s Altman Z-Score of 4.49 versus MSCI’s 5.84 indicates both firms reside comfortably in the safe zone, but MSCI holds a stronger buffer against financial distress in this cycle:
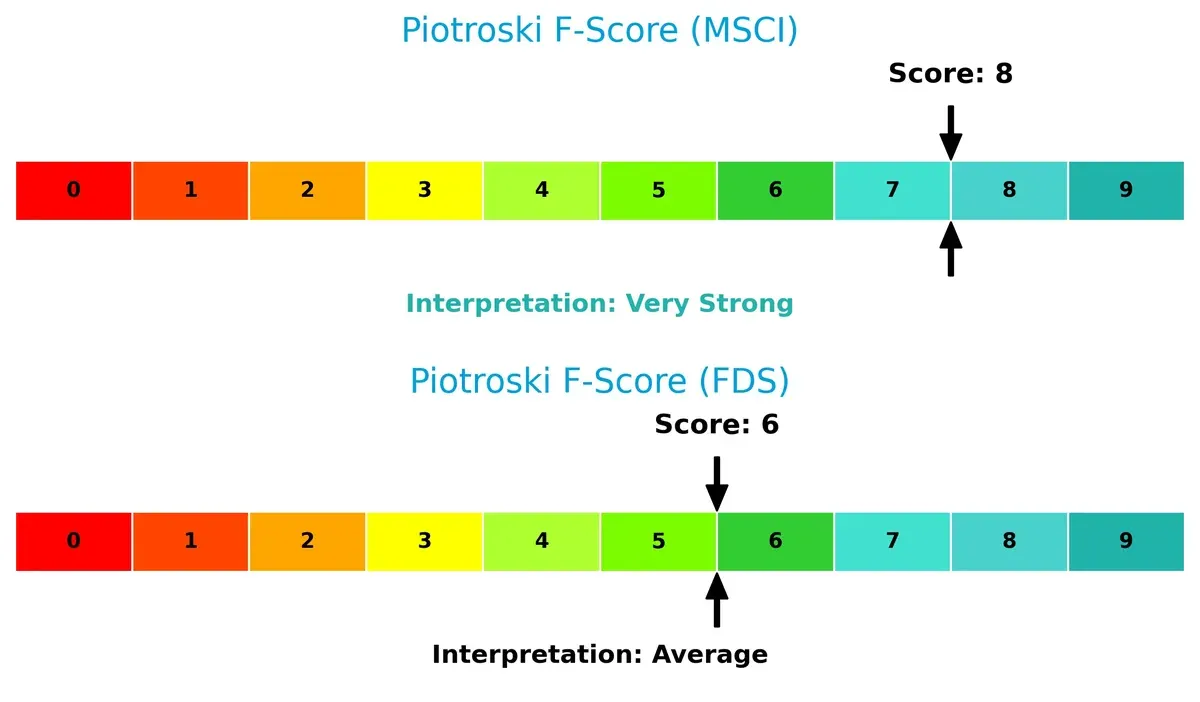
Financial Health: Quality of Operations
MSCI scores an 8 on the Piotroski scale, reflecting very strong financial health, while FactSet’s 6 signals average strength. MSCI’s internal metrics suggest fewer red flags despite weaker market scores:
How are the two companies positioned?
This section dissects MSCI and FactSet’s operational DNA by comparing revenue distribution and internal dynamics. The goal is to confront their economic moats and identify which model offers the most resilient competitive advantage today.
Revenue Segmentation: The Strategic Mix
This visual comparison dissects how MSCI Inc. and FactSet Research Systems Inc. diversify their income streams and where their primary sector bets lie:
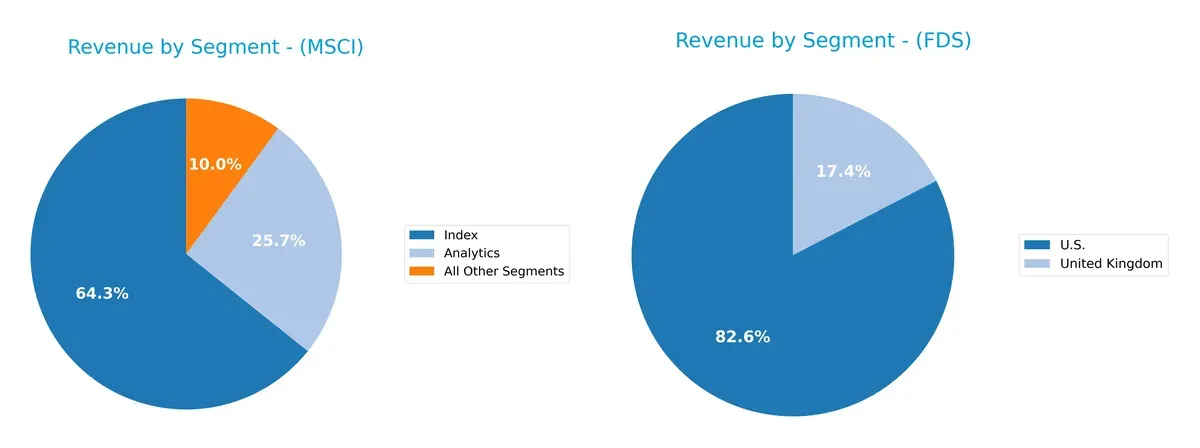
MSCI anchors its revenue in the Index segment with $1.79B in 2025, complemented by Analytics at $714M and All Other Segments at $279M, showing a balanced, multi-pronged strategy. FactSet leans heavily on its U.S. market with $498M and a smaller UK segment at $105M, reflecting geographic concentration risk. MSCI’s diversification supports ecosystem lock-in, while FactSet’s regional focus may limit resilience amid market shifts.
Strengths and Weaknesses Comparison
This table compares the Strengths and Weaknesses of MSCI Inc. and FactSet Research Systems Inc.:
MSCI Strengths
- High net margin at 38%
- Strong ROIC of 36% above WACC
- Favorable fixed asset turnover of 15.7
- Diverse revenue streams across Index, Analytics, ESG
- Broad global presence including Americas, EMEA, Asia
- Favorable debt-to-equity and interest coverage ratios
FactSet Strengths
- Favorable ROE and ROIC with positive spread above WACC
- Solid net margin at 26%
- Favorable quick ratio indicates liquidity
- Consistent revenue from U.S., Europe, U.K.
- Favorable interest coverage ratio of 13.8
- Favorable fixed asset turnover at 11.2
MSCI Weaknesses
- Negative ROE at -45% indicates profitability issues
- High debt-to-assets ratio over 112% poses leverage risk
- Unfavorable current ratio below 1 suggests liquidity concern
- Unfavorable P/E ratio of 36.8 may imply overvaluation
- Negative price-to-book ratio signals valuation anomaly
FactSet Weaknesses
- Unfavorable price-to-book ratio at 6.48
- Neutral current ratio at 1.4 may limit financial flexibility
- Moderate leverage with debt-to-assets at 36%
- P/E ratio neutral at 23.7 limits valuation edge
Overall, MSCI demonstrates strong profitability and asset efficiency but faces notable leverage and liquidity concerns. FactSet displays balanced profitability with better leverage metrics but valuation and liquidity ratios warrant monitoring. Both companies maintain diversified global footprints supporting their strategic positioning.
The Moat Duel: Analyzing Competitive Defensibility
A structural moat is the sole barrier protecting long-term profits from relentless competitive erosion. Let’s dissect these moats:
MSCI Inc.: Dominant Network Effects and Intangible Assets
MSCI’s moat stems from powerful network effects and proprietary data assets. It delivers high ROIC (27%) and margin stability above 54%. Expansion in ESG and climate analytics deepens its moat in 2026.
FactSet Research Systems Inc.: Strong Switching Costs and Integrated Solutions
FactSet’s moat relies on sticky client relationships and integrated workflow platforms, reflected in solid ROIC (10%) but a declining trend. Its moat is narrower than MSCI’s but poised for growth through tech upgrades and market penetration.
Network Effects vs. Switching Costs: The Moat Battle in Financial Data
MSCI’s wider, growing moat outpaces FactSet’s narrower, weakening competitive edge. MSCI is better positioned to defend and expand market share amid intensifying sector rivalry.
Which stock offers better returns?
The past 12 months reveal contrasting price dynamics: MSCI rallies with accelerating gains, while FactSet endures steep declines amid decelerating losses.
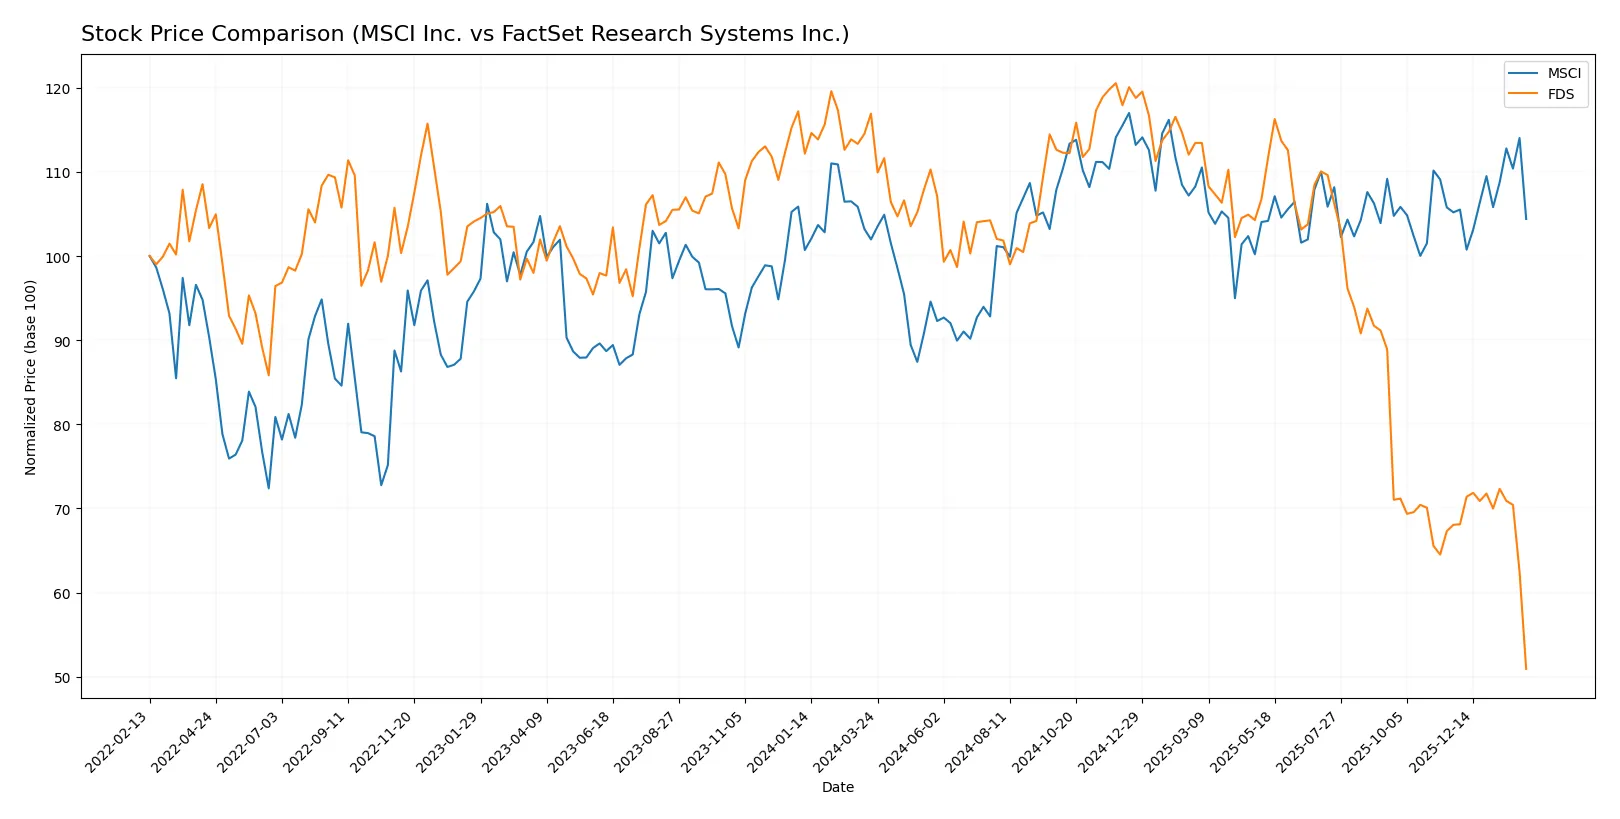
Trend Comparison
MSCI’s stock gained 2.39% over the year, marking a bullish trend with price acceleration and a high near 625.1. Volatility remains moderate at 35.43.
FactSet’s stock fell 56.44% in the same period, reflecting a bearish trend with deceleration. It showed higher volatility at 70.83 and a low near 207.3.
MSCI delivered the strongest market performance, maintaining positive momentum versus FactSet’s significant downward trajectory.
Target Prices
Analysts show a positive outlook for MSCI Inc. and FactSet Research Systems Inc., with target prices well above current levels.
| Company | Target Low | Target High | Consensus |
|---|---|---|---|
| MSCI Inc. | 618 | 715 | 664.5 |
| FactSet Research Systems Inc. | 215 | 321 | 287.89 |
The target consensus for MSCI at 664.5 suggests a significant upside from its current 558 price. FactSet’s consensus of 287.89 also points to a strong potential rebound from 207.32.

Don’t Let Luck Decide Your Entry Point
Optimize your entry points with our advanced ProRealTime indicators. You’ll get efficient buy signals with precise price targets for maximum performance. Start outperforming now!
How do institutions grade them?
MSCI Inc. Grades
Below are the recent grades from major financial institutions for MSCI Inc.:
| Grading Company | Action | New Grade | Date |
|---|---|---|---|
| Wells Fargo | Maintain | Equal Weight | 2026-01-29 |
| Evercore ISI Group | Maintain | Outperform | 2026-01-29 |
| Wells Fargo | Maintain | Equal Weight | 2026-01-14 |
| Wells Fargo | Maintain | Equal Weight | 2025-10-29 |
| UBS | Maintain | Buy | 2025-10-29 |
| Barclays | Maintain | Overweight | 2025-10-29 |
| JP Morgan | Maintain | Overweight | 2025-10-29 |
| Evercore ISI Group | Maintain | Outperform | 2025-10-14 |
| JP Morgan | Maintain | Overweight | 2025-09-10 |
| Wells Fargo | Maintain | Equal Weight | 2025-07-23 |
FactSet Research Systems Inc. Grades
Here are the recent grades from notable financial institutions for FactSet Research Systems Inc.:
| Grading Company | Action | New Grade | Date |
|---|---|---|---|
| Wells Fargo | Maintain | Underweight | 2026-02-04 |
| Wells Fargo | Maintain | Underweight | 2026-01-14 |
| Evercore ISI Group | Maintain | In Line | 2026-01-08 |
| BMO Capital | Maintain | Market Perform | 2025-12-22 |
| Stifel | Maintain | Hold | 2025-12-19 |
| Goldman Sachs | Maintain | Sell | 2025-12-19 |
| RBC Capital | Maintain | Sector Perform | 2025-12-19 |
| Morgan Stanley | Upgrade | Equal Weight | 2025-12-17 |
| Wells Fargo | Maintain | Underweight | 2025-12-05 |
| UBS | Upgrade | Buy | 2025-09-22 |
Which company has the best grades?
MSCI Inc. consistently receives positive grades, including multiple “Outperform,” “Buy,” and “Overweight” ratings. FactSet’s grades skew lower, with several “Underweight,” “Hold,” and “Sell” ratings despite a few upgrades. Investors may perceive MSCI as the stronger candidate based on current institutional sentiment.
Risks specific to each company
The following categories identify the critical pressure points and systemic threats facing both firms in the 2026 market environment:
1. Market & Competition
MSCI Inc.
- Faces intense competition in financial data with a premium valuation and higher beta risk.
FactSet Research Systems Inc.
- Operates with lower beta and more stable pricing but faces pressure from larger integrated platforms.
2. Capital Structure & Debt
MSCI Inc.
- Debt-to-assets ratio at 112.5% flags financial leverage risk despite strong interest coverage.
FactSet Research Systems Inc.
- Moderate debt levels with healthier ratios and stronger interest coverage reduce financial risk.
3. Stock Volatility
MSCI Inc.
- Beta of 1.28 indicates above-market volatility, heightening investment risk in turbulent markets.
FactSet Research Systems Inc.
- Beta of 0.73 signals below-market volatility, offering a more stable stock price profile.
4. Regulatory & Legal
MSCI Inc.
- Increasing ESG regulations raise compliance costs but align with MSCI’s ESG data focus.
FactSet Research Systems Inc.
- Faces standard financial data compliance risks but fewer ESG-specific regulatory pressures.
5. Supply Chain & Operations
MSCI Inc.
- Relies on data quality and tech infrastructure; operational disruptions pose moderate risk.
FactSet Research Systems Inc.
- Larger employee base and diversified platforms imply operational complexity but better resilience.
6. ESG & Climate Transition
MSCI Inc.
- Leader in ESG analytics; must manage transition risks while capitalizing on ESG demand.
FactSet Research Systems Inc.
- ESG initiatives growing but lag behind MSCI, risking competitiveness in climate-conscious markets.
7. Geopolitical Exposure
MSCI Inc.
- Global client base exposes MSCI to geopolitical tensions affecting cross-border data flows.
FactSet Research Systems Inc.
- International presence moderate; geopolitical risks exist but less pronounced than MSCI.
Which company shows a better risk-adjusted profile?
FactSet’s more conservative capital structure and lower stock volatility translate into a more favorable risk-adjusted profile. MSCI’s leverage and valuation amplify market and financial risks despite ESG leadership. FactSet’s Altman Z-Score (4.49) and Piotroski Score (6) confirm solid financial health but moderate operational complexity. MSCI’s Altman Z-Score (5.84) is excellent, yet its negative ROE and high debt-to-asset ratio raise red flags. The most impactful risk for MSCI is its excessive leverage, which could strain flexibility in downturns. For FactSet, competitive pressure amid evolving data demands and pricing challenges remains critical. Recent data show MSCI’s debt-to-assets at 112.5%, underscoring urgent balance sheet concerns that justify caution.
Final Verdict: Which stock to choose?
MSCI Inc. impresses with its superpower of sustainable value creation, driven by a very favorable economic moat and rising ROIC. Its aggressive capital allocation fuels growth despite a current liquidity point of vigilance. It fits well in aggressive growth portfolios seeking market leadership and innovation.
FactSet Research Systems boasts a strategic moat anchored in recurring revenue and solid profitability metrics. Its more balanced financial stability and favorable income growth offer a safer profile relative to MSCI. It suits investors targeting GARP strategies who value steady growth with moderate risk.
If you prioritize enduring competitive advantage and capital efficiency, MSCI outshines as the compelling choice due to its superior ROIC trend and robust income growth. However, if you seek better financial stability and a more conservative growth path, FactSet offers better stability and a resilient moat despite a declining ROIC trend.
Disclaimer: Investment carries a risk of loss of initial capital. The past performance is not a reliable indicator of future results. Be sure to understand risks before making an investment decision.
Go Further
I encourage you to read the complete analyses of MSCI Inc. and FactSet Research Systems Inc. to enhance your investment decisions: