Home > Comparison > Financial Services > ICE vs FDS
The strategic rivalry between Intercontinental Exchange, Inc. (ICE) and FactSet Research Systems Inc. (FDS) shapes the evolution of financial data and stock exchanges. ICE operates a capital-intensive network of regulated exchanges and clearinghouses, while FDS offers high-margin, integrated financial analytics and workflow solutions. This analysis pits ICE’s scale and infrastructure against FDS’s specialized data services to identify which trajectory delivers superior risk-adjusted returns for diversified portfolios.
Table of contents
Companies Overview
Intercontinental Exchange and FactSet Research Systems anchor critical segments of the financial data and analytics market.
Intercontinental Exchange, Inc.: Global Exchange and Clearing Powerhouse
Intercontinental Exchange dominates as a regulated exchange operator spanning commodities, equities, and fixed income markets. It generates revenue through trading venues, clearing houses, and listings across multiple global regions. In 2026, its strategic focus remains on expanding its mortgage technology platform and enhancing data and connectivity services to strengthen its multi-asset class ecosystem.
FactSet Research Systems Inc.: Premier Financial Data and Analytics Provider
FactSet Research Systems excels as a financial data and analytics specialist delivering integrated solutions for portfolio management, investment banking, and wealth advisory. Its core revenue derives from subscription-based analytics and workflow software tailored to global investment professionals. The company’s 2026 strategy prioritizes innovation in content and technology solutions to deepen its penetration across diverse financial service sectors.
Strategic Collision: Similarities & Divergences
Both firms leverage data-driven insights but diverge in business models; Intercontinental Exchange operates a closed marketplace ecosystem while FactSet focuses on open, integrated analytics platforms. Their primary battleground lies in serving institutional investors with timely, actionable financial intelligence. Intercontinental Exchange’s scale and clearing infrastructure contrast sharply with FactSet’s software and content innovation, shaping distinct risk and growth profiles for investors.
Income Statement Comparison
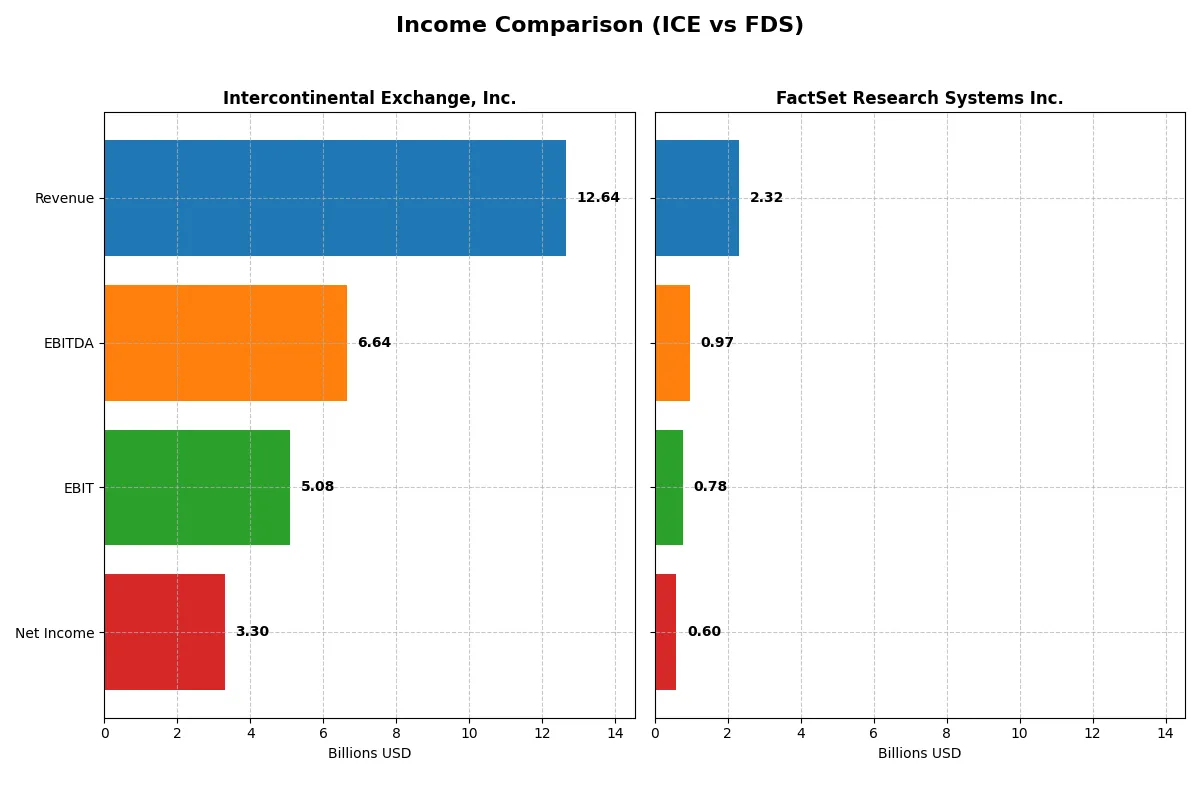
This data dissects the core profitability and scalability of both corporate engines to reveal who dominates the bottom line:
| Metric | Intercontinental Exchange, Inc. (ICE) | FactSet Research Systems Inc. (FDS) |
|---|---|---|
| Revenue | 12.6B | 2.32B |
| Cost of Revenue | 4.82B | 1.10B |
| Operating Expenses | 2.93B | 476M |
| Gross Profit | 7.82B | 1.22B |
| EBITDA | 6.64B | 966M |
| EBIT | 5.08B | 777M |
| Interest Expense | 781M | 56M |
| Net Income | 3.30B | 597M |
| EPS | 5.8 | 15.74 |
| Fiscal Year | 2025 | 2025 |
Income Statement Analysis: The Bottom-Line Duel
This income statement comparison reveals which company runs its business engine with superior efficiency and profitability.
Intercontinental Exchange, Inc. Analysis
Intercontinental Exchange (ICE) steadily grew revenue from 9.2B in 2021 to 12.6B in 2025, a 38% increase. Net income peaked in 2021 at 4.1B but declined to 3.3B in 2025. ICE maintains strong gross and net margins, 62% and 26% respectively in 2025, reflecting solid operational control despite higher operating expenses.
FactSet Research Systems Inc. Analysis
FactSet (FDS) expanded revenue from 1.6B in 2021 to 2.3B in 2025, a near 46% gain. Its net income rose consistently, reaching 597M in 2025 from 400M in 2021. Gross margin sits at 53%, net margin at 26%, signaling efficient expense management and steady margin improvement alongside moderate revenue growth.
Margin Strength vs. Sustainable Growth
ICE commands higher margins but shows net income and EPS declines over the period. FactSet delivers steadier net income growth and margin expansion, albeit at a smaller scale. FactSet’s growth profile and margin discipline offer a more consistent earnings trajectory, appealing to investors prioritizing sustainable profit increases over raw scale.
Financial Ratios Comparison
These vital ratios act as a diagnostic tool to expose the underlying fiscal health, valuation premiums, and capital efficiency of the companies compared below:
| Ratios | Intercontinental Exchange (ICE) | FactSet Research Systems (FDS) |
|---|---|---|
| ROE | 11.40% | 27.31% |
| ROIC | 7.02% | 16.10% |
| P/E | 28.00 | 23.71 |
| P/B | 3.19 | 6.48 |
| Current Ratio | 1.02 | 1.40 |
| Quick Ratio | 1.02 | 1.40 |
| D/E | 0.72 | 0.71 |
| Debt-to-Assets | 15.31% | 36.21% |
| Interest Coverage | 6.27 | 13.29 |
| Asset Turnover | 0.09 | 0.54 |
| Fixed Asset Turnover | 4.70 | 11.22 |
| Payout ratio | 33.44% | 26.79% |
| Dividend yield | 1.19% | 1.13% |
| Fiscal Year | 2025 | 2025 |
Efficiency & Valuation Duel: The Vital Signs
Financial ratios serve as a company’s DNA, unveiling hidden risks and operational strengths that raw numbers can obscure.
Intercontinental Exchange, Inc.
ICE posts a solid net margin of 26.14% but a modest ROE at 11.4%, signaling average profitability. Its P/E ratio of 28.0 marks the stock as expensive relative to earnings. Dividend yield stands at 1.19%, reflecting moderate shareholder returns amid neutral liquidity and debt metrics.
FactSet Research Systems Inc.
FDS delivers robust profitability with a 27.31% ROE and a 25.72% net margin, showcasing operational efficiency. The P/E of 23.71 is more reasonable than ICE’s, though its P/B ratio appears stretched at 6.48. It returns value via a 1.13% dividend while maintaining strong interest coverage and favorable capital efficiency.
Valuation Stretch vs. Profitability Edge
FactSet offers superior returns on equity and capital employed at a lower P/E, suggesting better operational efficiency despite a higher P/B. ICE’s valuation appears more expensive with average profitability. Investors prioritizing efficient capital use may prefer FactSet, while those favoring stability might lean toward ICE.
Which one offers the Superior Shareholder Reward?
I compare Intercontinental Exchange (ICE) and FactSet Research Systems (FDS) on dividends, payout ratios, and buybacks. ICE yields 1.2% with a 33% payout ratio and covers dividends comfortably via free cash flow (FCF). FDS yields 1.13% with a 27% payout ratio, also well-covered by FCF. Both pursue buybacks, but ICE’s buyback intensity is less visible here, while FDS maintains steady buybacks as part of capital return. ICE’s distribution is more balanced between dividends and reinvestment, enhancing sustainability during market cycles. FDS’s higher leverage and aggressive buybacks pose moderate risk. I find ICE offers a more sustainable, attractive total return profile for 2026 investors.
Comparative Score Analysis: The Strategic Profile
The radar chart reveals the fundamental DNA and trade-offs of both firms, highlighting their financial strengths and valuation nuances:
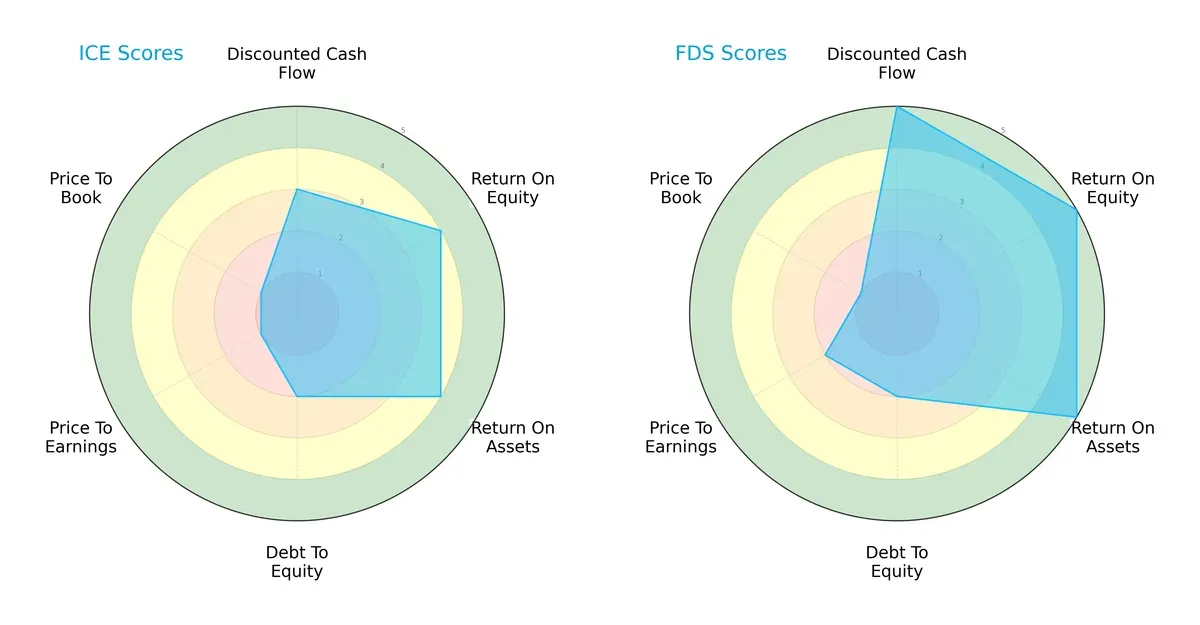
FactSet Research Systems Inc. (FDS) leads with superior DCF, ROE, and ROA scores, reflecting robust profitability and asset efficiency. Intercontinental Exchange, Inc. (ICE) shows a more balanced approach in profitability but struggles with its valuation metrics (P/E and P/B). Both share a weak debt-to-equity profile, but FDS’s higher overall score signals a stronger strategic position.
Bankruptcy Risk: Solvency Showdown
The Altman Z-Score gap signals a stark contrast in financial resilience:
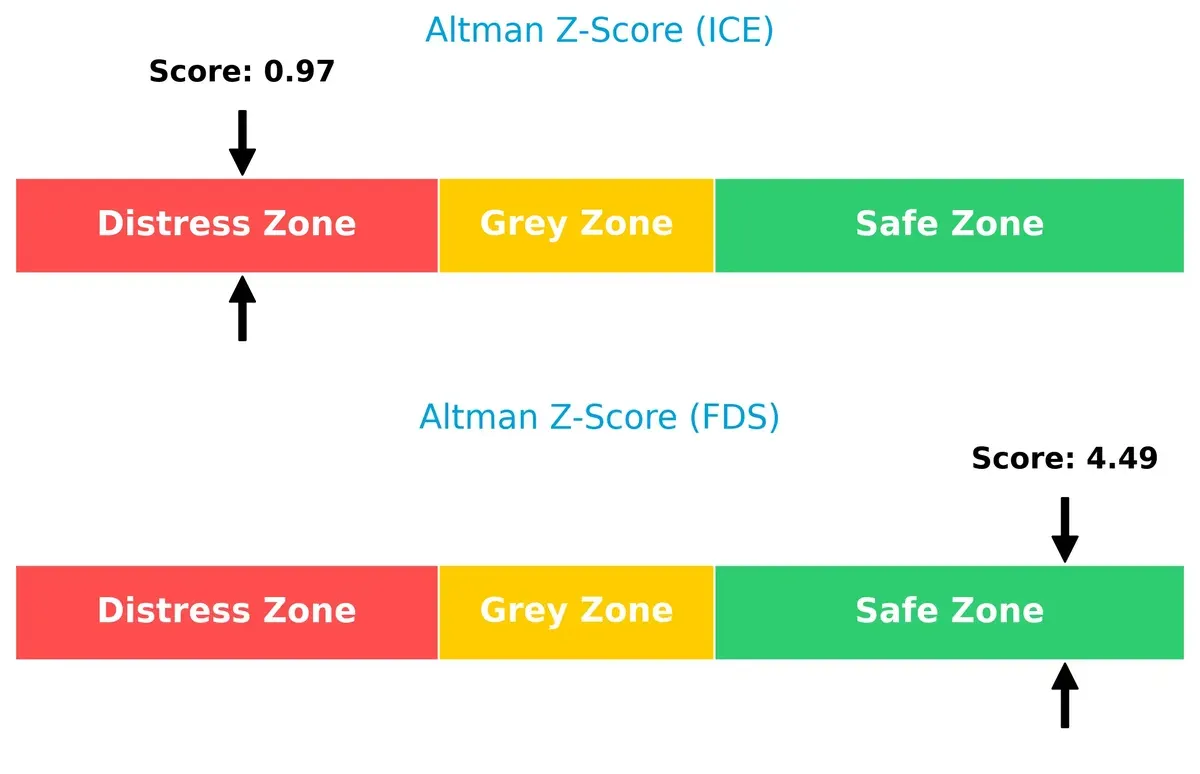
FDS’s score of 4.49 firmly places it in the safe zone, indicating strong bankruptcy protection. ICE’s 0.97, deep in the distress zone, raises red flags about its long-term solvency under current market pressures.
Financial Health: Quality of Operations
Piotroski F-Scores shed light on internal operational strength and risk:
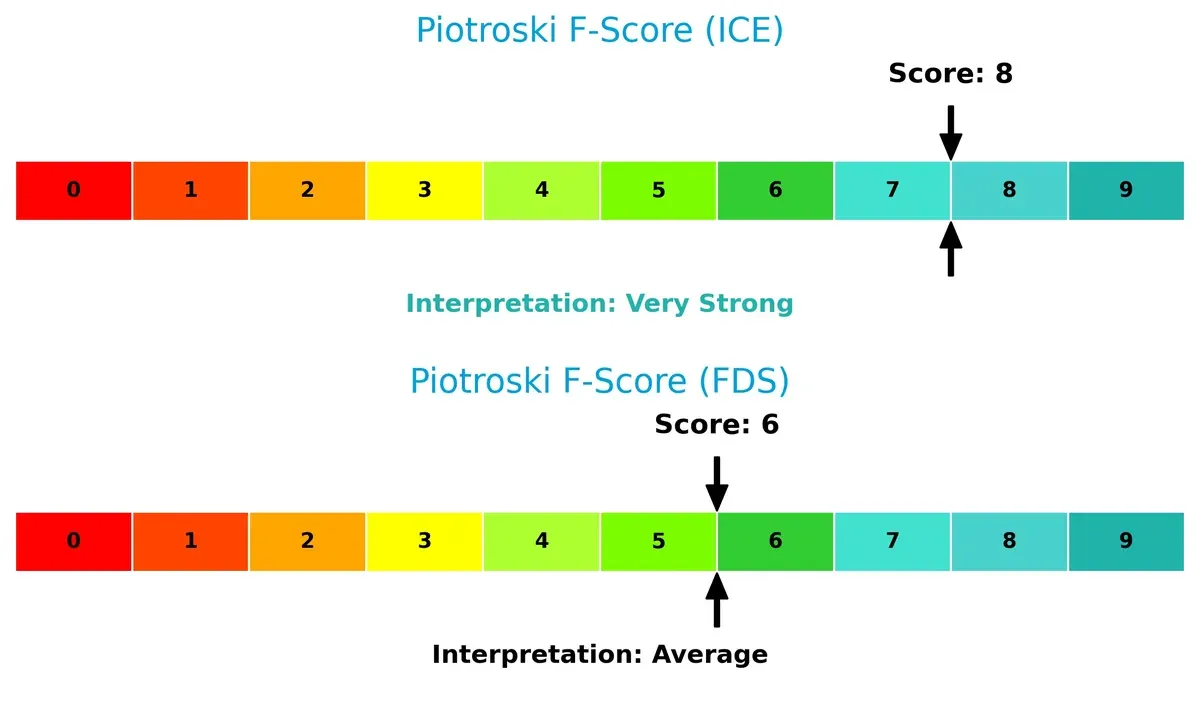
ICE’s high score of 8 signals very strong financial health, showcasing superior operational quality despite solvency concerns. FDS’s 6 reflects average internal metrics, suggesting room for improvement despite its safer financial footing. This divergence highlights differing risk and quality profiles investors must weigh carefully.
How are the two companies positioned?
This section dissects ICE and FDS’s operational DNA by comparing revenue distribution by segment and internal strengths and weaknesses. The final objective is to confront their economic moats and identify which business model delivers the most resilient, sustainable competitive advantage today.
Revenue Segmentation: The Strategic Mix
This visual comparison dissects how Intercontinental Exchange and FactSet diversify their income streams and where their primary sector bets lie:
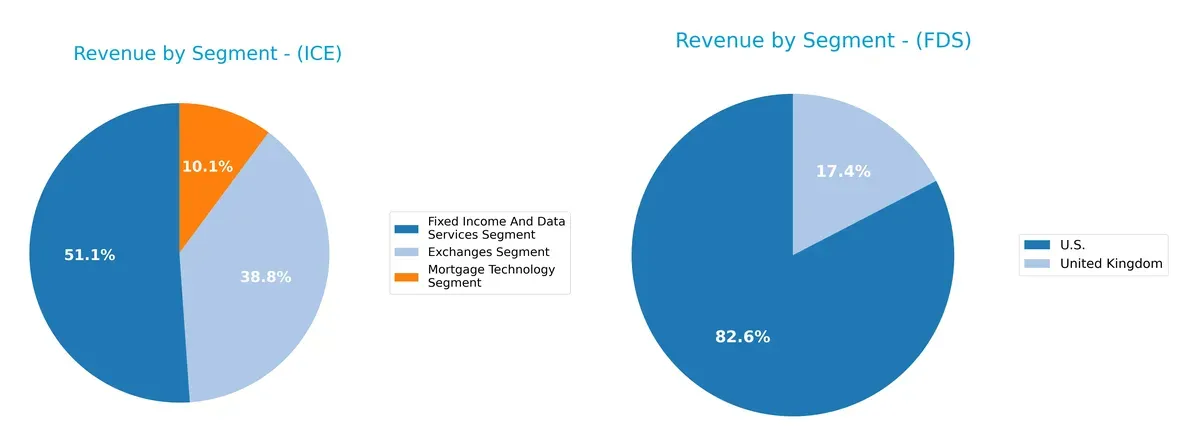
Intercontinental Exchange anchors revenue in Fixed Income and Data Services at $1.36B and Exchanges at $1.03B, with Mortgage Technology as a smaller $269M slice. FactSet’s limited data shows focus on geographic segments rather than product lines, with $498M from the U.S. and $105M from the UK. ICE’s mix reveals ecosystem lock-in across trading and data infrastructure, while FactSet’s narrower footprint suggests higher concentration risk.
Strengths and Weaknesses Comparison
This table compares the strengths and weaknesses of Intercontinental Exchange (ICE) and FactSet Research Systems (FDS):
ICE Strengths
- Diversified revenue from Exchanges, Fixed Income, and Mortgage Technology segments
- Favorable net margin at 26.14%
- Low debt-to-assets ratio at 15.31%
- Strong interest coverage at 6.51x
- Favorable quick ratio at 1.02
- Significant US and Europe presence with $6.3B US revenue
FDS Strengths
- Higher profitability with ROE 27.31% and ROIC 16.1%
- Favorable net margin at 25.72%
- Favorable WACC at 6.53%
- Strong interest coverage at 13.8x
- Favorable quick ratio at 1.4
- Solid US and Europe revenue base with $1.4B US revenue
ICE Weaknesses
- Unfavorable P/E at 28.0 and P/B at 3.19
- Neutral ROE and ROIC near WACC
- Low asset turnover at 0.09
- Moderate current ratio at 1.02
- Higher percentage of neutral financial metrics (36%)
FDS Weaknesses
- Unfavorable P/B at 6.48
- Neutral current ratio at 1.4
- Debt-to-assets ratio higher at 36.21%
- Asset turnover neutral at 0.54
- Higher valuation multiples relative to some peers
Both companies exhibit slightly favorable financial profiles but face valuation and efficiency challenges. ICE’s diversified segments and conservative leverage contrast with FDS’s superior profitability but higher valuation and leverage risks. These factors shape each company’s strategic priorities in operational efficiency and capital management.
The Moat Duel: Analyzing Competitive Defensibility
A structural moat is the only reliable barrier protecting long-term profits from relentless competitive pressure:
Intercontinental Exchange, Inc. (ICE): Regulatory Network and Market Access Moat
ICE’s primary advantage lies in its regulated exchanges and clearinghouses, which create high switching costs and regulatory barriers. Its 40% EBIT margin reflects strong margin stability. Expansion into mortgage technology in 2026 could deepen its moat but also attract new regulatory scrutiny.
FactSet Research Systems Inc. (FDS): Intangible Asset and Data Integration Moat
FactSet’s moat stems from proprietary financial data and integrated analytics platforms, contrasting ICE’s physical infrastructure. It sustains a solid 33.5% EBIT margin while creating value with a 9.6% ROIC premium to WACC. However, a declining ROIC trend warns of margin pressure amid rising competition in data services.
Market Infrastructure vs. Data Intelligence: Which Moat Runs Deeper?
ICE’s regulatory network moat is harder to replicate but currently sheds value despite rising profitability. FactSet creates clear value with efficient capital use but faces profitability erosion. I see FactSet’s moat as deeper due to consistent value creation, making it better positioned to defend market share long term.
Which stock offers better returns?
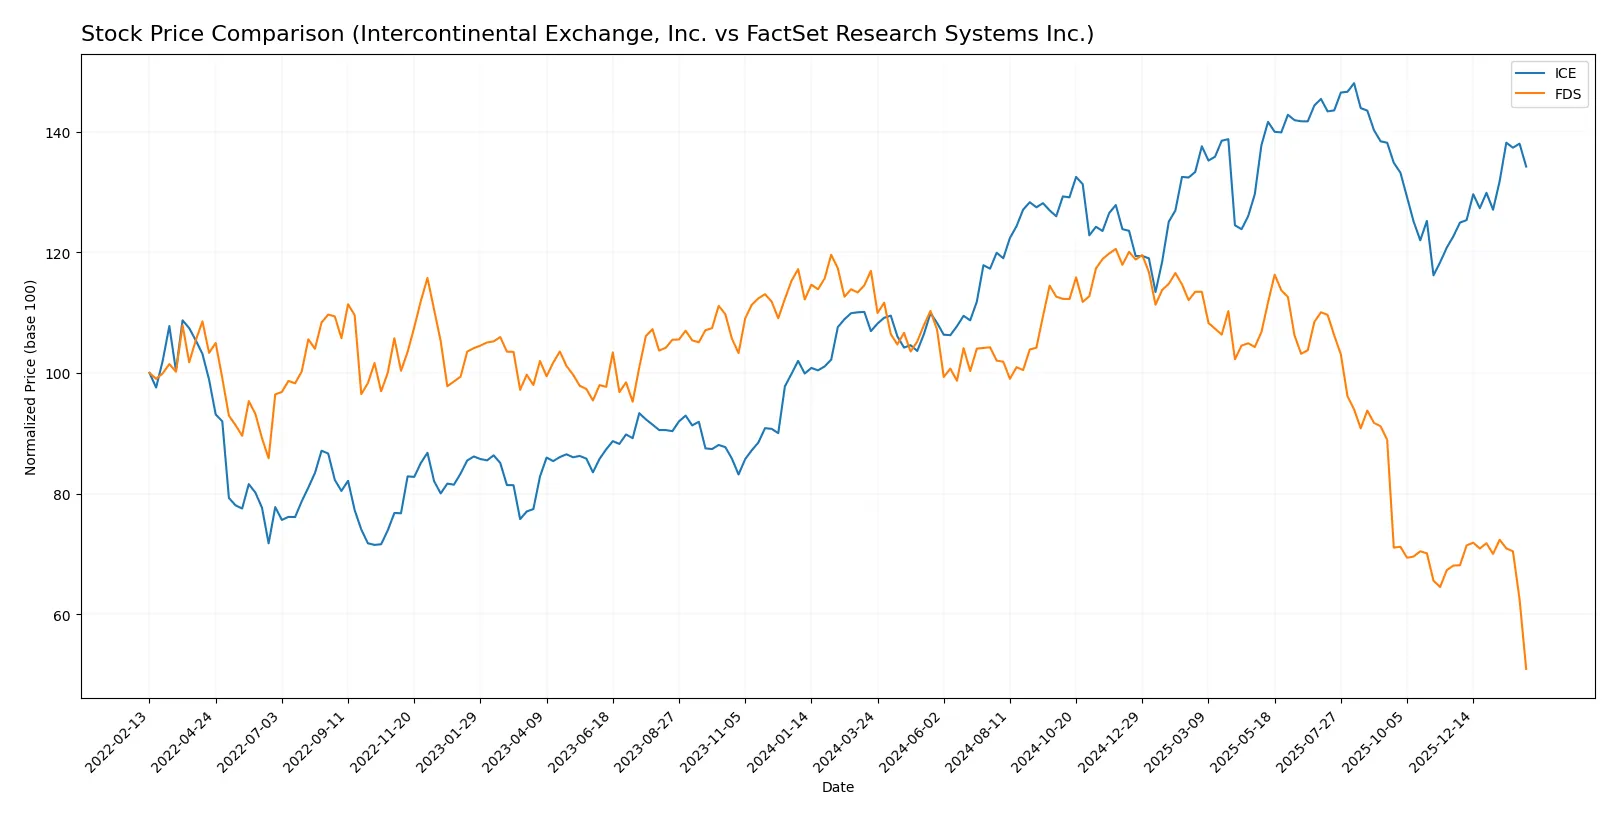
Over the past year, Intercontinental Exchange shows a strong upward momentum with accelerating gains, while FactSet Research Systems experiences a steep decline and decelerating losses.
Trend Comparison
Intercontinental Exchange’s stock gained 25.52% over the past 12 months, marking a bullish trend with accelerating momentum and a high near 186.4, supported by moderate volatility of 14.83%.
FactSet Research Systems’ stock fell 56.44% in the same period, reflecting a bearish trend with deceleration and extreme volatility of 70.83%, hitting a low near 207.3.
Intercontinental Exchange outperformed FactSet Research Systems, delivering the highest market returns with consistent buyer dominance and accelerating price gains.
Target Prices
Analysts show a bullish consensus for both Intercontinental Exchange and FactSet Research Systems.
| Company | Target Low | Target High | Consensus |
|---|---|---|---|
| Intercontinental Exchange, Inc. | 180 | 211 | 192.33 |
| FactSet Research Systems Inc. | 215 | 321 | 287.89 |
The targets for ICE suggest a 13.7% upside from its $169 current price, reflecting confidence in its diversified exchanges. FactSet’s targets imply a 39% upside, signaling strong growth expectations despite its current $207 price.

Don’t Let Luck Decide Your Entry Point
Optimize your entry points with our advanced ProRealTime indicators. You’ll get efficient buy signals with precise price targets for maximum performance. Start outperforming now!
How do institutions grade them?
Here is a detailed comparison of the institutional grades assigned to both companies:
Intercontinental Exchange, Inc. Grades
The following table details recent grades from reputable financial institutions for Intercontinental Exchange, Inc.:
| Grading Company | Action | New Grade | Date |
|---|---|---|---|
| Barclays | Maintain | Overweight | 2026-02-06 |
| Morgan Stanley | Maintain | Equal Weight | 2026-01-15 |
| Piper Sandler | Maintain | Overweight | 2026-01-14 |
| TD Cowen | Maintain | Buy | 2026-01-14 |
| Barclays | Maintain | Overweight | 2026-01-08 |
| UBS | Maintain | Buy | 2026-01-07 |
| Morgan Stanley | Maintain | Equal Weight | 2025-12-22 |
| UBS | Maintain | Buy | 2025-10-31 |
| JP Morgan | Maintain | Overweight | 2025-10-31 |
| Barclays | Maintain | Overweight | 2025-10-31 |
FactSet Research Systems Inc. Grades
The following table outlines recent grades from recognized financial firms for FactSet Research Systems Inc.:
| Grading Company | Action | New Grade | Date |
|---|---|---|---|
| Wells Fargo | Maintain | Underweight | 2026-02-04 |
| Wells Fargo | Maintain | Underweight | 2026-01-14 |
| Evercore ISI Group | Maintain | In Line | 2026-01-08 |
| BMO Capital | Maintain | Market Perform | 2025-12-22 |
| Stifel | Maintain | Hold | 2025-12-19 |
| Goldman Sachs | Maintain | Sell | 2025-12-19 |
| RBC Capital | Maintain | Sector Perform | 2025-12-19 |
| Morgan Stanley | Upgrade | Equal Weight | 2025-12-17 |
| Wells Fargo | Maintain | Underweight | 2025-12-05 |
| UBS | Upgrade | Buy | 2025-09-22 |
Which company has the best grades?
Intercontinental Exchange, Inc. consistently receives strong grades such as “Buy” and “Overweight” from top-tier firms. FactSet Research Systems Inc. shows more cautious ratings, frequently “Underweight” or “Hold.” This contrast suggests ICE has a more favorable institutional outlook, which could influence investor confidence and valuation positively.
Risks specific to each company
The following categories identify the critical pressure points and systemic threats facing both firms in the 2026 market environment:
1. Market & Competition
Intercontinental Exchange, Inc. (ICE)
- Faces intense competition in exchanges and data services, pressured by technological innovation and regulatory changes.
FactSet Research Systems Inc. (FDS)
- Competes in a crowded financial data and analytics space with constant demand for cutting-edge technology and client retention.
2. Capital Structure & Debt
Intercontinental Exchange, Inc. (ICE)
- Maintains moderate leverage with a debt-to-assets ratio of 15.31%, interest coverage stable at 6.51x.
FactSet Research Systems Inc. (FDS)
- Higher leverage with 36.21% debt-to-assets but stronger interest coverage at 13.8x, indicating manageable debt service.
3. Stock Volatility
Intercontinental Exchange, Inc. (ICE)
- Beta near 1.03 suggests market-level volatility; price range relatively tight between 143.17 and 189.35 USD.
FactSet Research Systems Inc. (FDS)
- Lower beta at 0.73 implies less volatility; wider price range from 201.8 to 474.79 USD indicates episodic swings.
4. Regulatory & Legal
Intercontinental Exchange, Inc. (ICE)
- Subject to stringent financial market regulations across multiple jurisdictions, increasing compliance costs and legal risks.
FactSet Research Systems Inc. (FDS)
- Faces regulatory scrutiny mainly on data protection and financial reporting standards; less exposure to exchange regulations.
5. Supply Chain & Operations
Intercontinental Exchange, Inc. (ICE)
- Operational risk from technology infrastructure and integration of mortgage tech platform; supply chain impact limited.
FactSet Research Systems Inc. (FDS)
- Relies heavily on data sourcing and software delivery; operational efficiency critical but less exposed to physical supply chains.
6. ESG & Climate Transition
Intercontinental Exchange, Inc. (ICE)
- Increasing pressure to enhance ESG disclosures and reduce carbon footprint linked to data centers and commodity markets.
FactSet Research Systems Inc. (FDS)
- ESG focus on sustainable data practices and social governance; faces investor demand for proactive climate-related risk management.
7. Geopolitical Exposure
Intercontinental Exchange, Inc. (ICE)
- Global footprint across US, UK, EU, and Asia exposes it to trade tensions and regulatory divergence.
FactSet Research Systems Inc. (FDS)
- More concentrated in Americas and Europe, with moderate geopolitical risk but less global operational complexity.
Which company shows a better risk-adjusted profile?
FactSet’s strongest risk is its high debt-to-assets ratio, which elevates financial risk despite robust interest coverage. ICE confronts significant regulatory and geopolitical challenges due to its broad exchange operations. FactSet’s superior Altman Z-Score (4.49 vs. ICE’s 0.97) signals a safer financial position. However, ICE’s very strong Piotroski Score (8) reflects operational resilience. Overall, FactSet offers a better risk-adjusted profile, supported by its safe-zone bankruptcy risk and diversified product demand, despite elevated leverage concerns.
Final Verdict: Which stock to choose?
Intercontinental Exchange, Inc. (ICE) demonstrates a superpower in driving steady operational cash flow with a growing ROIC trend, signaling improving profitability despite currently shedding value. Its modest liquidity and moderate leverage call for caution. ICE suits investors seeking aggressive growth with a tolerance for transitional value creation.
FactSet Research Systems Inc. (FDS) boasts a robust strategic moat through high ROIC comfortably exceeding its cost of capital, reflecting efficient capital allocation and solid recurring revenue streams. Relative to ICE, FDS offers stronger financial stability but faces a declining ROIC trend. It fits well within a GARP portfolio focused on balanced growth and reasonable valuation.
If you prioritize dynamic growth potential amid an evolving profitability landscape, ICE is the compelling choice due to its accelerating cash flow and improving returns. However, if you seek greater stability and proven value creation, FDS offers better financial resilience despite its waning profitability momentum. Both stocks present distinct analytical scenarios aligned with different investor profiles.
Disclaimer: Investment carries a risk of loss of initial capital. The past performance is not a reliable indicator of future results. Be sure to understand risks before making an investment decision.
Go Further
I encourage you to read the complete analyses of Intercontinental Exchange, Inc. and FactSet Research Systems Inc. to enhance your investment decisions: