Home > Comparison > Technology > TDY vs FN
The strategic rivalry between Teledyne Technologies Incorporated and Fabrinet shapes key dynamics in the Technology sector. Teledyne operates as a diversified industrial technology conglomerate with a focus on instrumentation and aerospace electronics. Fabrinet specializes in precision optical and electro-mechanical manufacturing services, targeting high-tech communications and medical markets. This analysis will assess which company’s distinct operational model offers superior risk-adjusted returns for a diversified portfolio amid evolving sector demands.

Table of contents
Companies Overview
Teledyne Technologies and Fabrinet both stand as key players in the global hardware and equipment sector.
Teledyne Technologies Incorporated: Industrial Innovation Leader
Teledyne Technologies dominates with enabling technologies across industrial growth markets. Its revenue stems from specialized instrumentation, digital imaging, aerospace, defense electronics, and engineered systems. In 2026, Teledyne sharpens its edge by integrating advanced sensor networks and electrochemical energy systems, reinforcing its technological moat in mission-critical applications.
Fabrinet: Precision Optical Manufacturing Specialist
Fabrinet excels in optical packaging and precision manufacturing services. It generates income by delivering advanced optical and electro-mechanical components, including lasers and sensors, to diverse industries like telecommunications and medical devices. The company’s 2026 strategy prioritizes process innovation and supply chain optimization to meet growing demand for complex optical solutions globally.
Strategic Collision: Similarities & Divergences
Both firms operate in hardware and equipment but diverge in focus—Teledyne builds integrated systems with a broad industrial footprint, while Fabrinet specializes in complex optical manufacturing. Their primary battleground lies in supplying high-tech components for communications and defense sectors. Investors face distinct profiles: Teledyne’s diversified technology platform contrasts with Fabrinet’s niche precision manufacturing expertise.
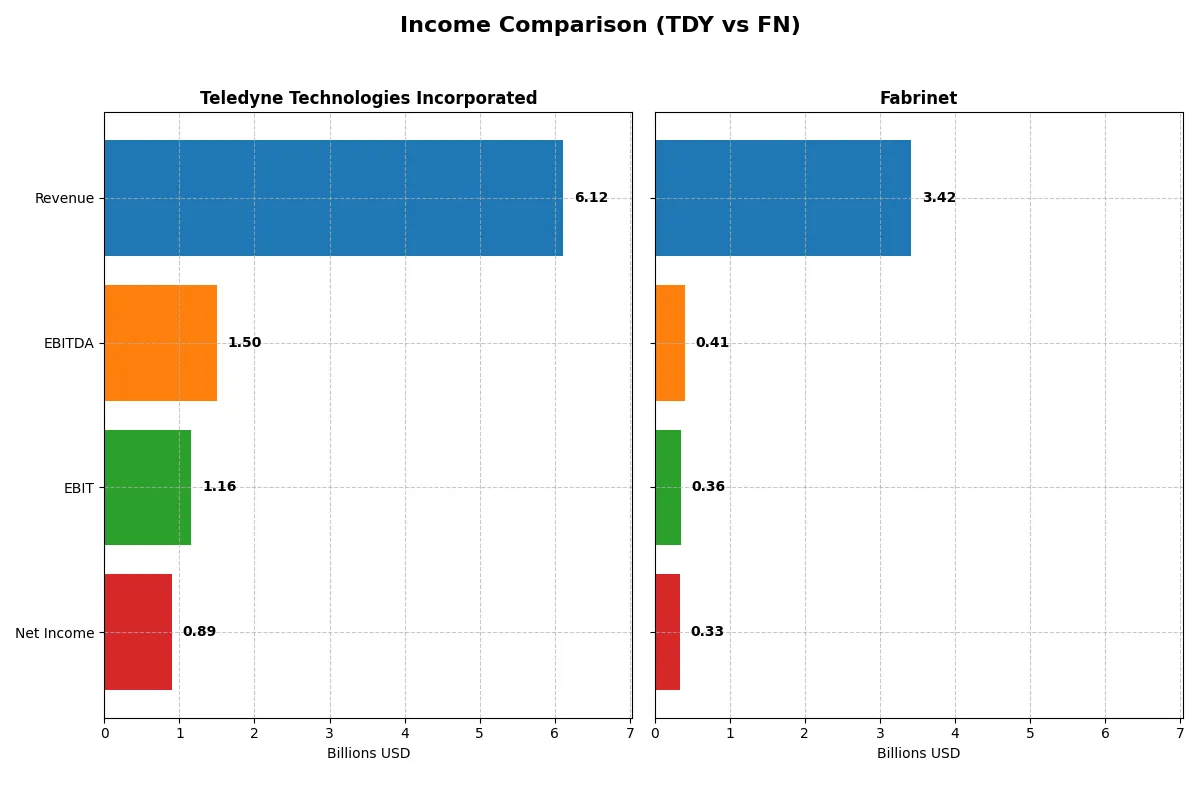
Income Statement Comparison
This data dissects the core profitability and scalability of both corporate engines to reveal who dominates the bottom line:
| Metric | Teledyne Technologies Incorporated (TDY) | Fabrinet (FN) |
|---|---|---|
| Revenue | 6.12B | 3.42B |
| Cost of Revenue | 3.72B | 3.01B |
| Operating Expenses | 1.25B | 89M |
| Gross Profit | 2.40B | 413M |
| EBITDA | 1.50B | 409M |
| EBIT | 1.16B | 355M |
| Interest Expense | 60M | 0 |
| Net Income | 895M | 333M |
| EPS | 18.88 | 9.23 |
| Fiscal Year | 2025 | 2025 |
Income Statement Analysis: The Bottom-Line Duel
This income statement comparison reveals which company runs a more efficient and profitable business engine in the current market environment.
Teledyne Technologies Incorporated Analysis
Teledyne’s revenue grew steadily from 4.6B in 2021 to 6.1B in 2025, with net income doubling from 445M to 895M. The company maintains strong gross margins near 39% and net margins around 14.6%, reflecting robust operational control. In 2025, Teledyne’s EBIT margin rose to 19%, signaling improved efficiency and solid momentum despite a slight dip in gross profit growth.
Fabrinet Analysis
Fabrinet’s revenue surged from 1.9B in 2021 to 3.4B in 2025, marking an impressive 82% growth over the period. Net income more than doubled to 333M, supported by consistent EBIT margins around 10.4% and net margins close to 9.7%. The 2025 results show substantial momentum, with 18.6% revenue growth and a healthy 13% EPS increase, despite a modest decline in net margin last year.
Margin Strength vs. Growth Velocity
Teledyne leads on margin strength, delivering nearly double the net margin of Fabrinet and showing solid profitability improvements. Fabrinet excels in top-line momentum, nearly doubling revenue faster but at thinner margins. For investors, Teledyne’s profile suits those valuing margin resilience, while Fabrinet appeals to growth-focused portfolios seeking rapid expansion.
Financial Ratios Comparison
These vital ratios act as a diagnostic tool to expose the underlying fiscal health, valuation premiums, and capital efficiency of Teledyne Technologies Incorporated (TDY) and Fabrinet (FN):
| Ratios | Teledyne Technologies (TDY) | Fabrinet (FN) |
|---|---|---|
| ROE | 8.51% | 16.78% |
| ROIC | 6.78% | 15.01% |
| P/E | 27.35 | 32.02 |
| P/B | 2.33 | 5.37 |
| Current Ratio | 1.64 | 3.00 |
| Quick Ratio | 1.08 | 2.28 |
| D/E | 0.24 | 0.00 |
| Debt-to-Assets | 16.2% | 0.2% |
| Interest Coverage | 19.29 | 0 |
| Asset Turnover | 0.40 | 1.21 |
| Fixed Asset Turnover | 7.29 | 8.85 |
| Payout Ratio | 0 | 0 |
| Dividend Yield | 0 | 0 |
| Fiscal Year | 2025 | 2025 |
Efficiency & Valuation Duel: The Vital Signs
Financial ratios serve as a company’s DNA, revealing hidden risks and operational strengths essential for informed investment decisions.
Teledyne Technologies Incorporated
Teledyne posts a moderate ROE of 8.5% with a favorable net margin of 14.6%, indicating solid profitability but below sector leaders. The stock trades at a stretched P/E of 27.3 and a neutral P/B of 2.33, signaling modest valuation concerns. It does not pay dividends, instead reinvesting in R&D (5.2% of revenue) to fuel future growth.
Fabrinet
Fabrinet exhibits a strong ROE of 16.8% and a solid ROIC of 15%, reflecting efficient capital use and robust profitability. Despite a high P/E of 32 and an expensive P/B of 5.37, the company maintains excellent liquidity and zero debt. Like Teledyne, Fabrinet foregoes dividends, focusing on operational expansion and innovation.
Operating Efficiency vs. Valuation Premium
Fabrinet delivers superior profitability and capital efficiency with a more favorable liquidity profile, albeit at a higher valuation multiple. Teledyne offers a more balanced risk profile with moderate returns and disciplined reinvestment. Investors seeking growth with operational efficiency may prefer Fabrinet, while those favoring stability and moderate valuation might lean toward Teledyne.
Which one offers the Superior Shareholder Reward?
Teledyne Technologies (TDY) and Fabrinet (FN) both avoid dividends, focusing on reinvestment and buybacks. TDY shows no dividend yield or payout but generates strong free cash flow (22.7/share in 2025) and maintains a robust buyback program. FN also pays no dividends but reinvests heavily in capex (3.4/share) with lower free cash flow (5.7/share). TDY’s buybacks are more intense and sustainable, supported by higher operating margins (~19% EBIT vs. FN’s ~10%) and solid cash flow coverage. FN’s capital-light model and low debt offer stability but limit buyback scale. I find TDY’s balanced distribution model superior for total shareholder return in 2026.
Comparative Score Analysis: The Strategic Profile
The radar chart reveals the fundamental DNA and trade-offs of Teledyne Technologies Incorporated and Fabrinet, highlighting their financial strengths and valuation nuances:
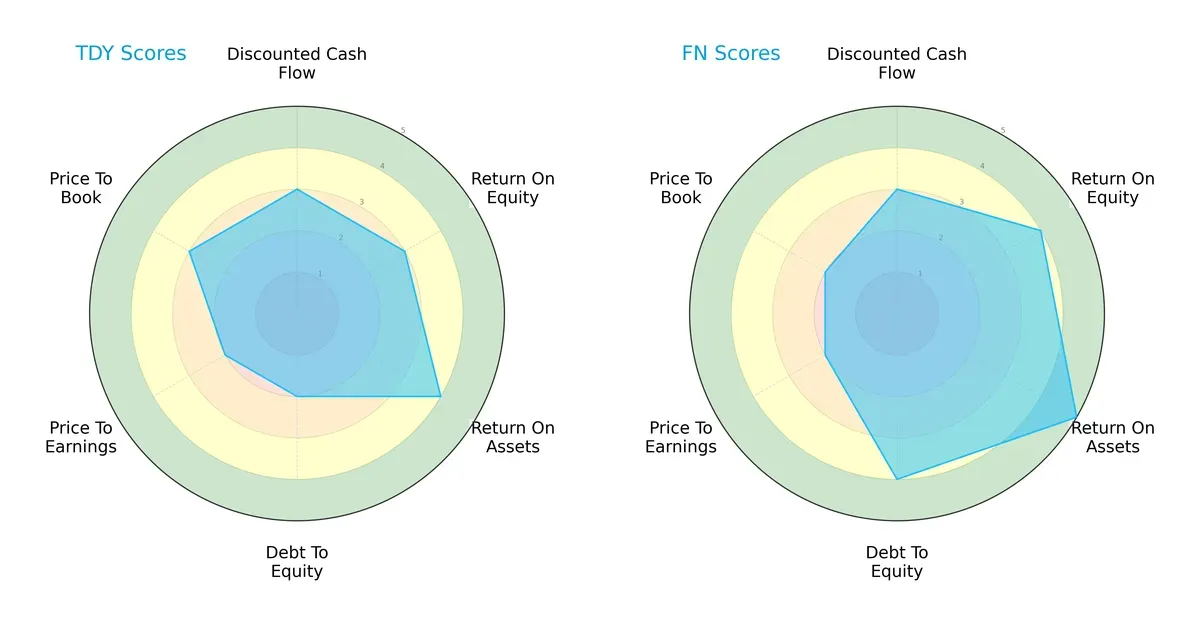
Fabrinet excels with higher overall, ROE (4 vs. 3), and ROA (5 vs. 4) scores, showcasing superior profitability and asset utilization. Teledyne lags in debt management (2 vs. 4) and valuation metrics, indicating more leverage and moderate pricing. Fabrinet’s profile is more balanced, while Teledyne relies on a moderate operational edge with heavier debt risk.
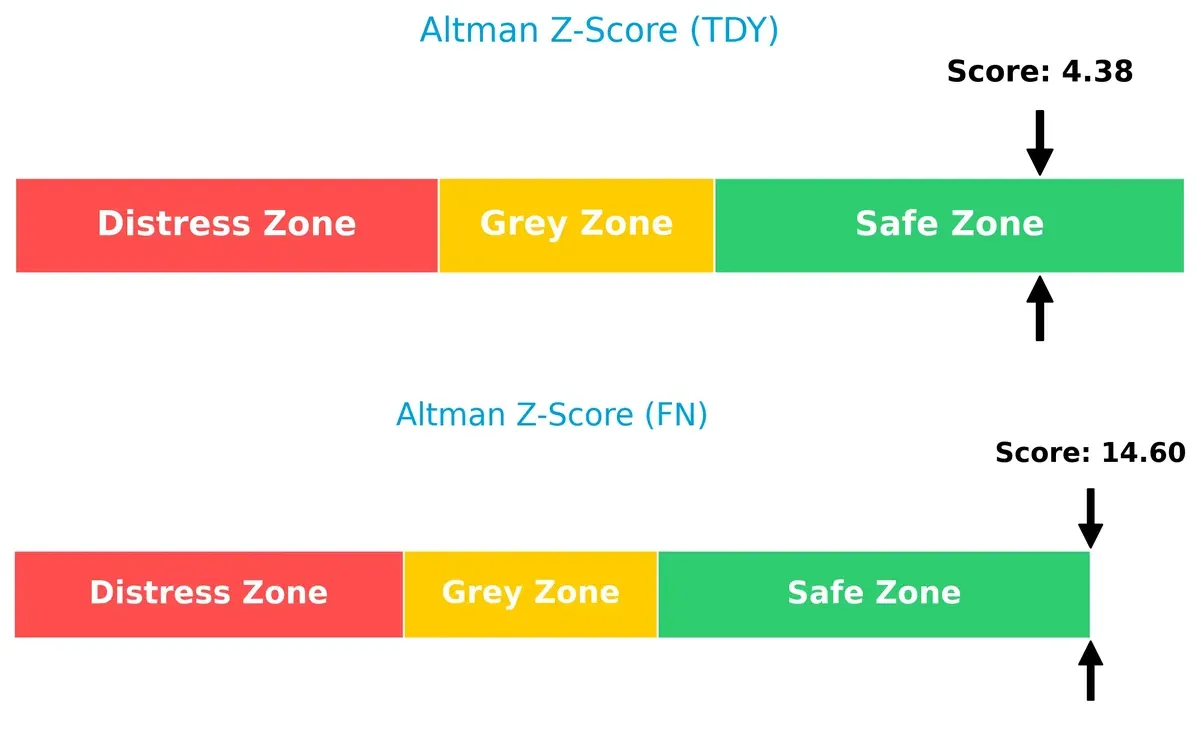
Bankruptcy Risk: Solvency Showdown
Fabrinet’s Altman Z-Score (14.6) far exceeds Teledyne’s (4.4), signaling a stronger solvency buffer and lower bankruptcy risk in this economic cycle:
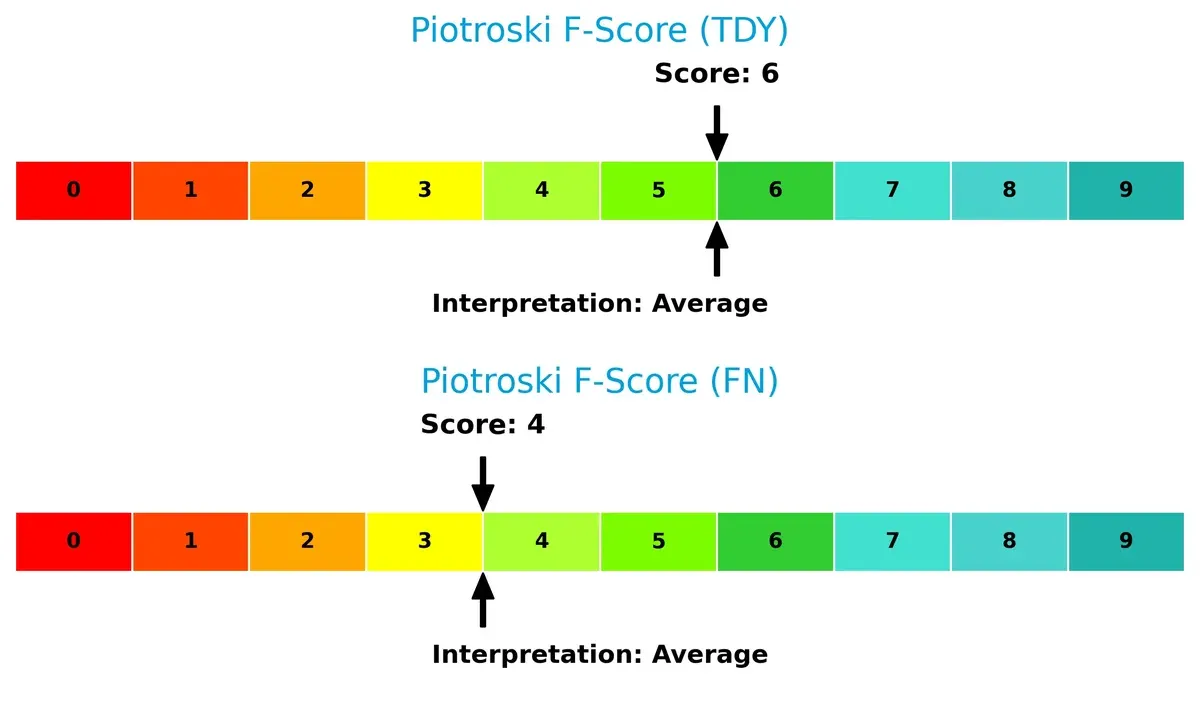
Financial Health: Quality of Operations
Teledyne scores a 6 on the Piotroski F-Score, outperforming Fabrinet’s 4, suggesting better internal financial quality and fewer red flags in operational metrics:
How are the two companies positioned?
This section dissects TDY and FN’s operational DNA by comparing their revenue distribution and internal dynamics. The goal is to confront their economic moats and identify which model offers the most resilient competitive advantage today.
Revenue Segmentation: The Strategic Mix
This comparison dissects how Teledyne Technologies and Fabrinet diversify their income streams and reveals their primary sector bets:
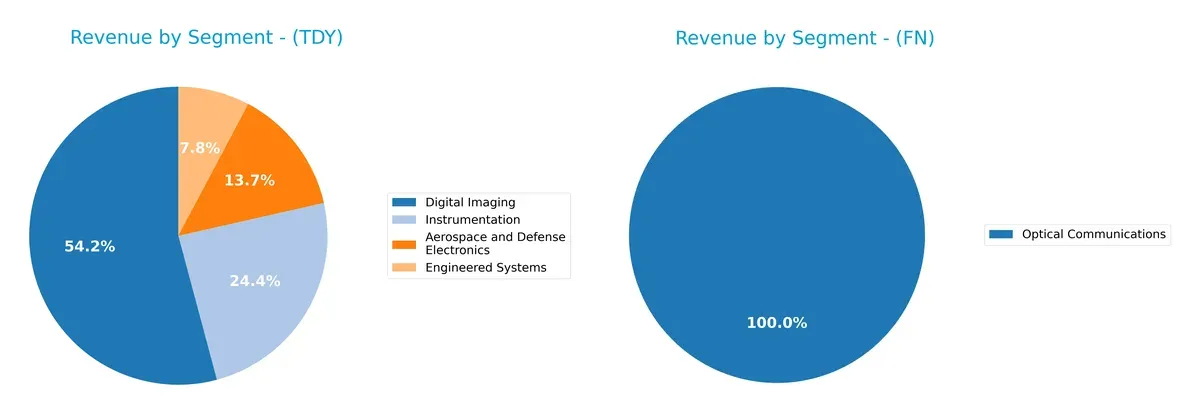
Teledyne anchors revenue in Digital Imaging at $3.07B, supplemented by strong Instrumentation ($1.38B), Aerospace and Defense Electronics ($777M), and Engineered Systems ($440M). This mix reflects a balanced portfolio reducing concentration risk. Fabrinet, however, pivots heavily on Optical Communications, generating $2.62B in 2025, dwarfing its smaller “Lasers, Sensors, And Other” segment. Fabrinet’s reliance on one dominant segment signals both focused expertise and vulnerability to sector shifts.
Strengths and Weaknesses Comparison
This table compares the strengths and weaknesses of Teledyne Technologies Incorporated (TDY) and Fabrinet (FN):
TDY Strengths
- Diverse revenue streams across Aerospace, Digital Imaging, Engineered Systems, Instrumentation
- Strong global presence with significant US and European sales
- Favorable liquidity and leverage ratios
- High fixed asset turnover
FN Strengths
- Focused on Optical Communications with growing product segments
- Favorable profitability metrics including ROE and ROIC
- Strong liquidity and zero debt profile
- Higher asset turnover and global reach, especially in Asia Pacific and North America
TDY Weaknesses
- Low ROE below WACC indicating weak capital efficiency
- High P/E ratio suggests valuation risk
- Unfavorable asset turnover
- No dividend yield
FN Weaknesses
- Elevated P/E and P/B ratios imply premium valuation
- Limited product diversification centered on optical communications
- No dividend yield
Overall, TDY benefits from broad diversification and strong balance sheet metrics but faces challenges in capital efficiency and valuation. FN shows superior profitability and asset utilization but carries valuation premiums and less product variety. These factors shape each company’s strategic positioning within their sectors.
The Moat Duel: Analyzing Competitive Defensibility
A structural moat is the sole shield preserving long-term profits from competitive erosion. Let’s dissect the moats of two industry players:
Teledyne Technologies Incorporated: Diversified Technological Integration Moat
Teledyne leverages intangible assets and high-tech integration, reflected in stable 19% EBIT margins. Its expanding aerospace and defense segments could reinforce this moat by 2026.
Fabrinet: Precision Manufacturing Scale and Customer Lock-in Moat
Unlike Teledyne, Fabrinet’s moat hinges on scale-driven cost advantages and complex manufacturing processes. Its 10% EBIT margin and robust revenue growth fuel a widening moat, with optical markets opening fresh expansion avenues.
Verdict: Integration Depth vs. Manufacturing Scale Efficiency
Teledyne’s moat is broader but currently sheds value, despite a rising ROIC trend. Fabrinet’s narrower yet deeper moat creates consistent value with a ROIC well above WACC. Fabrinet stands better positioned to defend and grow market share in 2026.
Which stock offers better returns?
Over the past year, Teledyne Technologies and Fabrinet both experienced strong price appreciation with accelerating bullish trends and notable highs, reflecting dynamic trading patterns and increasing investor interest.
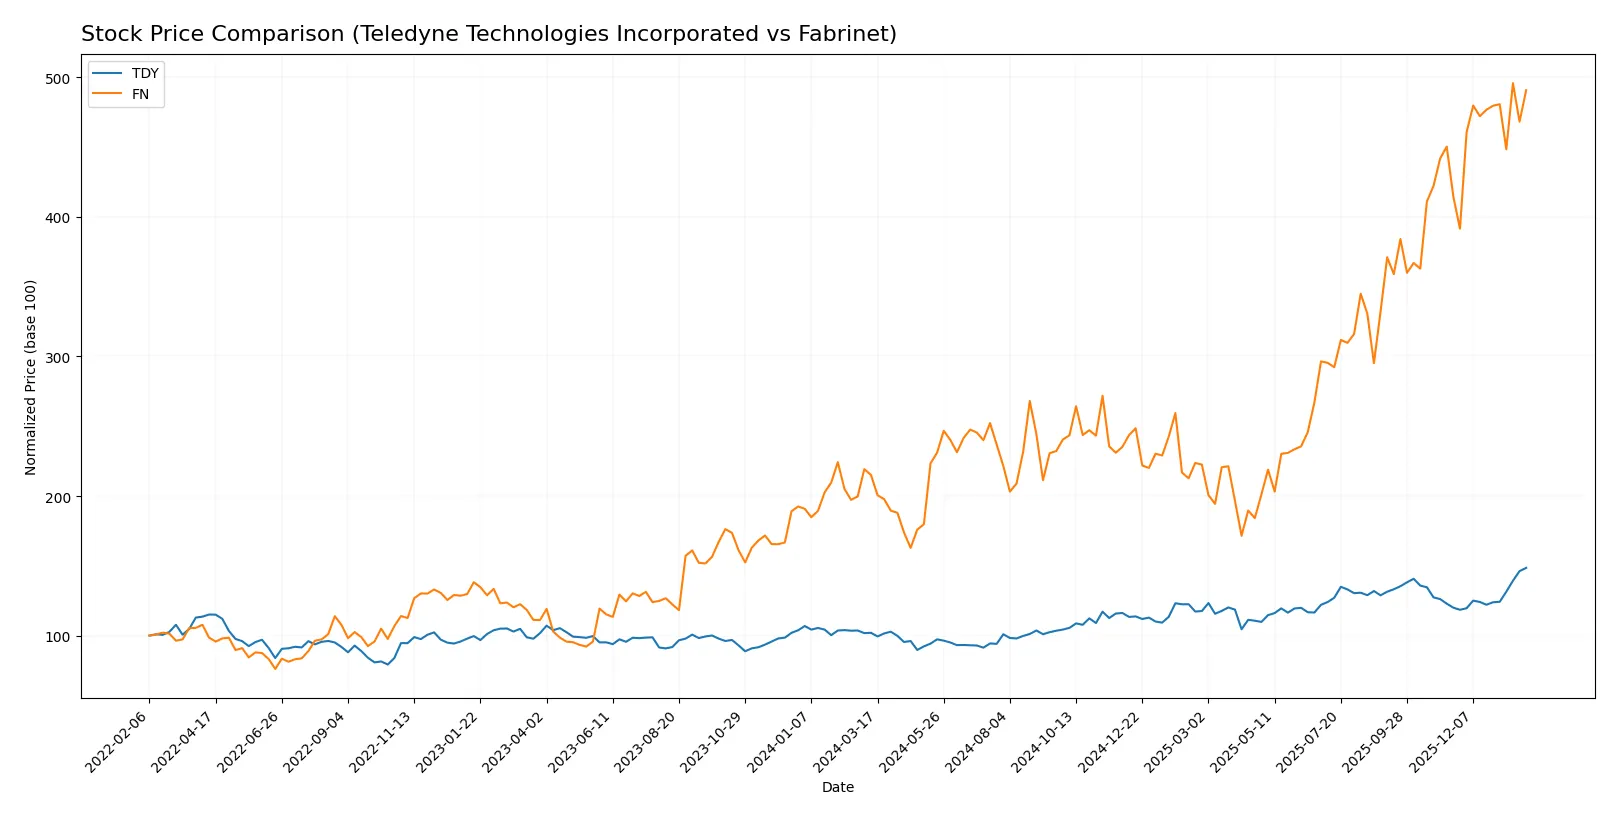
Trend Comparison
Teledyne Technologies’ stock rose 45.62% over 12 months, showing a bullish trend with accelerating momentum and a high volatility of 58.2, ranging between 374.64 and 620.3.
Fabrinet’s stock surged 128.09% in the same period, also accelerating bullishly but with higher volatility at 90.27, reaching a low of 162.32 and a peak of 494.45.
Fabrinet outperformed Teledyne by a wide margin, delivering the highest market returns and stronger price appreciation over the past year.
Target Prices
Analysts present a cautiously optimistic target consensus for both Teledyne Technologies and Fabrinet.
| Company | Target Low | Target High | Consensus |
|---|---|---|---|
| Teledyne Technologies Incorporated | 599 | 720 | 638.5 |
| Fabrinet | 537 | 600 | 569 |
Teledyne’s target consensus at 638.5 slightly exceeds its current 620 price, implying moderate upside. Fabrinet’s 569 target consensus also suggests significant potential above its 489 price.

Don’t Let Luck Decide Your Entry Point
Optimize your entry points with our advanced ProRealTime indicators. You’ll get efficient buy signals with precise price targets for maximum performance. Start outperforming now!
How do institutions grade them?
The institutional grades for Teledyne Technologies Incorporated and Fabrinet are summarized below:
Teledyne Technologies Incorporated Grades
The following table lists recent grades given by recognized financial institutions for Teledyne Technologies Incorporated.
| Grading Company | Action | New Grade | Date |
|---|---|---|---|
| Barclays | Maintain | Equal Weight | 2026-01-22 |
| Needham | Maintain | Buy | 2026-01-22 |
| Stifel | Maintain | Buy | 2026-01-22 |
| Citigroup | Maintain | Neutral | 2026-01-13 |
| Barclays | Maintain | Equal Weight | 2026-01-12 |
| Needham | Maintain | Buy | 2025-10-23 |
| Barclays | Maintain | Equal Weight | 2025-10-23 |
| Stifel | Maintain | Buy | 2025-10-23 |
| Morgan Stanley | Maintain | Equal Weight | 2025-10-15 |
| UBS | Maintain | Buy | 2025-07-24 |
Fabrinet Grades
The following table lists recent grades given by recognized financial institutions for Fabrinet.
| Grading Company | Action | New Grade | Date |
|---|---|---|---|
| Susquehanna | Maintain | Positive | 2026-01-22 |
| Barclays | Upgrade | Overweight | 2026-01-14 |
| Barclays | Maintain | Equal Weight | 2025-11-05 |
| Needham | Maintain | Buy | 2025-11-04 |
| Rosenblatt | Maintain | Buy | 2025-11-04 |
| JP Morgan | Maintain | Overweight | 2025-11-04 |
| JP Morgan | Maintain | Overweight | 2025-10-16 |
| Rosenblatt | Maintain | Buy | 2025-10-02 |
| JP Morgan | Upgrade | Overweight | 2025-08-25 |
| B. Riley Securities | Maintain | Neutral | 2025-08-19 |
Which company has the best grades?
Fabrinet has received more upgrades and generally stronger ratings, including multiple Overweight grades. Teledyne’s grades cluster around Equal Weight and Buy. Fabrinet’s superior institutional sentiment may attract investors seeking growth potential.
Risks specific to each company
The following categories identify the critical pressure points and systemic threats facing both firms in the 2026 market environment:
1. Market & Competition
Teledyne Technologies Incorporated
- Faces moderate pressure from peers due to its diversified tech segments but benefits from niche aerospace and defense markets.
Fabrinet
- Operates in highly competitive optical manufacturing with strong customer dependency and evolving tech demands.
2. Capital Structure & Debt
Teledyne Technologies Incorporated
- Maintains a conservative debt level with a debt-to-assets ratio of 16.19%, supporting financial flexibility.
Fabrinet
- Virtually debt-free, showcasing a pristine balance sheet and minimal financial risk.
3. Stock Volatility
Teledyne Technologies Incorporated
- Beta near 1.03 indicates average market volatility, aligning with sector norms.
Fabrinet
- Similar beta of 1.04 suggests volatility tracks the broader market without extreme swings.
4. Regulatory & Legal
Teledyne Technologies Incorporated
- Exposure to US and international aerospace regulations adds complexity and compliance costs.
Fabrinet
- Faces regulatory risks primarily in manufacturing standards across multiple jurisdictions.
5. Supply Chain & Operations
Teledyne Technologies Incorporated
- Complex global supply chains for aerospace and defense components increase operational risks.
Fabrinet
- Heavy reliance on Asia-Pacific manufacturing exposes it to regional disruptions and geopolitical tensions.
6. ESG & Climate Transition
Teledyne Technologies Incorporated
- Moderate ESG risks from industrial operations but benefits from defense sector’s long-term investment.
Fabrinet
- Faces ESG scrutiny related to manufacturing emissions and sustainable sourcing in optical components.
7. Geopolitical Exposure
Teledyne Technologies Incorporated
- US-centric with international sales; geopolitical tensions may impact defense contracts.
Fabrinet
- Cayman Islands domicile reduces tax risk but increases exposure to offshore regulatory shifts and Asia-Pacific instability.
Which company shows a better risk-adjusted profile?
Fabrinet’s debt-free balance sheet and strong operational efficiency provide a more favorable risk-adjusted profile. Teledyne’s moderate debt and complex supply chains pose higher operational and financial risks despite market diversification. Fabrinet’s superior Altman Z-Score and financial ratios justify cautious optimism.
Final Verdict: Which stock to choose?
Teledyne Technologies Incorporated’s superpower lies in its operational resilience and steady cash generation, underscored by a growing profitability trend despite shedding value on invested capital. Its moderate leverage and solid liquidity position warrant vigilance. It suits investors with an appetite for steady industrial growth and moderate risk tolerance.
Fabrinet stands out with a robust economic moat, driven by efficient capital use and a durable competitive advantage in precision manufacturing. Its pristine balance sheet and higher returns on equity offer a safer harbor relative to Teledyne. This company aligns well with investors seeking Growth at a Reasonable Price (GARP) profiles.
If you prioritize operational stability and steady cash flow, Teledyne could be the compelling choice due to its resilience amid moderate value destruction. However, if you seek superior capital efficiency and stronger competitive durability, Fabrinet offers better stability and growth potential, albeit at a premium valuation. Both require careful risk assessment given differing financial dynamics.
Disclaimer: Investment carries a risk of loss of initial capital. The past performance is not a reliable indicator of future results. Be sure to understand risks before making an investment decision.
Go Further
I encourage you to read the complete analyses of Teledyne Technologies Incorporated and Fabrinet to enhance your investment decisions: