Home > Comparison > Technology > TEL vs FN
The strategic rivalry between TE Connectivity Ltd. and Fabrinet shapes the technology hardware sector’s future. TE Connectivity operates as a diversified industrial powerhouse, spanning transportation, industrial, and communications solutions. Fabrinet focuses on precision optical and electro-mechanical manufacturing services with advanced packaging expertise. This analysis pits broad industrial integration against specialized manufacturing excellence to identify which trajectory offers superior risk-adjusted returns for a diversified portfolio.

Table of contents
Companies Overview
TE Connectivity Ltd. and Fabrinet are pivotal players in the hardware and equipment sector with distinct global footprints and technologies.
TE Connectivity Ltd.: Global Connectivity and Sensor Solutions Leader
TE Connectivity Ltd. dominates the connectivity and sensor solutions market across multiple industries. It generates revenue through three segments: Transportation, Industrial, and Communications Solutions. In 2026, the company focuses strategically on expanding its product portfolio and deepening its presence in automotive and industrial markets worldwide, leveraging its scale and engineering expertise.
Fabrinet: Precision Optical and Electro-mechanical Manufacturer
Fabrinet specializes in advanced optical packaging and precision manufacturing services for telecom and industrial clients. Its revenue stems from supplying complex optical components, lasers, and sensors. In 2026, the firm prioritizes process innovation and supply chain efficiency to support OEMs in high-speed data communications and industrial laser markets, emphasizing customization and quality control.
Strategic Collision: Similarities & Divergences
Both companies operate in the hardware space but diverge in their core philosophies: TE Connectivity pursues a broad, diversified product approach, while Fabrinet emphasizes specialized, high-precision manufacturing. They primarily compete in the connectivity and sensor markets, with TE targeting scale and multi-industry reach and Fabrinet focusing on niche optical components. Their investment profiles reflect this contrast—TE offers stability through diversification, Fabrinet appeals via technological specialization.
Income Statement Comparison
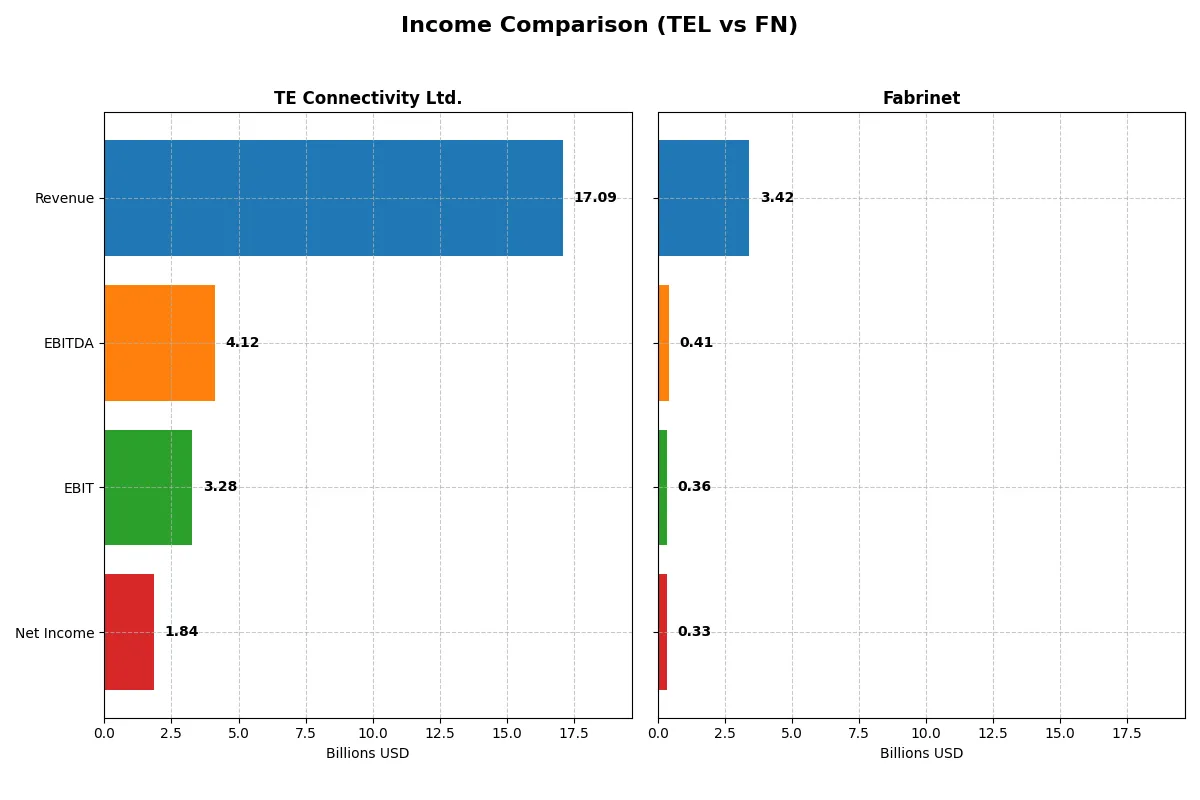
This data dissects the core profitability and scalability of both corporate engines to reveal who dominates the bottom line:
| Metric | TE Connectivity Ltd. (TEL) | Fabrinet (FN) |
|---|---|---|
| Revenue | 17.1B | 3.4B |
| Cost of Revenue | 11.2B | 3.0B |
| Operating Expenses | 2.7B | 89M |
| Gross Profit | 5.9B | 413M |
| EBITDA | 4.1B | 409M |
| EBIT | 3.3B | 355M |
| Interest Expense | 77M | 0 |
| Net Income | 1.8B | 333M |
| EPS | 6.2 | 9.23 |
| Fiscal Year | 2025 | 2025 |
Income Statement Analysis: The Bottom-Line Duel
This income statement comparison reveals which company runs a more efficient and profitable corporate engine under current market conditions.
TE Connectivity Ltd. Analysis
TE Connectivity’s revenue rose steadily to $17.1B in 2025, up 7.9% from 2024. Gross margin improved to 34.6%, signaling solid cost control. However, net income dropped sharply to $1.84B, reflecting margin pressure despite a favorable EBIT margin of 19.2%. The latest year shows operational strength but challenges in translating revenue growth into bottom-line gains.
Fabrinet Analysis
Fabrinet’s revenue surged 18.6% to $3.42B in 2025, with gross margin stable at 12.1%. EBIT margin held a healthy 10.4%, supporting a net income climb to $333M. Net margin slightly declined but remains robust. Fabrinet’s income statement displays strong growth momentum and improving profitability, underpinned by disciplined operating expense control.
Verdict: Scale Efficiency vs. High-Growth Momentum
TE Connectivity commands scale with superior gross and EBIT margins but struggles with recent net income contraction. Fabrinet shows faster revenue and net income growth, with consistent margin expansion. For investors, TE offers stability and margin power; Fabrinet appeals as a growth story with expanding profitability.
Financial Ratios Comparison
These vital ratios act as a diagnostic tool to expose the underlying fiscal health, valuation premiums, and capital efficiency of the companies compared below:
| Ratios | TE Connectivity Ltd. (TEL) | Fabrinet (FN) |
|---|---|---|
| ROE | 14.64% | 16.78% |
| ROIC | 8.82% | 15.01% |
| P/E | 35.0 | 32.0 |
| P/B | 5.12 | 5.37 |
| Current Ratio | 1.56 | 3.00 |
| Quick Ratio | 1.03 | 2.28 |
| D/E | 0.52 | 0.003 |
| Debt-to-Assets | 26.1% | 0.2% |
| Interest Coverage | 41.7 | 0 (no debt) |
| Asset Turnover | 0.68 | 1.21 |
| Fixed Asset Turnover | 3.96 | 8.85 |
| Payout ratio | 43.6% | 0% |
| Dividend yield | 1.25% | 0% |
| Fiscal Year | 2025 | 2025 |
Efficiency & Valuation Duel: The Vital Signs
Financial ratios act as a company’s DNA, uncovering hidden risks and revealing the strength of its operational excellence. They offer critical insight into profitability, valuation, and capital efficiency.
TE Connectivity Ltd.
TE Connectivity shows a neutral return on equity at 14.6%, supported by a favorable net margin of 10.8%. Its valuation is stretched with a high P/E of 35.0 and P/B of 5.12, indicating premium pricing. The company delivers modest shareholder returns via a 1.25% dividend yield while maintaining solid liquidity and moderate leverage.
Fabrinet
Fabrinet impresses with a robust ROE of 16.8% and a strong ROIC of 15.0%, both favorable metrics signaling efficient capital use. Its valuation is also on the expensive side, with a P/E of 32.0 and P/B of 5.37. Fabrinet does not pay dividends but reinvests heavily to sustain growth, reflected in excellent liquidity and zero debt.
Operational Efficiency and Valuation Premium: A Balanced Contest
Fabrinet offers superior operational efficiency and capital structure but at a premium valuation and no dividend income. TE Connectivity balances moderate profitability with steady dividends and manageable risk. Investors seeking growth may prefer Fabrinet’s reinvestment profile, while those favoring income and stability might lean toward TE Connectivity.
Which one offers the Superior Shareholder Reward?
I compare TE Connectivity Ltd. (TEL) and Fabrinet (FN) on shareholder rewards by examining dividends and buybacks. TEL pays a steady dividend yield around 1.2–1.9% with payout ratios between 24% and 44%, supported by strong free cash flow coverage above 0.7. Fabrinet pays no dividend but invests heavily in growth, reflected in a 0% payout ratio and robust reinvestment in capex and R&D. Buyback activity data is limited, but TEL’s dividend payout combined with moderate buybacks suggests a balanced distribution strategy. FN’s zero dividend and high free cash flow reinvestment signal a growth-first approach. I find TEL’s sustainable dividend and cash flow-backed payouts offer more reliable total shareholder returns in 2026, especially in uncertain market cycles. FN’s model suits growth investors but carries higher risk without immediate income. Thus, TEL provides the superior shareholder reward for income-focused investors seeking durability and steady returns.
Comparative Score Analysis: The Strategic Profile
The radar chart reveals the fundamental DNA and trade-offs of TE Connectivity Ltd. and Fabrinet, highlighting their financial strengths and weaknesses across key metrics:
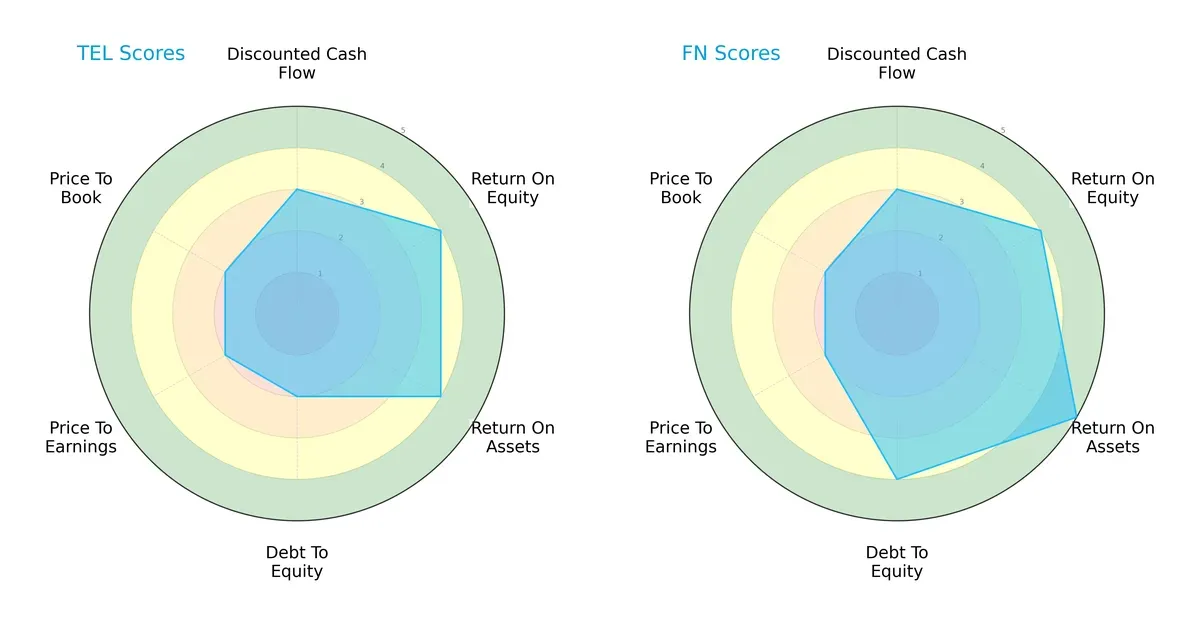
Fabrinet leads with a more balanced profile, boasting a very favorable ROA score (5) and stronger debt-to-equity (4). TE Connectivity shows solid ROE and ROA (4 each) but carries higher financial leverage (debt-to-equity score 2). Both share moderate valuation scores, but Fabrinet’s overall score (4) edges out TE’s (3), indicating superior operational efficiency and financial stability.
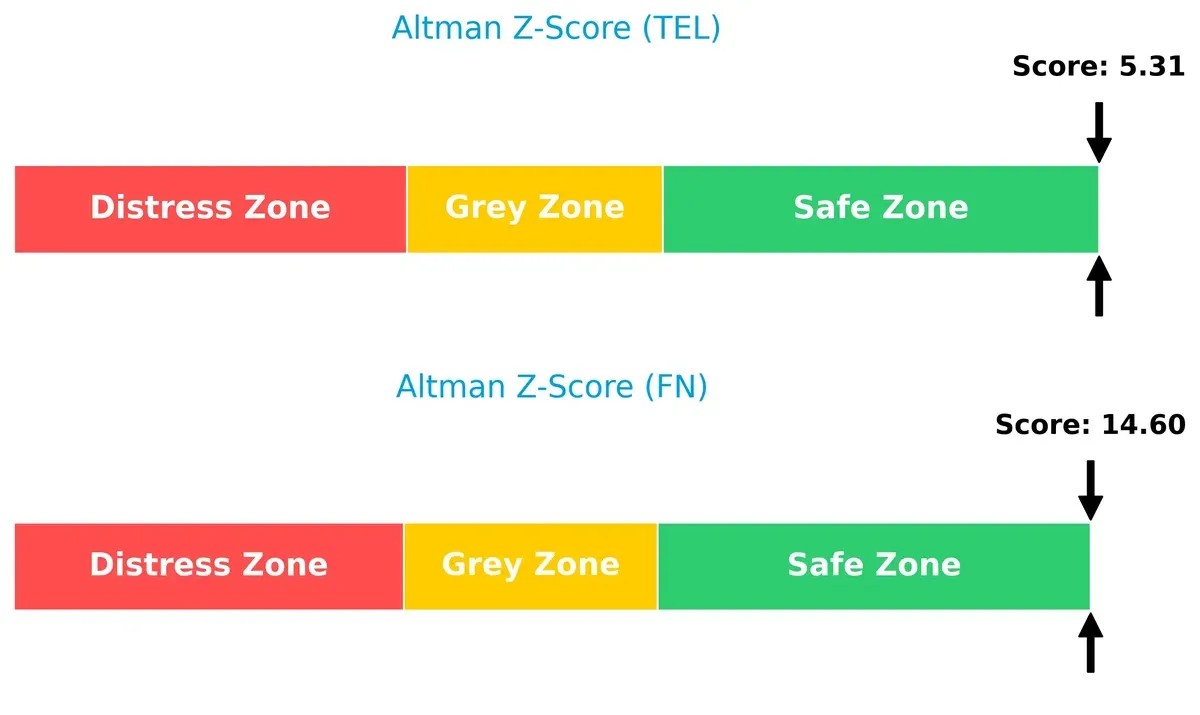
Bankruptcy Risk: Solvency Showdown
Fabrinet’s Altman Z-Score (14.6) far exceeds TE Connectivity’s (5.3), both safely above the distress threshold, underscoring Fabrinet’s significantly stronger solvency and lower bankruptcy risk in this economic cycle:
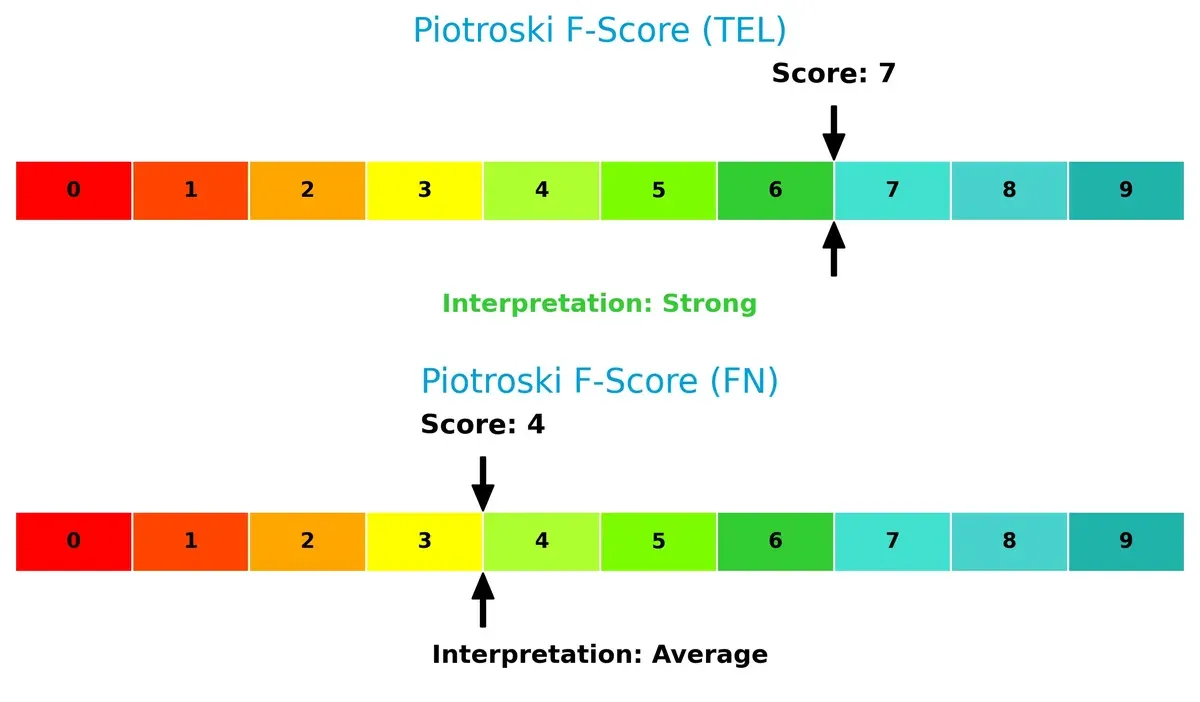
Financial Health: Quality of Operations
TE Connectivity scores a robust 7 on the Piotroski F-Score, reflecting strong financial health and internal metrics. Fabrinet’s average score of 4 signals potential red flags and operational weaknesses relative to TE:
How are the two companies positioned?
This section dissects TEL and FN’s operational DNA by comparing their revenue distribution by segment and analyzing their internal strengths and weaknesses. The goal is to confront their economic moats to reveal which business model delivers the most resilient, sustainable advantage today.
Revenue Segmentation: The Strategic Mix
The following visual comparison dissects how TE Connectivity Ltd. and Fabrinet diversify their income streams and where their primary sector bets lie:
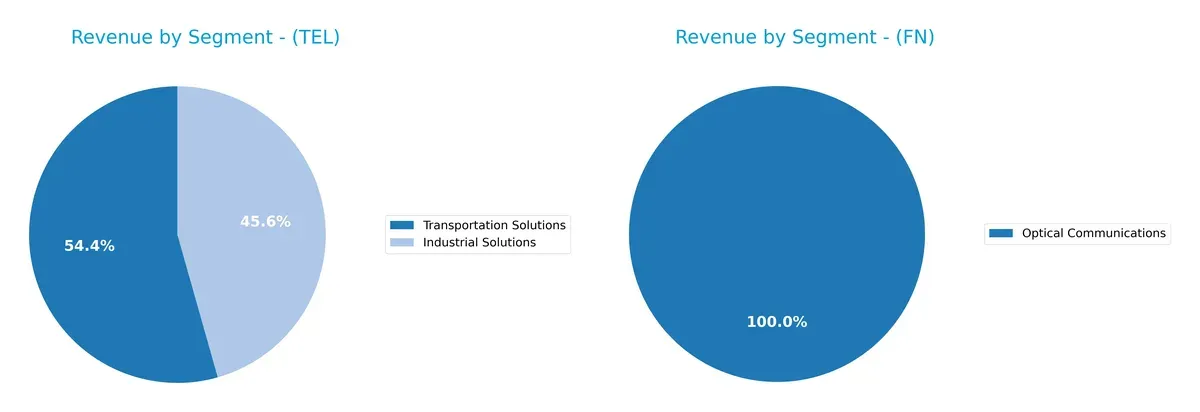
TE Connectivity Ltd. anchors its revenue in two heavyweights: Transportation Solutions at $9.4B and Industrial Solutions at $7.9B for 2025. This signals a strong industrial and infrastructure dominance. Fabrinet, by contrast, pivots almost entirely on Optical Communications with $2.6B in 2025, showing a concentrated but focused approach. TE’s diversified mix mitigates risk, while Fabrinet’s reliance on a single segment invites vulnerability but capitalizes on niche expertise.
Strengths and Weaknesses Comparison
This table compares the Strengths and Weaknesses of TE Connectivity Ltd. and Fabrinet:
TEL Strengths
- Diverse product segments including Industrial and Transportation Solutions
- Broad global revenue exposure across China, US, and Europe
- Favorable liquidity ratios indicating solid short-term financial health
FN Strengths
- High profitability metrics with favorable ROE and ROIC above WACC
- Strong liquidity with a current ratio of 3.0 and zero debt
- High asset turnover and fixed asset efficiency signify operational strength
TEL Weaknesses
- Elevated valuation multiples with P/E of 35.0 and PB of 5.12 considered unfavorable
- Neutral returns on invested capital relative to WACC may limit value creation
- Moderate leverage with debt-to-equity at 0.52
FN Weaknesses
- Unfavorable valuation multiples with P/E of 32.0 and PB of 5.37
- No dividend yield which may deter income-focused investors
- Lower net margin compared to ROE suggests possible cost structure issues
Both companies show solid financial foundations with different strengths: TEL leverages diversification and global scale, while FN excels in profitability and operational efficiency. Their respective weaknesses highlight valuation risks and capital return challenges that may influence strategic priorities.
The Moat Duel: Analyzing Competitive Defensibility
A structural moat is the sole barrier protecting long-term profits from relentless competitive erosion. Let’s examine how these two firms defend their turf:
TE Connectivity Ltd.: Scale and Diversification Moat
TE Connectivity relies on its vast global footprint and product breadth as its primary moat. This manifests in stable margins around 19% EBIT and solid gross margins near 35%. However, ROIC trends show value erosion, signaling threats from intensifying competition and margin pressure in 2026.
Fabrinet: Operational Efficiency and Niche Expertise Moat
Fabrinet’s moat stems from its specialized manufacturing capabilities and precision optical services. Unlike TE Connectivity, Fabrinet posts a growing ROIC exceeding its WACC by over 6%, reflecting strong capital allocation and value creation. Its expanding revenue and margin growth in 2026 suggest deepening competitive advantages.
Verdict: Diversification Scale vs. Precision Operational Moat
Fabrinet wields a deeper moat, evidenced by rising ROIC and robust profitability metrics. TE Connectivity’s broad scale offers resilience but faces margin compression and declining capital returns. Fabrinet appears better equipped to defend and grow its market share amid evolving industry dynamics.
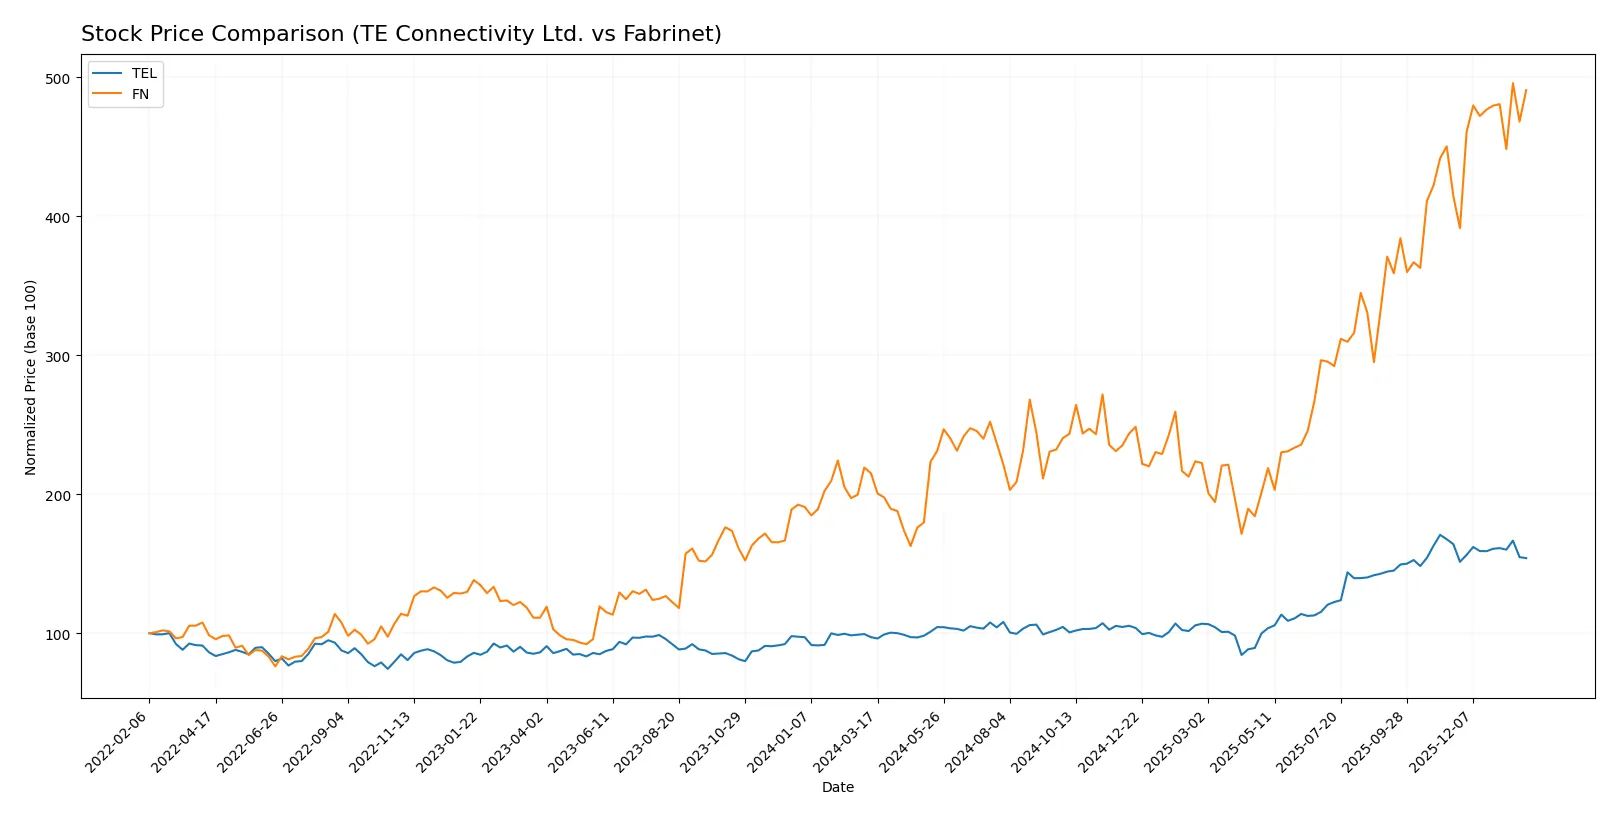
Which stock offers better returns?
The past year shows TE Connectivity’s strong initial rise slowing down recently, while Fabrinet’s rally accelerates with notable price surges and higher volatility.
Trend Comparison
TE Connectivity’s stock rose 58.53% over 12 months, marking a bullish trend with decelerating momentum. It hit a high of 247.01 and a low of 122. Recent months show a 6.13% decline, indicating short-term weakness.
Fabrinet’s stock surged 128.09% over the same period, confirming an accelerating bullish trend. The price ranged from 162.32 to 494.45 with high volatility. Recent gains of 18.42% reinforce strong upward momentum.
Comparing trends, Fabrinet outperformed TE Connectivity with a higher total return and accelerating strength, delivering the superior market performance over the last year.
Target Prices
Analysts set a confident target consensus for TE Connectivity Ltd. and Fabrinet, reflecting solid upside potential.
| Company | Target Low | Target High | Consensus |
|---|---|---|---|
| TE Connectivity Ltd. | 238 | 306 | 270.29 |
| Fabrinet | 537 | 600 | 569 |
TE Connectivity’s consensus target stands roughly 21% above its current 223 price, signaling moderate upside. Fabrinet’s target consensus exceeds its 489 price by about 16%, indicating strong analyst optimism.

Don’t Let Luck Decide Your Entry Point
Optimize your entry points with our advanced ProRealTime indicators. You’ll get efficient buy signals with precise price targets for maximum performance. Start outperforming now!
How do institutions grade them?
I compare the latest institutional grades for TE Connectivity Ltd. and Fabrinet below:
TE Connectivity Ltd. Grades
The table shows recent grades and rating actions from leading institutions for TE Connectivity Ltd.:
| Grading Company | Action | New Grade | Date |
|---|---|---|---|
| Oppenheimer | Upgrade | Outperform | 2026-01-27 |
| Barclays | Maintain | Overweight | 2026-01-23 |
| Truist Securities | Maintain | Hold | 2026-01-22 |
| Wells Fargo | Maintain | Equal Weight | 2026-01-22 |
| UBS | Maintain | Buy | 2026-01-14 |
| Truist Securities | Maintain | Hold | 2025-12-19 |
| Wells Fargo | Maintain | Equal Weight | 2025-12-09 |
| Truist Securities | Maintain | Hold | 2025-11-21 |
| Barclays | Maintain | Overweight | 2025-11-21 |
| TD Cowen | Maintain | Buy | 2025-11-17 |
Fabrinet Grades
Below are recent grades and rating actions from recognized institutions for Fabrinet:
| Grading Company | Action | New Grade | Date |
|---|---|---|---|
| Susquehanna | Maintain | Positive | 2026-01-22 |
| Barclays | Upgrade | Overweight | 2026-01-14 |
| Barclays | Maintain | Equal Weight | 2025-11-05 |
| Needham | Maintain | Buy | 2025-11-04 |
| Rosenblatt | Maintain | Buy | 2025-11-04 |
| JP Morgan | Maintain | Overweight | 2025-11-04 |
| JP Morgan | Maintain | Overweight | 2025-10-16 |
| Rosenblatt | Maintain | Buy | 2025-10-02 |
| JP Morgan | Upgrade | Overweight | 2025-08-25 |
| B. Riley Securities | Maintain | Neutral | 2025-08-19 |
Which company has the best grades?
TE Connectivity Ltd. features a recent upgrade to Outperform by Oppenheimer, complemented by stable Overweight and Buy ratings. Fabrinet holds multiple Buy and Overweight ratings but fewer upgrades. Investors may view TE Connectivity’s latest upgrade as a stronger signal of positive momentum.
Risks specific to each company
The following categories identify critical pressure points and systemic threats facing TE Connectivity Ltd. and Fabrinet in the 2026 market environment:
1. Market & Competition
TE Connectivity Ltd.
- Competes globally in connectivity and sensor solutions with strong industrial and transport focus. Faces cyclical demand risks.
Fabrinet
- Operates in advanced optical and electro-mechanical manufacturing with niche tech exposure. Faces concentrated OEM customer risk.
2. Capital Structure & Debt
TE Connectivity Ltd.
- Moderate leverage (D/E 0.52) with solid interest coverage (42.6x). Balanced capital structure reduces financial distress risk.
Fabrinet
- Virtually no debt (D/E 0.0) and infinite interest coverage indicates very low financial leverage and risk.
3. Stock Volatility
TE Connectivity Ltd.
- Beta of 1.24 signals higher sensitivity to market swings, increasing downside risk in downturns.
Fabrinet
- Beta near 1.04 indicates stock moves roughly in line with the market, implying moderate volatility.
4. Regulatory & Legal
TE Connectivity Ltd.
- Operates in multiple regulated sectors including aerospace and defense, exposing it to complex compliance risks.
Fabrinet
- Faces regulatory compliance in optical manufacturing and global supply chains, but less exposure to defense sector risks.
5. Supply Chain & Operations
TE Connectivity Ltd.
- Global footprint and diversified segments mitigate supply chain disruption risks but expose to geopolitical tensions.
Fabrinet
- Highly specialized manufacturing relies on precision supply chains vulnerable to technological obsolescence and regional disruptions.
6. ESG & Climate Transition
TE Connectivity Ltd.
- Industrial operations face pressure to reduce carbon footprint; must invest in green tech to meet evolving standards.
Fabrinet
- Optical and electronic manufacturing faces ESG scrutiny; opportunity to lead in sustainable advanced materials.
7. Geopolitical Exposure
TE Connectivity Ltd.
- Broad international presence includes higher-risk regions; vulnerable to trade tensions and regulatory shifts.
Fabrinet
- Based in Cayman Islands with key operations in Asia-Pacific; exposed to regional geopolitical volatility impacting supply lines.
Which company shows a better risk-adjusted profile?
Fabrinet’s minimal debt and favorable operational metrics grant it a more stable financial base. TE Connectivity faces greater market volatility and geopolitical risks but benefits from diversification. Fabrinet’s lower leverage and higher ROIC underpin a superior risk-adjusted profile.
Fabrinet’s lack of debt remains its strongest risk buffer. TE Connectivity’s greatest risk is market and geopolitical exposure, given its global scale and cyclical end markets. Fabrinet’s operational niche and capital conservatism support better resilience against 2026’s uncertainties.
Final Verdict: Which stock to choose?
TE Connectivity Ltd. (TEL) excels as a cash machine with strong operational efficiency and a stable balance sheet. Its point of vigilance lies in declining profitability trends, signaling potential challenges ahead. TEL suits portfolios aiming for steady income with moderate growth exposure.
Fabrinet (FN) boasts a durable moat through efficient capital use and a clean balance sheet, reflecting a robust competitive edge. It offers superior growth momentum and better financial stability compared to TEL. FN fits well into growth-oriented or GARP portfolios seeking long-term value creation.
If you prioritize capital efficiency and consistent cash generation, TEL is the compelling choice due to its operational strength. However, if you seek accelerating growth backed by a durable competitive advantage, FN offers better stability and value creation potential. Both present distinct analytical scenarios depending on investor risk appetite and strategy.
Disclaimer: Investment carries a risk of loss of initial capital. The past performance is not a reliable indicator of future results. Be sure to understand risks before making an investment decision.
Go Further
I encourage you to read the complete analyses of TE Connectivity Ltd. and Fabrinet to enhance your investment decisions: