Home > Comparison > Technology > FN vs SANM
The strategic rivalry between Fabrinet and Sanmina Corporation shapes the trajectory of the technology hardware sector. Fabrinet excels as a precision optical and electro-mechanical manufacturer, focusing on high-value components for communications and medical industries. In contrast, Sanmina operates as an integrated manufacturing solutions provider, with broad capabilities spanning industrial to defense sectors. This analysis aims to identify which company offers the superior risk-adjusted return for a diversified portfolio amid evolving sector demands.

Table of contents
Companies Overview
Fabrinet and Sanmina Corporation stand as pivotal players in the highly competitive Hardware, Equipment & Parts sector.
Fabrinet: Precision Optical Manufacturing Leader
Fabrinet excels as a provider of advanced optical packaging and electro-mechanical manufacturing services. Its revenue stems from designing and producing optical components, lasers, and sensors for telecom, medical, and automotive industries. In 2026, Fabrinet focuses on refining its manufacturing process design and expanding supply chain management to enhance product quality and operational efficiency.
Sanmina Corporation: Integrated Manufacturing Solutions Powerhouse
Sanmina dominates as a global provider of integrated manufacturing and supply chain services. Its core income derives from product design, assembly, testing, and after-market support across diverse sectors including aerospace, defense, and cloud solutions. The company’s 2026 strategy emphasizes innovation in cloud-based manufacturing execution software and broadening its footprint in high-growth industrial markets.
Strategic Collision: Similarities & Divergences
Both firms compete in high-precision manufacturing but pursue distinct philosophies: Fabrinet specializes in optical and electro-mechanical components, while Sanmina leverages integrated systems and broad service offerings. Their battle for market share centers on delivering customized, high-quality solutions to OEMs. Investors should note Fabrinet’s niche technological focus contrasts with Sanmina’s diversified industrial exposure, defining unique risk and growth profiles.
Income Statement Comparison
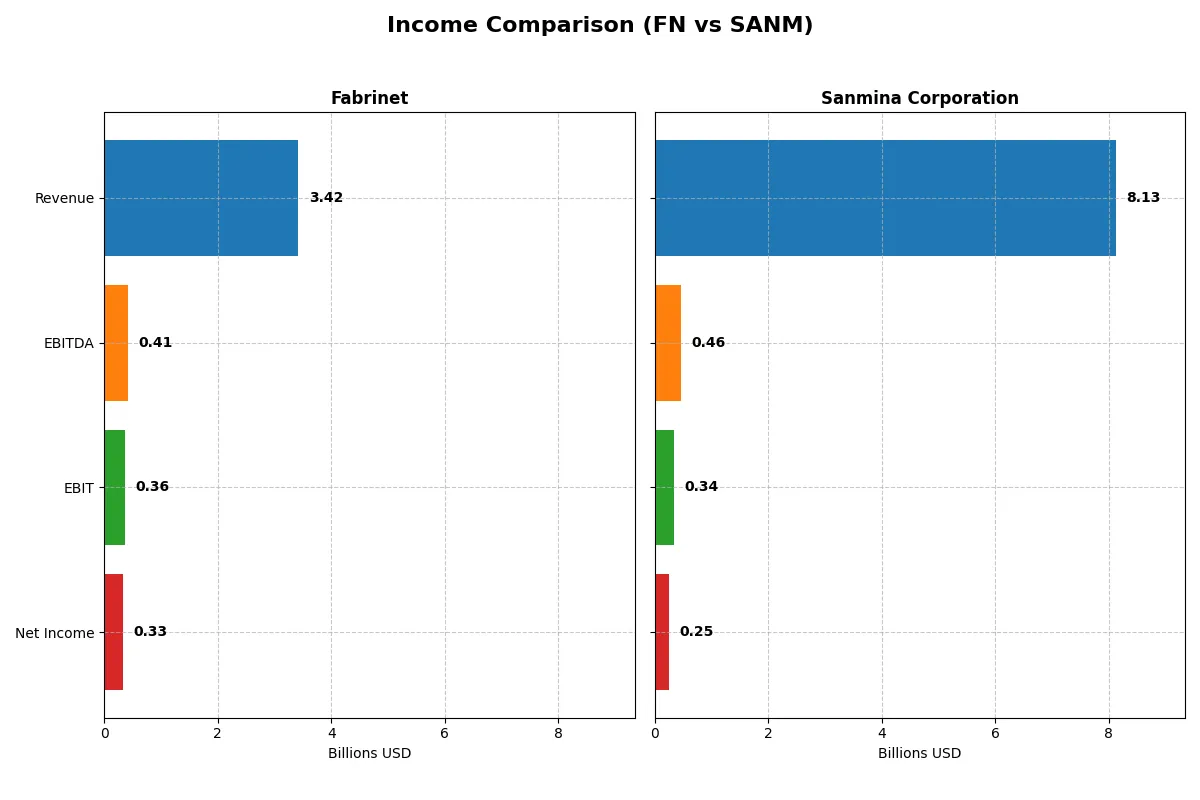
This data dissects the core profitability and scalability of both corporate engines to reveal who dominates the bottom line:
| Metric | Fabrinet (FN) | Sanmina Corporation (SANM) |
|---|---|---|
| Revenue | 3.42B | 8.13B |
| Cost of Revenue | 3.01B | 7.41B |
| Operating Expenses | 89M | 362M |
| Gross Profit | 413M | 716M |
| EBITDA | 409M | 463M |
| EBIT | 355M | 344M |
| Interest Expense | 0 | 4.3M |
| Net Income | 333M | 246M |
| EPS | 9.23 | 4.56 |
| Fiscal Year | 2025 | 2025 |
Income Statement Analysis: The Bottom-Line Duel
The income statement comparison reveals which company operates with greater efficiency and stronger profitability over recent years.
Fabrinet Analysis
Fabrinet’s revenue surged from 1.88B in 2021 to 3.42B in 2025, showing robust growth momentum. Its net income climbed from 148M to 333M, driving net margin to a favorable 9.72% in 2025. Gross margin remains stable near 12%, while operating margins expanded, signaling improved cost control and operational efficiency in the latest year.
Sanmina Corporation Analysis
Sanmina’s revenue increased moderately from 6.74B in 2021 to 8.13B in 2025. However, net income stagnated around 246M in 2025, leading to a thin net margin of 3.03%. Gross margin held near 8.8%, but EBIT margin stayed low at 4.23%, reflecting challenges in converting sales growth into earnings efficiently.
Margin Power vs. Revenue Scale
Fabrinet clearly outpaces Sanmina in profitability metrics, boasting double the net margin and stronger earnings growth. Sanmina’s scale is larger but less efficient, with its profits under pressure despite revenue gains. For investors prioritizing margin strength and earnings momentum, Fabrinet presents a more attractive profile.
Financial Ratios Comparison
These vital ratios act as a diagnostic tool to expose the underlying fiscal health, valuation premiums, and capital efficiency of the companies compared:
| Ratios | Fabrinet (FN) | Sanmina Corporation (SANM) |
|---|---|---|
| ROE | 16.78% | 10.45% |
| ROIC | 15.01% | 9.04% |
| P/E | 32.02 | 25.59 |
| P/B | 5.37 | 2.67 |
| Current Ratio | 3.00 | 1.72 |
| Quick Ratio | 2.28 | 1.02 |
| D/E | 0.003 | 0.167 |
| Debt-to-Assets | 0.19% | 6.73% |
| Interest Coverage | 0 | 82.53 |
| Asset Turnover | 1.21 | 1.39 |
| Fixed Asset Turnover | 8.85 | 11.91 |
| Payout Ratio | 0% | 0% |
| Dividend Yield | 0% | 0% |
| Fiscal Year | 2025 | 2025 |
Efficiency & Valuation Duel: The Vital Signs
Ratios serve as a company’s DNA, exposing hidden risks and showcasing operational excellence critical to investment decisions.
Fabrinet
Fabrinet demonstrates robust profitability with a 16.78% ROE and a favorable 15.01% ROIC, indicating efficient capital use above its 8.67% WACC. The stock trades at a stretched 32.02 P/E and expensive 5.37 P/B, reflecting high market expectations. It pays no dividends, reinvesting cash flow to sustain growth and operational strength.
Sanmina Corporation
Sanmina shows moderate profitability with a 10.45% ROE and 9.04% ROIC, just above its 8.46% WACC, suggesting average capital efficiency. Its valuation is less stretched at a 25.59 P/E and a neutral 2.67 P/B. Like Fabrinet, it offers no dividends but allocates resources to R&D, aiming to boost future returns.
Premium Valuation vs. Steady Efficiency
Fabrinet commands a premium valuation fueled by superior profitability and capital efficiency, though at a higher risk of valuation compression. Sanmina balances moderate returns with a more reasonable price. Investors seeking growth may prefer Fabrinet’s profile; those prioritizing value and stability might lean toward Sanmina.
Which one offers the Superior Shareholder Reward?
I observe Fabrinet (FN) and Sanmina Corporation (SANM) both avoid dividends, focusing on reinvestment and buybacks. FN’s free cash flow per share reached 5.7 in 2025, while SANM posted 8.6. FN shows no dividend payout, investing heavily in capex with a solid free cash flow coverage ratio (0.63). SANM also reinvests but sustains a lower operating margin (4.2% vs. FN’s 10.4%) and higher leverage (debt to equity 0.17 vs. FN’s 0.003). SANM’s buyback intensity is implied by its strong free cash flow relative to capex, but FN’s pristine balance sheet and higher margins suggest more sustainable capital allocation. For long-term total returns in 2026, I favor FN’s disciplined reinvestment and low leverage over SANM’s riskier profile.
Comparative Score Analysis: The Strategic Profile
The radar chart reveals the fundamental DNA and trade-offs of Fabrinet and Sanmina Corporation, highlighting their distinct financial strengths and vulnerabilities:
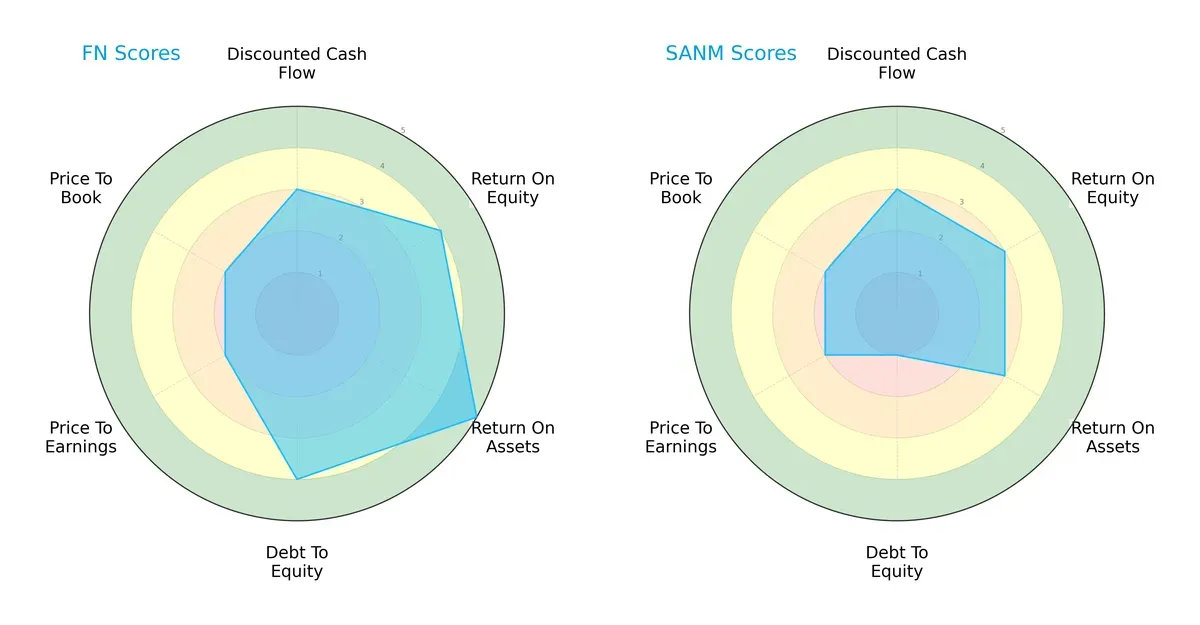
Fabrinet shows a balanced profile with strong ROE (4) and ROA (5) scores, indicating efficient profit generation and asset use. Its debt-to-equity score (4) reflects prudent leverage management. Sanmina relies heavily on a moderate DCF (3) but suffers from a weak debt-to-equity score (1), exposing financial risk. Fabrinet’s valuation scores (P/E and P/B at 2) and Sanmina’s matching scores suggest neither is deeply undervalued, but Fabrinet’s overall financial health is clearly superior.
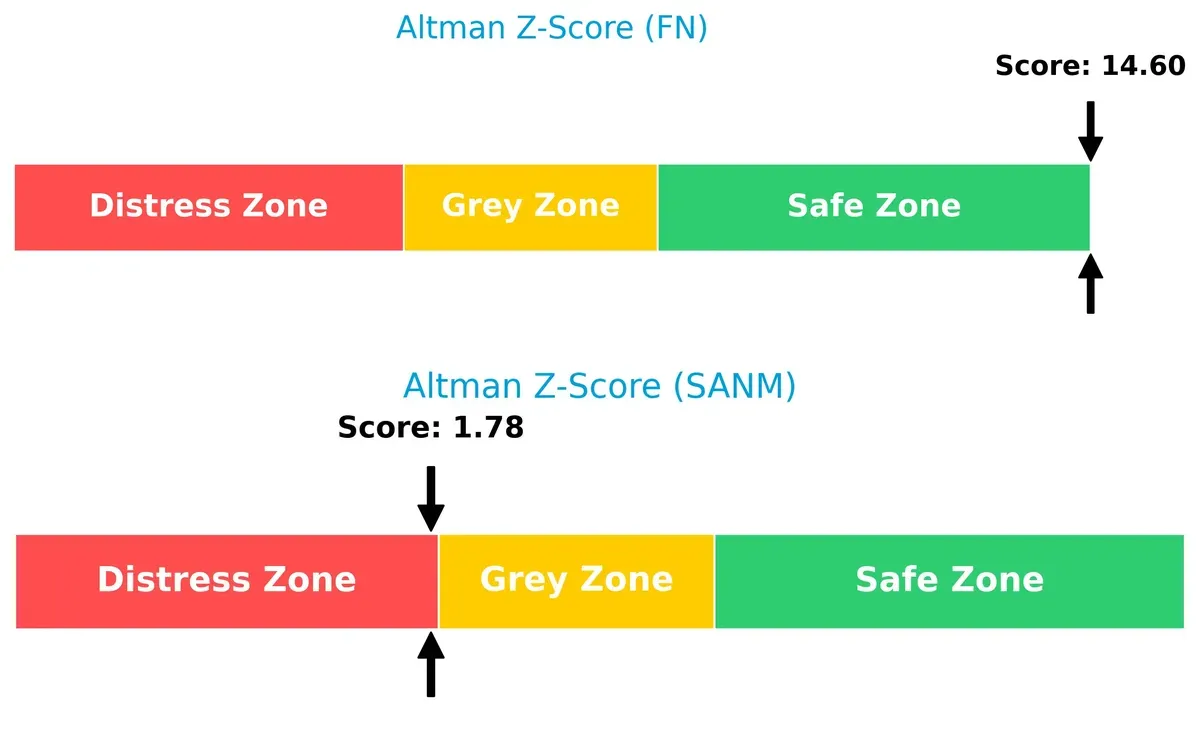
Bankruptcy Risk: Solvency Showdown
Fabrinet’s Altman Z-Score of 14.6 firmly places it in the safe zone, signaling negligible bankruptcy risk. In contrast, Sanmina’s 1.78 score lands in the distress zone, warning of heightened financial vulnerability in this cycle:
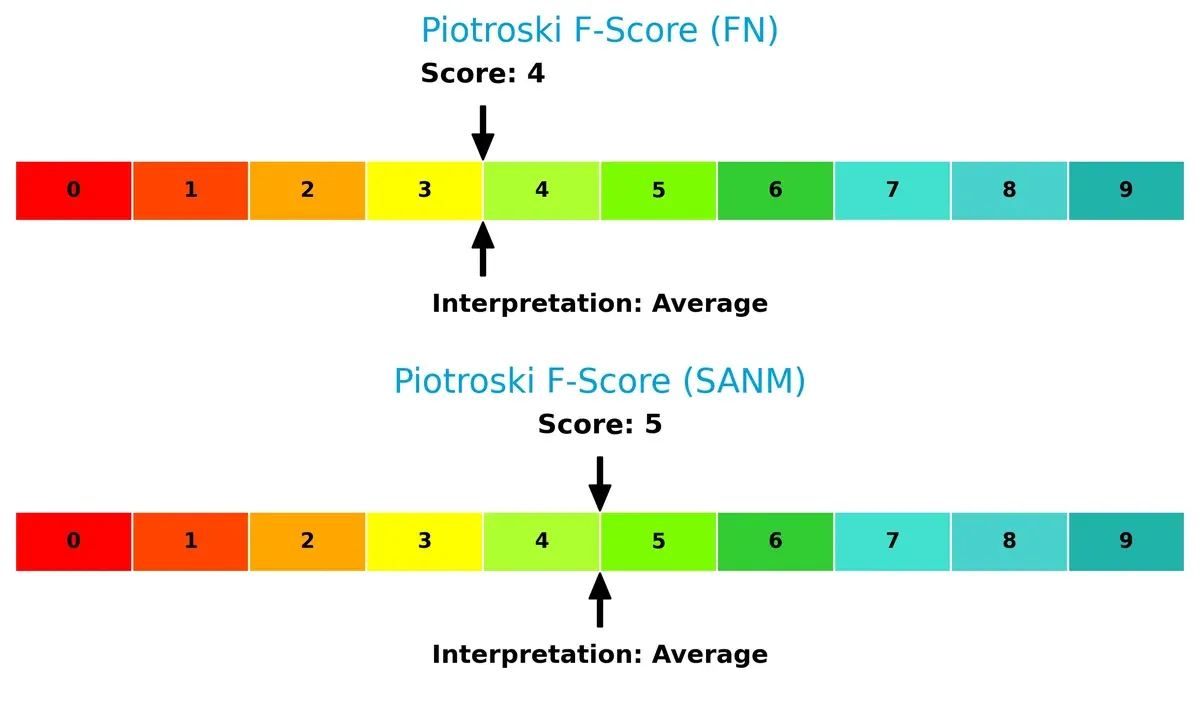
Financial Health: Quality of Operations
Both companies show average Piotroski F-Scores—Fabrinet at 4 and Sanmina at 5—indicating moderate operational quality. Neither exhibits peak financial health, but Fabrinet’s slightly lower score suggests some internal metrics warrant attention:
How are the two companies positioned?
This section dissects the operational DNA of Fabrinet and Sanmina by comparing their revenue distribution and internal dynamics. The goal is to confront their economic moats and reveal which model offers the most resilient competitive advantage today.
Revenue Segmentation: The Strategic Mix
This comparison dissects how Fabrinet and Sanmina diversify their income streams and highlights their primary sector bets:
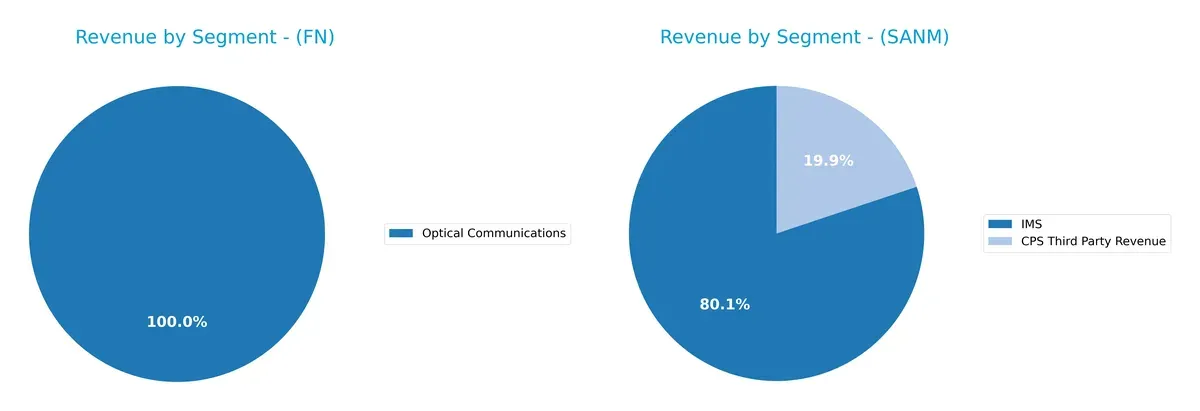
Fabrinet anchors its revenue heavily in Optical Communications, with $2.6B in 2025, while its secondary segment remains below $640M. Sanmina shows a more diversified mix, with IMS at $6.5B and CPS Third Party Revenue at $1.6B. Fabrinet’s concentration signals a strong niche focus, potentially increasing concentration risk. Sanmina’s broader base suggests ecosystem lock-in and infrastructure dominance, reducing volatility exposure.
Strengths and Weaknesses Comparison
This table compares the strengths and weaknesses of Fabrinet and Sanmina Corporation based on diversification, profitability, financials, innovation, global presence, and market share:
Fabrinet Strengths
- Strong profitability metrics with favorable ROE and ROIC
- Robust liquidity with current ratio at 3.0
- Zero debt and low debt-to-assets ratio
- High asset and fixed asset turnover indicating operational efficiency
- Solid global presence across Asia Pacific, Europe, and North America
Sanmina Corporation Strengths
- Diversified revenue streams across CPS Third Party and IMS segments
- Favorable liquidity and low debt levels
- Higher asset and fixed asset turnover than Fabrinet
- Strong global footprint especially in Americas and Asia Pacific
- Large revenues in IMS segment indicating market strength
Fabrinet Weaknesses
- Net margin is neutral, indicating limited profitability expansion
- Elevated P/E and P/B ratios suggest possible overvaluation
- No dividend yield may deter income-focused investors
- Less diversification with heavy dependence on optical communications
- Moderate market share outside core segments compared to Sanmina
Sanmina Corporation Weaknesses
- Low net margin reflects profitability challenges
- ROE and ROIC are neutral, signaling average capital returns
- P/E remains elevated, hinting at valuation risk
- Dividend yield is zero, limiting shareholder income
- Smaller global presence in Europe/EMEA compared to Fabrinet
Fabrinet excels in profitability and financial health with minimal leverage, benefiting from operational efficiency. Sanmina’s strengths lie in broader diversification and larger market share, especially in Americas and Asia Pacific. Both face valuation and dividend yield limitations, impacting their appeal to certain investor profiles.
The Moat Duel: Analyzing Competitive Defensibility
A structural moat is the only barrier protecting long-term profits from relentless competition erosion. Let’s examine how Fabrinet and Sanmina defend their turf:
Fabrinet: Process Design & Engineering Excellence
Fabrinet’s moat centers on complex manufacturing processes and engineering precision. This drives a very favorable ROIC 6.3% above WACC, reflecting strong value creation and margin stability. New optical and electro-mechanical product launches in 2026 could deepen this moat amid rising demand.
Sanmina Corporation: Scale & Integrated Solutions
Sanmina leverages scale and integrated manufacturing services as its moat, contrasting Fabrinet’s niche focus. However, its ROIC barely exceeds WACC, showing shrinking profitability and eroding value. Expansion into cloud-based manufacturing software offers upside but faces stiff competition.
Precision Engineering vs. Scale Efficiency: Who Holds the Moat Edge?
Fabrinet’s growing ROIC and specialized capabilities give it a deeper moat than Sanmina’s scale-driven but margin-pressured model. I see Fabrinet as better equipped to defend and expand market share in 2026.
Which stock offers better returns?
The past year reveals starkly different price dynamics for Fabrinet and Sanmina Corporation, with Fabrinet showing a strong upward momentum while Sanmina’s gains have slowed recently.
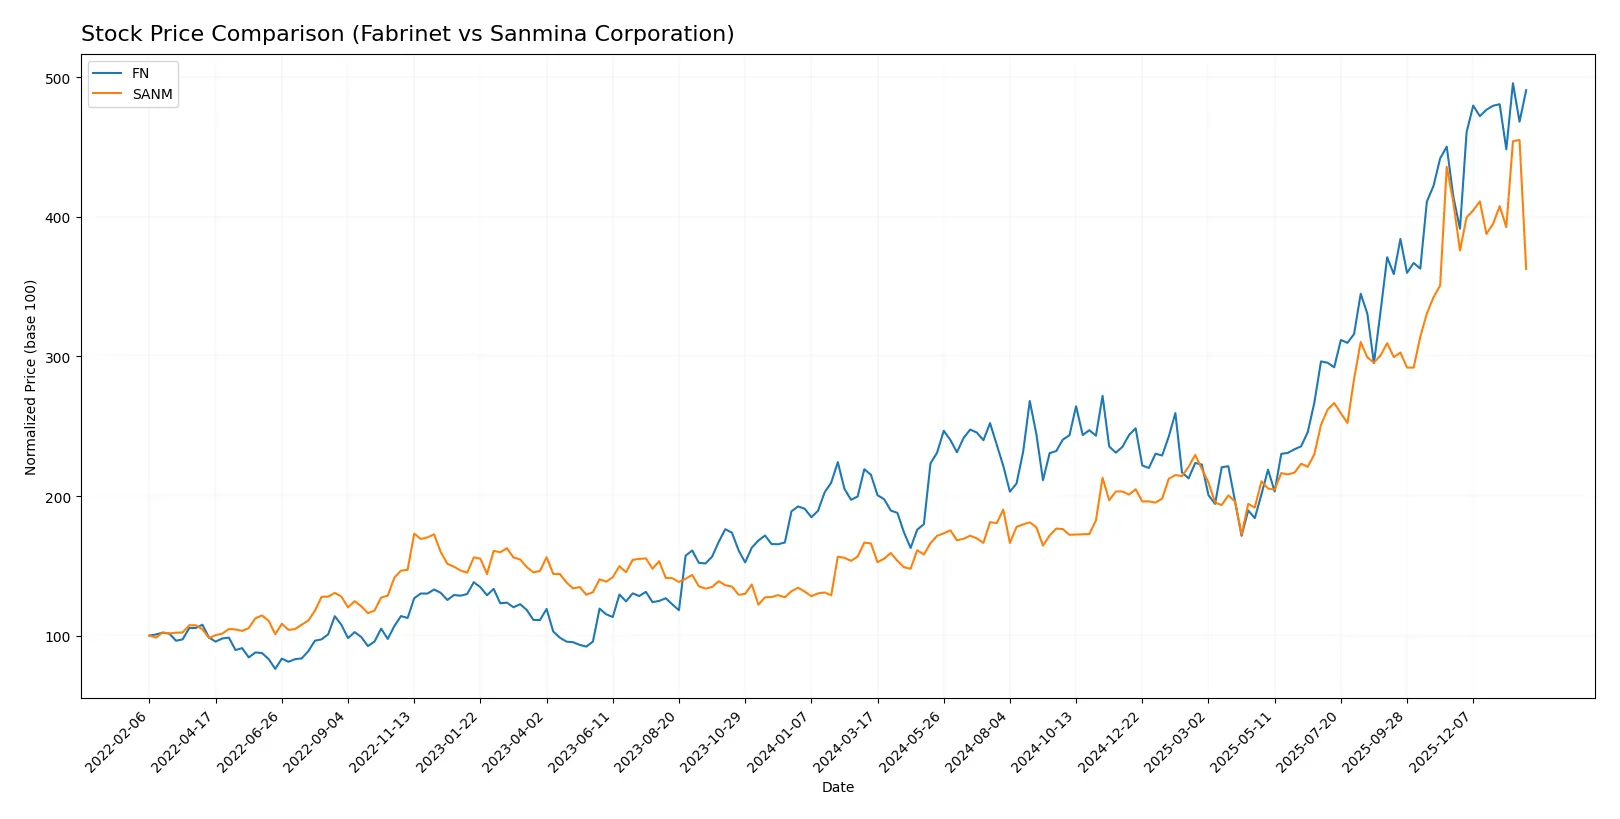
Trend Comparison
Fabrinet’s stock surged 128.09% over the past year, displaying a bullish trend with accelerating price gains and a wide volatility band, reaching a high of 494.45.
Sanmina’s stock rose 118.44% in the same period, also bullish but with decelerating momentum and far lower volatility; it peaked at 177.83 before recent declines.
Comparing both, Fabrinet has delivered the higher market return with accelerating growth, outpacing Sanmina’s slower, decelerating advance.
Target Prices
Analysts project solid upside for Fabrinet and Sanmina based on current consensus targets.
| Company | Target Low | Target High | Consensus |
|---|---|---|---|
| Fabrinet | 537 | 600 | 569 |
| Sanmina Corporation | 200 | 200 | 200 |
Fabrinet’s consensus target of 569 implies a 16% premium to its current 489.44 price. Sanmina’s target at 200 suggests a 41% upside from 141.68. Analysts expect significant appreciation potential in both stocks.

Don’t Let Luck Decide Your Entry Point
Optimize your entry points with our advanced ProRealTime indicators. You’ll get efficient buy signals with precise price targets for maximum performance. Start outperforming now!
How do institutions grade them?
The following tables summarize recent institutional grades for Fabrinet and Sanmina Corporation:
Fabrinet Grades
This table shows recent grading company actions and grades for Fabrinet:
| Grading Company | Action | New Grade | Date |
|---|---|---|---|
| Susquehanna | Maintain | Positive | 2026-01-22 |
| Barclays | Upgrade | Overweight | 2026-01-14 |
| Barclays | Maintain | Equal Weight | 2025-11-05 |
| Needham | Maintain | Buy | 2025-11-04 |
| Rosenblatt | Maintain | Buy | 2025-11-04 |
| JP Morgan | Maintain | Overweight | 2025-11-04 |
| JP Morgan | Maintain | Overweight | 2025-10-16 |
| Rosenblatt | Maintain | Buy | 2025-10-02 |
| JP Morgan | Upgrade | Overweight | 2025-08-25 |
| B. Riley Securities | Maintain | Neutral | 2025-08-19 |
Sanmina Corporation Grades
This table shows recent grading company actions and grades for Sanmina Corporation:
| Grading Company | Action | New Grade | Date |
|---|---|---|---|
| Argus Research | Maintain | Buy | 2026-01-28 |
| B of A Securities | Maintain | Neutral | 2025-07-11 |
| B of A Securities | Maintain | Neutral | 2025-06-09 |
| B of A Securities | Upgrade | Neutral | 2025-01-29 |
| Craig-Hallum | Maintain | Hold | 2024-11-05 |
| Craig-Hallum | Downgrade | Hold | 2024-04-30 |
| Sidoti & Co. | Upgrade | Buy | 2022-11-08 |
| Sidoti & Co. | Upgrade | Buy | 2022-11-07 |
| Sidoti & Co. | Downgrade | Neutral | 2022-10-31 |
| Sidoti & Co. | Downgrade | Neutral | 2022-10-30 |
Which company has the best grades?
Fabrinet consistently receives buy and overweight ratings from major firms, indicating stronger institutional confidence. Sanmina’s grades mostly range from hold to buy, reflecting moderate enthusiasm. Investors might view Fabrinet’s grades as signaling higher growth expectations.
Risks specific to each company
The following categories identify critical pressure points and systemic threats facing Fabrinet and Sanmina Corporation in the 2026 market environment:
1. Market & Competition
Fabrinet
- Faces high competition in optical and precision manufacturing, with a premium valuation possibly limiting market flexibility.
Sanmina Corporation
- Operates in broader integrated manufacturing with intense competition and lower margins, impacting market positioning.
2. Capital Structure & Debt
Fabrinet
- Virtually debt-free with a strong balance sheet; low financial risk.
Sanmina Corporation
- Carries moderate debt (D/E 0.17), increasing leverage risk despite strong interest coverage.
3. Stock Volatility
Fabrinet
- Beta near 1.04 indicates market-comparable volatility; stable trading range.
Sanmina Corporation
- Slightly higher beta at 1.05 with recent sharp price declines, reflecting elevated volatility.
4. Regulatory & Legal
Fabrinet
- Exposed to global manufacturing regulations, particularly in Asia-Pacific; no major legal red flags.
Sanmina Corporation
- Subject to US regulatory environment and defense contracts, adding compliance complexity.
5. Supply Chain & Operations
Fabrinet
- Complex optical supply chains vulnerable to component shortages but benefits from strong process engineering.
Sanmina Corporation
- Broader supply chain with diversified sectors; operational complexity poses risks in logistics and sourcing.
6. ESG & Climate Transition
Fabrinet
- Increasing pressure to meet ESG standards in tech manufacturing; lagging direct disclosures could raise concerns.
Sanmina Corporation
- Faces heightened ESG scrutiny due to defense and aerospace involvement; transition risks moderate.
7. Geopolitical Exposure
Fabrinet
- Significant Asia-Pacific operations expose Fabrinet to regional geopolitical tensions.
Sanmina Corporation
- Primarily US-based but global customer base creates exposure to trade policies and tariffs.
Which company shows a better risk-adjusted profile?
Fabrinet’s most impactful risk is its premium valuation amid competitive pressures, while Sanmina contends with financial leverage risks. Fabrinet’s strong balance sheet and safer Altman Z-score provide a superior risk-adjusted profile. Sanmina’s distressed zone Z-score and recent 8% price drop highlight elevated financial vulnerability.
Final Verdict: Which stock to choose?
Fabrinet’s superpower lies in its durable competitive advantage and efficient capital allocation. It consistently generates returns well above its cost of capital, signaling a robust economic moat. A point of vigilance is its relatively high valuation multiples, which might pressure future returns. Fabrinet suits investors targeting aggressive growth and long-term value creation.
Sanmina’s strategic moat centers on solid operational efficiency and strong free cash flow generation. It offers a more conservative profile with lower leverage but shows signs of declining profitability and value creation. Sanmina appears fit for growth-at-a-reasonable-price (GARP) investors seeking stability with moderate upside potential.
If you prioritize sustained value creation and can tolerate premium valuations, Fabrinet outshines with its growing profitability and strong moat. However, if you seek better stability and a conservative risk profile, Sanmina offers a safer alternative despite weaker growth dynamics. Both present distinct analytical scenarios for specific investor profiles.
Disclaimer: Investment carries a risk of loss of initial capital. The past performance is not a reliable indicator of future results. Be sure to understand risks before making an investment decision.
Go Further
I encourage you to read the complete analyses of Fabrinet and Sanmina Corporation to enhance your investment decisions: