Home > Comparison > Technology > SNDK vs FN
The strategic rivalry between Sandisk Corporation and Fabrinet shapes the Technology sector’s hardware landscape. Sandisk leads as a capital-intensive developer of storage devices, while Fabrinet operates a precision-driven manufacturing and optical packaging service model. This analysis pits Sandisk’s product innovation against Fabrinet’s contract manufacturing expertise. I will evaluate which company’s trajectory presents a superior risk-adjusted opportunity for a diversified portfolio in a competitive industry.
Table of contents
Companies Overview
Sandisk Corporation and Fabrinet stand as key players in the hardware and equipment sector, shaping technology’s backbone globally.
Sandisk Corporation: NAND Flash Storage Pioneer
Sandisk leads in NAND flash technology, producing solid state drives, removable cards, and embedded storage solutions. Its core revenue stems from manufacturing and selling high-performance storage devices. In 2026, Sandisk sharpens its focus on innovation in storage density and speed to maintain its market leadership amid rising data demands.
Fabrinet: Precision Optical Manufacturing Specialist
Fabrinet excels in optical and electro-mechanical manufacturing services for advanced communications and industrial applications. Its revenue derives from producing optical components, lasers, and sensors for data centers and medical industries. In 2026, Fabrinet prioritizes expanding its integrated manufacturing capabilities and supply chain resilience to serve a diverse global clientele.
Strategic Collision: Similarities & Divergences
Both companies thrive in hardware manufacturing but diverge in focus: Sandisk dominates storage technology while Fabrinet specializes in optical and electro-mechanical precision. Their competitive battlefield centers on supplying critical components to high-tech sectors. Investors face distinct profiles — Sandisk offers exposure to fast-evolving data storage, Fabrinet provides a diversified play in precision manufacturing services.
Income Statement Comparison
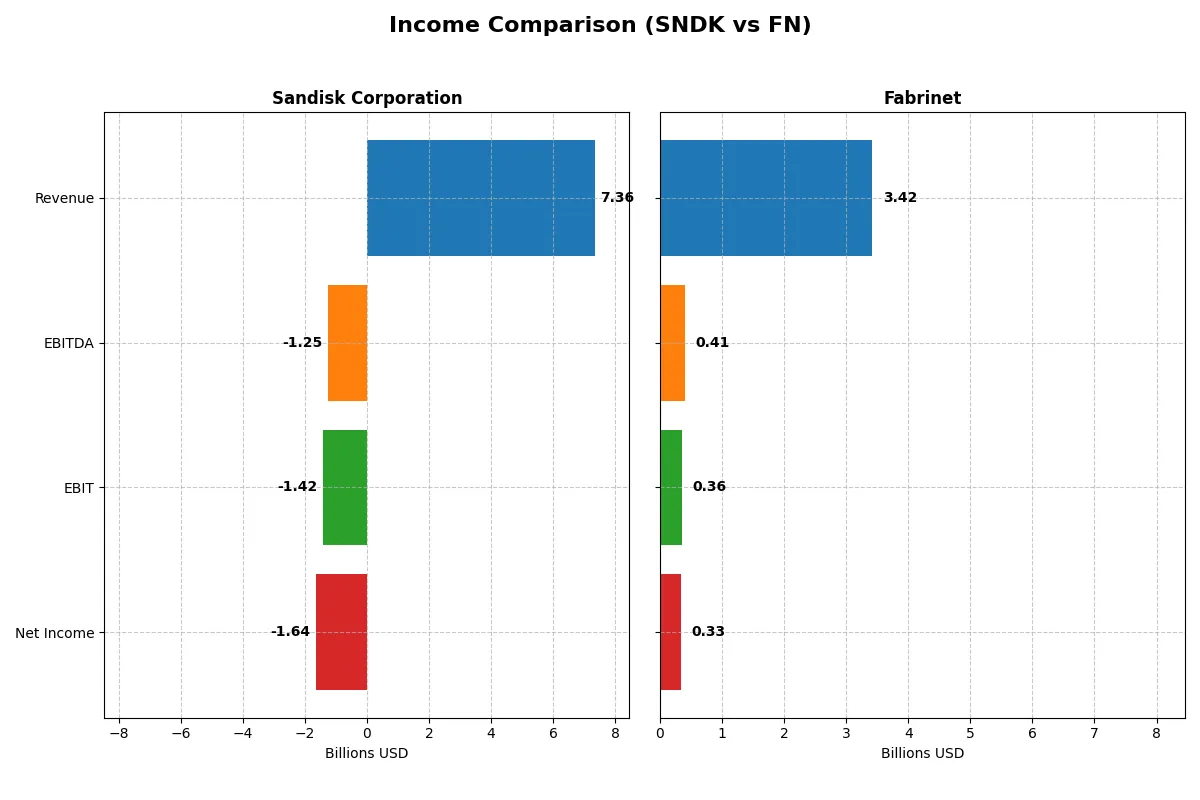
This data dissects the core profitability and scalability of both corporate engines to reveal who dominates the bottom line:
| Metric | Sandisk Corporation (SNDK) | Fabrinet (FN) |
|---|---|---|
| Revenue | 7.36B | 3.42B |
| Cost of Revenue | 5.14B | 3.01B |
| Operating Expenses | 3.59B | 89M |
| Gross Profit | 2.21B | 413M |
| EBITDA | -1.25B | 409M |
| EBIT | -1.42B | 355M |
| Interest Expense | 63M | 0 |
| Net Income | -1.64B | 333M |
| EPS | -11.32 | 9.23 |
| Fiscal Year | 2025 | 2025 |
Income Statement Analysis: The Bottom-Line Duel
This income statement comparison uncovers which company drives true operational efficiency and bottom-line strength in their respective markets.
Sandisk Corporation Analysis
Sandisk’s revenue dropped 25% from 2022 to 2025, ending at $7.35B in 2025. Despite a recovering gross margin of 30%, net income plunged deeper into losses, reaching -$1.64B. Operating inefficiencies and escalating expenses eroded earnings, with a sharp negative EBIT margin of -19%. The fiscal 2025 results reveal persistent struggles to convert sales into profit.
Fabrinet Analysis
Fabrinet posted steady revenue growth, rising 82% over 2021-2025 to $3.42B in 2025. Gross margin remained modest at 12%, but EBIT and net margins held strong at 10% and 9.7%, respectively. Net income climbed to $333M, reflecting disciplined cost control and operational leverage. Fabrinet’s momentum signals improving profitability despite a competitive gross margin landscape.
Margin Resilience vs. Growth Discipline
Fabrinet clearly outperforms Sandisk in profitability and growth consistency. Sandisk’s revenue contraction and deep losses contrast Fabrinet’s expanding top line and healthy margins. Investors seeking resilient earnings and operational discipline find Fabrinet’s profile more attractive, while Sandisk faces a challenging path to restore profitability.
Financial Ratios Comparison
These vital ratios act as a diagnostic tool to expose the underlying fiscal health, valuation premiums, and capital efficiency of the companies compared below:
| Ratios | Sandisk Corporation (SNDK) | Fabrinet (FN) |
|---|---|---|
| ROE | -17.81% | 16.78% |
| ROIC | -11.89% | 15.01% |
| P/E | -4.17 | 32.02 |
| P/B | 0.74 | 5.37 |
| Current Ratio | 3.56 | 3.00 |
| Quick Ratio | 2.11 | 2.28 |
| D/E | 0.22 | 0.003 |
| Debt-to-Assets | 15.73% | 0.19% |
| Interest Coverage | -21.86 | 0 |
| Asset Turnover | 0.57 | 1.21 |
| Fixed Asset Turnover | 11.88 | 8.85 |
| Payout ratio | 0 | 0 |
| Dividend yield | 0 | 0 |
| Fiscal Year | 2025 | 2025 |
Efficiency & Valuation Duel: The Vital Signs
Financial ratios act as a company’s DNA, revealing hidden risks and operational excellence through key profitability and valuation metrics.
Sandisk Corporation
Sandisk shows deeply negative profitability with ROE at -17.8% and net margin at -22.3%, signaling operational struggles. Its valuation metrics, including a negative P/E and a modest P/B of 0.74, suggest undervaluation but reflect distress. The firm pays no dividends, instead investing heavily in R&D (over 15% of revenue), aiming to fuel future growth despite current losses.
Fabrinet
Fabrinet delivers solid profitability with a 16.8% ROE and a positive net margin near 9.7%, demonstrating operational efficiency. However, its valuation appears stretched with a P/E above 32 and P/B at 5.37, reflecting market premium. The company also foregoes dividends but maintains strong free cash flow, likely reinvesting in growth and maintaining a clean balance sheet with zero debt.
Premium Valuation vs. Operational Safety
Fabrinet offers superior profitability and operational health but trades at a premium, increasing valuation risk. Sandisk’s distressed profitability contrasts with a cheaper valuation but higher operational risk. Fabrinet suits investors prioritizing stability and growth, while Sandisk fits those seeking value with caution.
Which one offers the Superior Shareholder Reward?
Sandisk Corporation (SNDK) and Fabrinet (FN) both forgo dividends, focusing on reinvestment and buybacks for shareholder value. Sandisk’s free cash flow is negative (-0.8/share in 2025), limiting buybacks and signaling financial stress. Fabrinet generates solid free cash flow (5.7/share in 2025) and maintains consistent buyback capacity. Fabrinet’s sustainable operating margins (~10%) and prudent capital expenditure coverage (2.7x) underpin its ability to reward shareholders long-term. Sandisk’s negative profitability and cash flow deficits pose risks to distribution sustainability. I conclude Fabrinet offers a far superior total return profile in 2026 due to its robust cash generation and disciplined capital allocation.
Comparative Score Analysis: The Strategic Profile
The radar chart reveals the fundamental DNA and trade-offs of Sandisk Corporation and Fabrinet, highlighting their financial strengths and valuation nuances:
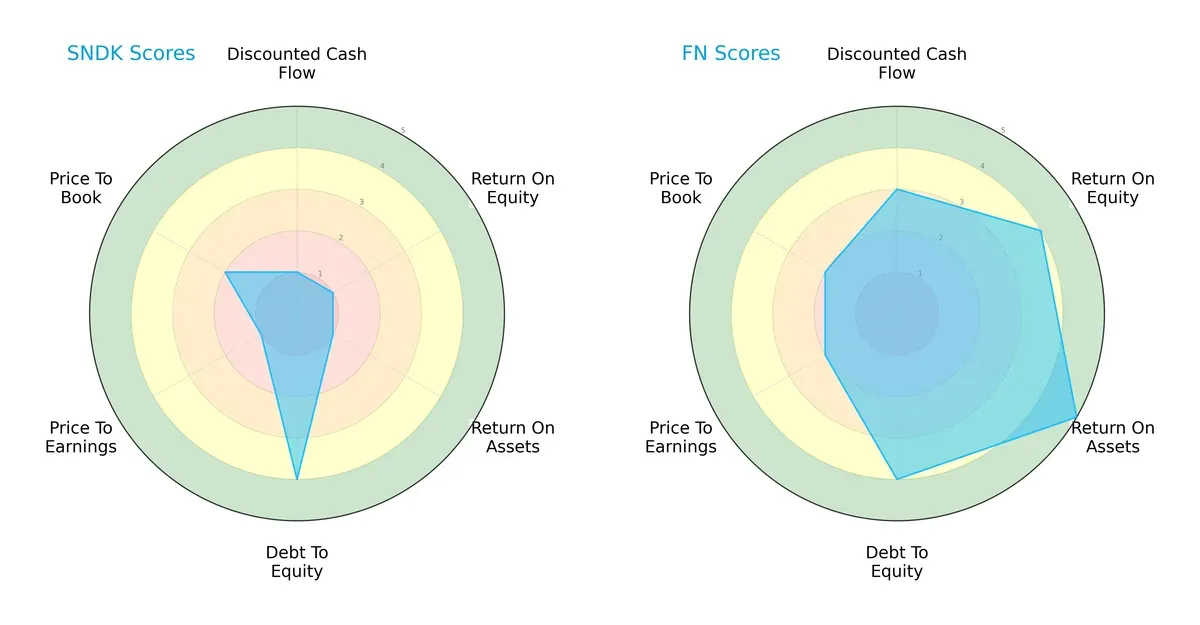
Fabrinet leads with a stronger overall profile, scoring well on ROE (4) and ROA (5), indicating superior profit generation and asset utilization. Sandisk struggles with low DCF, ROE, and ROA scores (all 1), but maintains a solid debt-to-equity position (4). Fabrinet’s profile is balanced, while Sandisk relies mainly on conservative leverage to offset operational weaknesses.
Bankruptcy Risk: Solvency Showdown
Both firms sit comfortably in the safe zone with high Altman Z-Scores, signaling strong long-term solvency and resilience to economic cycles:
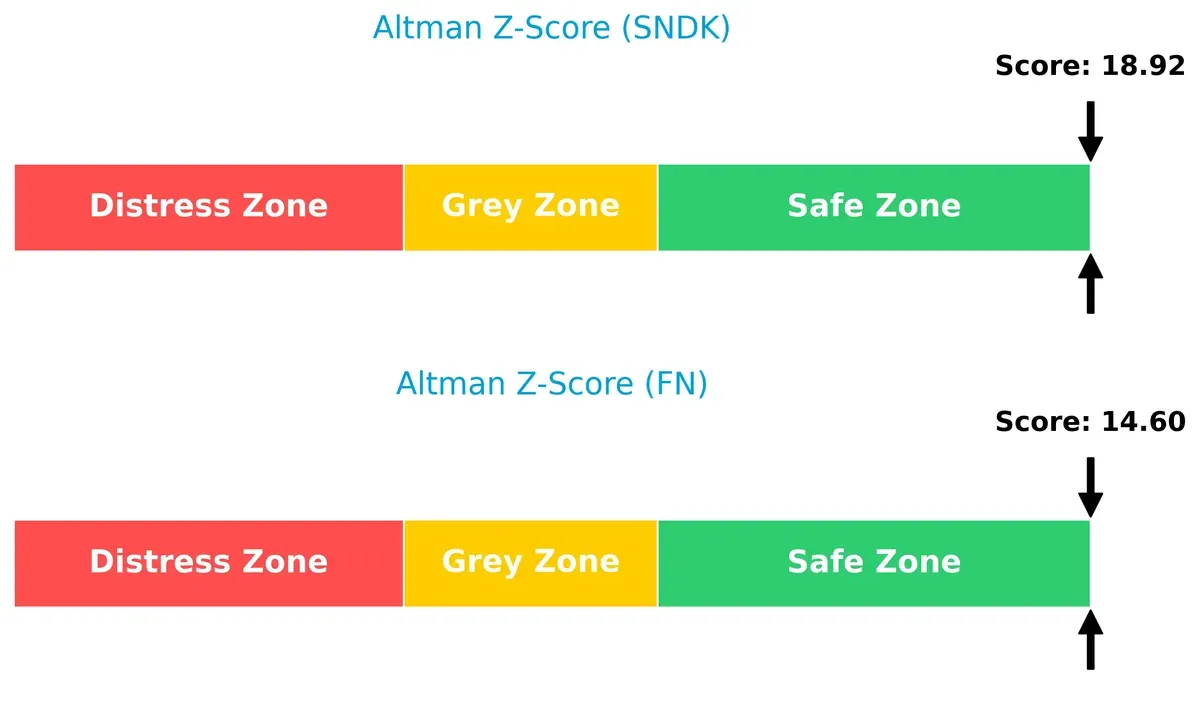
Sandisk posts an exceptionally high Z-Score of 18.9, surpassing Fabrinet’s 14.6, underscoring its robust bankruptcy safety despite weaker operational metrics.
Financial Health: Quality of Operations
Sandisk and Fabrinet both show average Piotroski F-Scores, indicating moderate financial health without glaring red flags in internal operations:
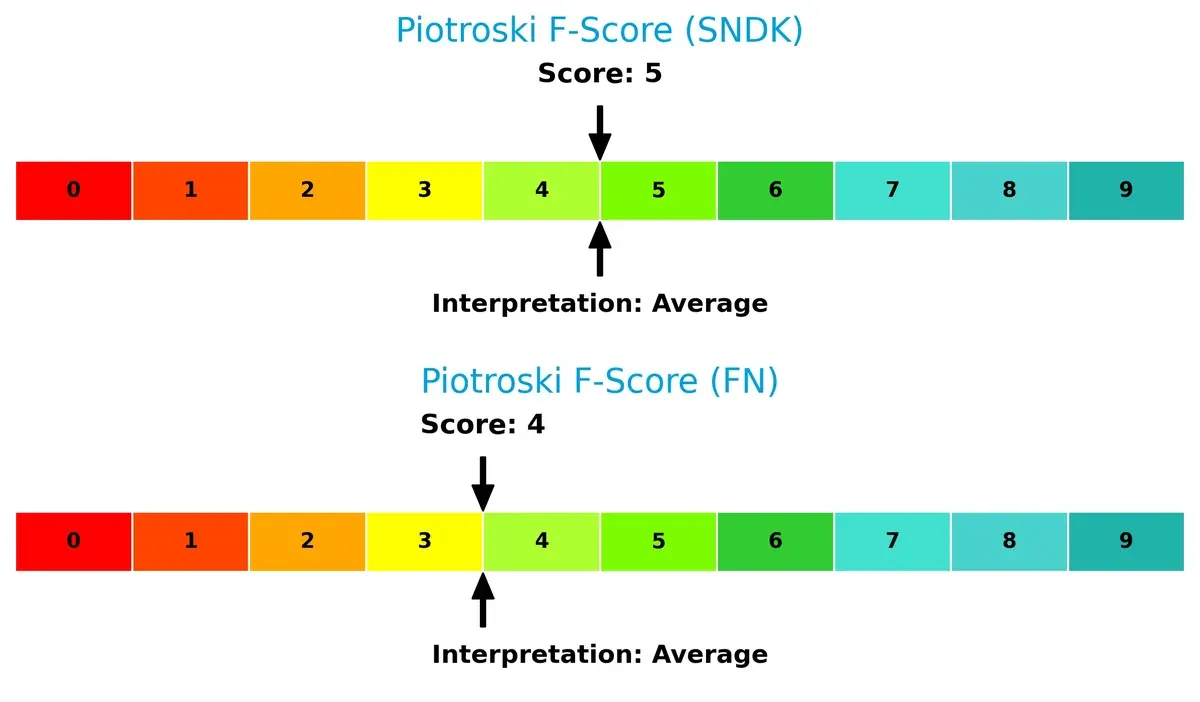
Sandisk scores 5, slightly above Fabrinet’s 4, reflecting marginally better internal financial quality, though neither excels in operational robustness. Investors should watch for improvements in profitability and efficiency metrics.
How are the two companies positioned?
This section dissects the operational DNA of SNDK and FN by comparing their revenue distribution and internal strengths and weaknesses. The goal is to confront their economic moats and reveal which model offers the most resilient competitive advantage today.
Revenue Segmentation: The Strategic Mix
This comparison dissects how Sandisk Corporation and Fabrinet diversify their income streams and where their primary sector bets lie:
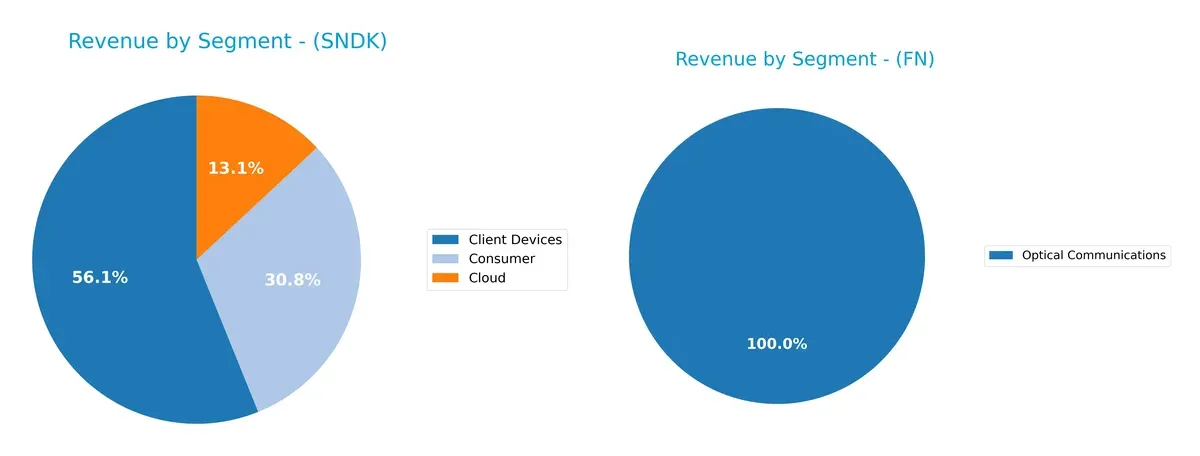
Sandisk anchors its revenue in Client Devices at $4.13B, supported by Consumer ($2.27B) and Cloud ($960M) segments, showing moderate diversification. Fabrinet relies heavily on Optical Communications with $2.62B, dwarfing other segments. Sandisk’s mix suggests ecosystem lock-in across hardware and cloud, while Fabrinet’s concentration signals exposure to optical infrastructure cycles, posing higher concentration risk but also potential dominance in a niche market.
Strengths and Weaknesses Comparison
This table compares the Strengths and Weaknesses of Sandisk Corporation and Fabrinet:
Sandisk Corporation Strengths
- Diverse revenue from Client Devices, Cloud, and Consumer segments
- Significant global presence with strong sales in China, US, and EMEA
- Favorable debt metrics with low debt-to-asset ratio
- High fixed asset turnover indicates efficient use of assets
Fabrinet Strengths
- Strong profitability with favorable ROE and ROIC
- Favorable liquidity ratios and zero debt strengthen financial stability
- Robust asset turnover signals operational efficiency
- Well diversified geographically with North America, Asia Pacific, and Europe exposure
Sandisk Corporation Weaknesses
- Negative net margin, ROE, and ROIC indicate profitability challenges
- High WACC raises capital costs
- Unfavorable interest coverage ratio suggests financial stress
- Limited product segment diversification compared to FN
Fabrinet Weaknesses
- High P/E and P/B ratios may reflect overvaluation risk
- Negative dividend yield could deter income-focused investors
- Less product diversification, mainly Optical Communications
Sandisk shows strengths in geographic and product diversification but struggles with profitability and capital efficiency. Fabrinet excels in profitability and balance sheet strength but carries valuation risks and narrower product scope. These contrasts highlight different strategic challenges and operational focuses.
The Moat Duel: Analyzing Competitive Defensibility
A structural moat is the only true shield protecting long-term profits from relentless competition erosion. Let’s dissect the competitive moats of two industry players:
Sandisk Corporation: Legacy Cost Advantage Under Pressure
Sandisk’s moat lies in its cost advantage through NAND flash technology mastery. Historically, this yielded strong gross margins near 30%. However, declining ROIC and negative net margins in 2025 signal value destruction. The moat risks erosion unless new products or market pivots revitalize profitability.
Fabrinet: Precision Manufacturing with Growing ROIC Moat
Fabrinet’s moat stems from specialized manufacturing capabilities and supply chain integration, contrasting Sandisk’s tech-centric moat. It consistently grows ROIC above WACC, delivering double-digit EBIT margins and rising revenues. Expansion in optical and electro-mechanical segments could widen this moat further in 2026.
Cost Leadership vs. Operational Excellence: The Moat Verdict
Fabrinet boasts a deeper, more durable moat evidenced by positive ROIC trends and strong margin growth. Sandisk’s legacy cost advantage is faltering amid profitability declines. Fabrinet stands better equipped to defend and expand its market share in 2026.
Which stock offers better returns?
Both Sandisk Corporation and Fabrinet show significant price appreciation over the past year, with strong buying interest and clear upward momentum driving their trading dynamics.
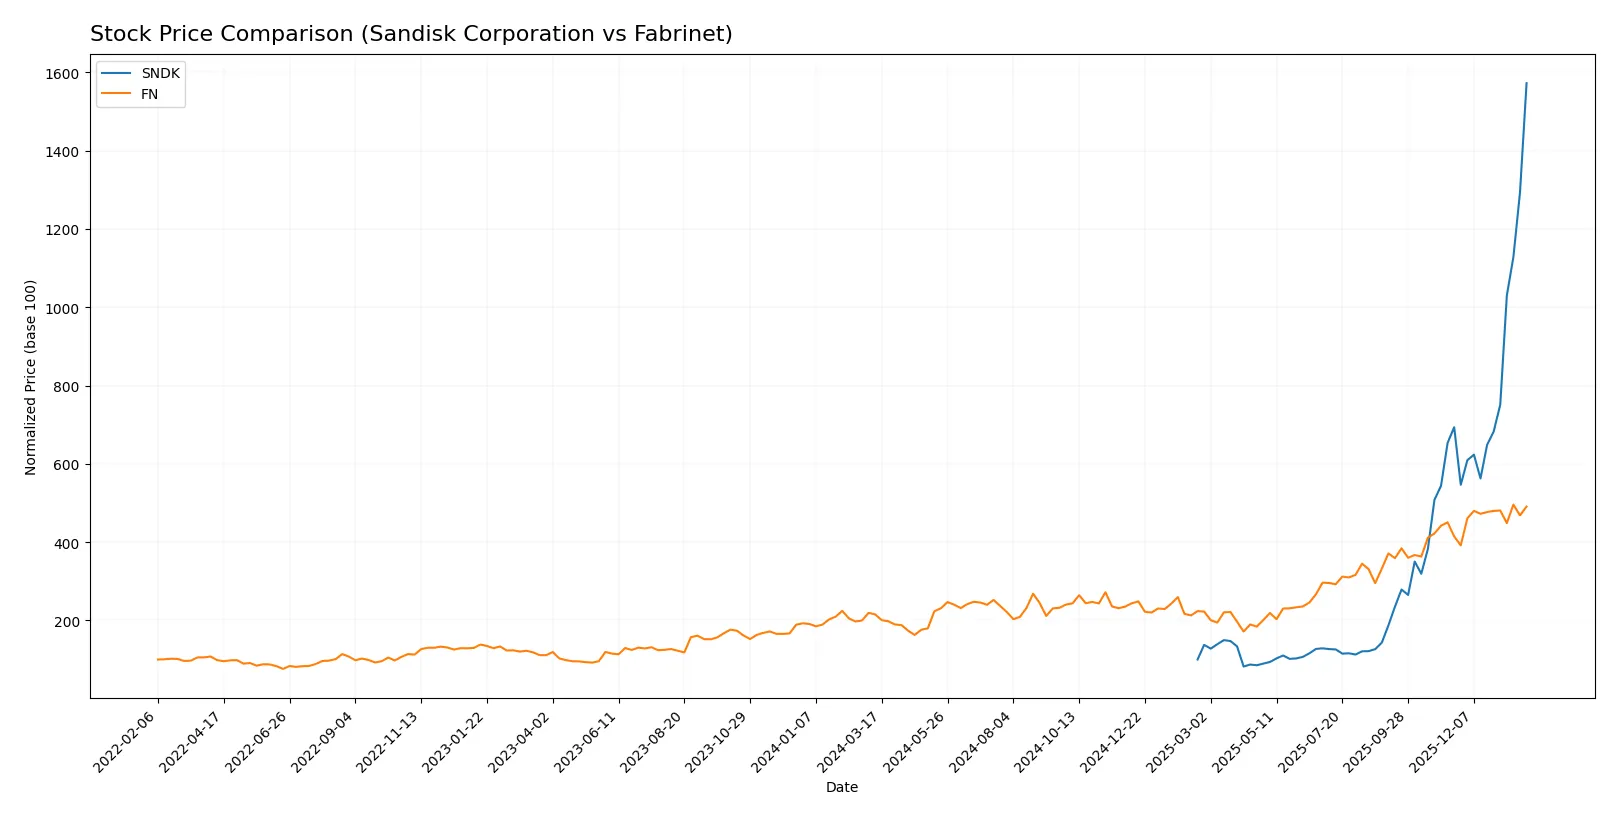
Trend Comparison
Sandisk’s stock surged 1472.31% over the past year, marking a bullish trend with accelerating gains. It ranged from 30.11 to a high of 576.25, reflecting pronounced volatility (std dev 125.16).
Fabrinet gained 128.09% in the same period, also bullish with acceleration. Its price moved between 162.32 and 494.45, showing lower volatility than Sandisk (std dev 90.27).
Sandisk outperformed Fabrinet by a wide margin, delivering substantially higher returns and stronger acceleration in price growth over the past year.
Target Prices
Analysts show a broad but optimistic consensus on target prices for Sandisk Corporation and Fabrinet.
| Company | Target Low | Target High | Consensus |
|---|---|---|---|
| Sandisk Corporation | 220 | 1,000 | 615 |
| Fabrinet | 537 | 600 | 569 |
Sandisk’s consensus target of 615 suggests moderate upside from its 576 current price, reflecting volatility in hardware sectors. Fabrinet’s 569 target indicates a potential rebound above its current 489 price, signaling cautious optimism.

Don’t Let Luck Decide Your Entry Point
Optimize your entry points with our advanced ProRealTime indicators. You’ll get efficient buy signals with precise price targets for maximum performance. Start outperforming now!
How do institutions grade them?
Sandisk Corporation Grades
The following table summarizes recent grades issued by reputable financial institutions for Sandisk Corporation:
| Grading Company | Action | New Grade | Date |
|---|---|---|---|
| Jefferies | Maintain | Buy | 2026-01-30 |
| RBC Capital | Maintain | Sector Perform | 2026-01-30 |
| Goldman Sachs | Maintain | Buy | 2026-01-30 |
| Morgan Stanley | Maintain | Overweight | 2026-01-30 |
| Cantor Fitzgerald | Maintain | Overweight | 2026-01-30 |
| Wedbush | Maintain | Outperform | 2026-01-30 |
| Citigroup | Maintain | Buy | 2026-01-20 |
| Wells Fargo | Maintain | Equal Weight | 2026-01-15 |
| Benchmark | Maintain | Buy | 2026-01-15 |
| Bernstein | Maintain | Outperform | 2026-01-14 |
Fabrinet Grades
This table presents recent institutional grades for Fabrinet from established financial firms:
| Grading Company | Action | New Grade | Date |
|---|---|---|---|
| Susquehanna | Maintain | Positive | 2026-01-22 |
| Barclays | Upgrade | Overweight | 2026-01-14 |
| Barclays | Maintain | Equal Weight | 2025-11-05 |
| Needham | Maintain | Buy | 2025-11-04 |
| Rosenblatt | Maintain | Buy | 2025-11-04 |
| JP Morgan | Maintain | Overweight | 2025-11-04 |
| JP Morgan | Maintain | Overweight | 2025-10-16 |
| Rosenblatt | Maintain | Buy | 2025-10-02 |
| JP Morgan | Upgrade | Overweight | 2025-08-25 |
| B. Riley Securities | Maintain | Neutral | 2025-08-19 |
Which company has the best grades?
Sandisk Corporation consistently receives strong buy and outperform ratings from top-tier firms, signaling robust institutional confidence. Fabrinet also holds positive grades with upgrades to overweight, but Sandisk’s broader consensus and higher-grade endorsements could influence investor preference toward greater stability and potential growth.
Risks specific to each company
The following categories identify critical pressure points and systemic threats facing Sandisk Corporation and Fabrinet in the 2026 market environment:
1. Market & Competition
Sandisk Corporation
- Faces intense competition with volatile pricing, reflected in negative net margin and ROIC.
Fabrinet
- Benefits from diversified client base with stable margins and superior asset turnover.
2. Capital Structure & Debt
Sandisk Corporation
- Low debt-to-equity ratio (0.22) but weak interest coverage signals financial stress.
Fabrinet
- Virtually no debt and excellent interest coverage support strong financial flexibility.
3. Stock Volatility
Sandisk Corporation
- High beta of 4.89 indicates extreme stock price swings and market sensitivity.
Fabrinet
- Beta near 1.04 reflects moderate volatility aligned with the broader market.
4. Regulatory & Legal
Sandisk Corporation
- US-based, exposed to stringent regulations but benefits from stable legal environment.
Fabrinet
- Cayman Islands domicile may pose regulatory uncertainties but offers tax advantages.
5. Supply Chain & Operations
Sandisk Corporation
- Heavy reliance on NAND flash technology exposes it to supply shortages and tech shifts.
Fabrinet
- Diversified manufacturing services reduce exposure to any single supply chain disruption.
6. ESG & Climate Transition
Sandisk Corporation
- Limited ESG disclosure poses reputational risks in a tech sector increasingly focused on sustainability.
Fabrinet
- Growing emphasis on advanced manufacturing processes with potential ESG compliance benefits.
7. Geopolitical Exposure
Sandisk Corporation
- US-centric operations face risks from trade tensions and export controls.
Fabrinet
- Global footprint including Asia-Pacific and Europe spreads geopolitical risk effectively.
Which company shows a better risk-adjusted profile?
Sandisk’s largest risk is its poor profitability and negative returns amid high stock volatility. Fabrinet’s most pressing risk is exposure to regulatory complexity linked to its Cayman Islands base. Fabrinet shows a better risk-adjusted profile, supported by stronger financial ratios and stable operational diversification. Notably, Sandisk’s beta near 5 signals outsized market swings that amplify risk, while Fabrinet’s low leverage and solid Altman Z-score reinforce its resilience.
Final Verdict: Which stock to choose?
Sandisk Corporation’s superpower lies in its resilient liquidity and asset turnover, reflecting operational agility despite current profitability struggles. Its value destruction and declining ROIC serve as a crucial point of vigilance. This stock might suit investors with a high tolerance for turnaround risk and a focus on potential deep-value recovery.
Fabrinet stands out with a durable competitive moat demonstrated by strong and growing ROIC above WACC. Its strategic advantage includes operational efficiency and solid financial health, providing better stability than Sandisk. Fabrinet appears more fitting for portfolios seeking steady growth with a moderate risk appetite.
If you prioritize resilient cash flow and value rebound potential, Sandisk might be the compelling choice despite its financial headwinds. However, if you seek consistent profitability and a proven competitive moat, Fabrinet offers better stability and a durable growth trajectory, commanding a premium in valuation accordingly.
Disclaimer: Investment carries a risk of loss of initial capital. The past performance is not a reliable indicator of future results. Be sure to understand risks before making an investment decision.
Go Further
I encourage you to read the complete analyses of Sandisk Corporation and Fabrinet to enhance your investment decisions: