Fabrinet and Novanta Inc. are two prominent players in the hardware, equipment, and parts industry, specializing in advanced optical and photonics technologies. While Fabrinet focuses on precision optical manufacturing and electro-mechanical services globally, Novanta excels in photonics, vision, and precision motion components primarily for medical and industrial markets. This comparison highlights their innovation strategies and market positioning to help you identify the most promising investment opportunity. Let’s explore which company stands out for your portfolio.

Table of contents
Companies Overview
I will begin the comparison between Fabrinet and Novanta Inc. by providing an overview of these two companies and their main differences.
Fabrinet Overview
Fabrinet specializes in optical packaging and precision manufacturing services across North America, Asia-Pacific, and Europe. Its capabilities include process design, supply chain management, and advanced assembly for optical and electro-mechanical components. Fabrinet serves OEMs in optical communications, industrial lasers, automotive sensors, and medical devices, positioning itself as a comprehensive manufacturer in the hardware and equipment sector.
Novanta Inc. Overview
Novanta Inc. designs and manufactures photonics, vision, and precision motion components and sub-systems for medical and industrial markets globally. Its diverse product portfolio includes laser scanning, medical visualization, and motion control solutions. Novanta markets its products under multiple brands and distributes through direct sales and partners, focusing on specialized applications in medical imaging, industrial processing, and robotic technologies.
Key similarities and differences
Both Fabrinet and Novanta operate in the hardware and equipment industry, delivering advanced optical and electronic components to OEMs. Fabrinet emphasizes comprehensive manufacturing services with a broad geographic footprint, while Novanta focuses on photonics and precision motion technologies with a strong presence in medical and industrial sectors. Their business models differ in scope: Fabrinet primarily offers contract manufacturing, whereas Novanta integrates product design and branded sales.
Income Statement Comparison
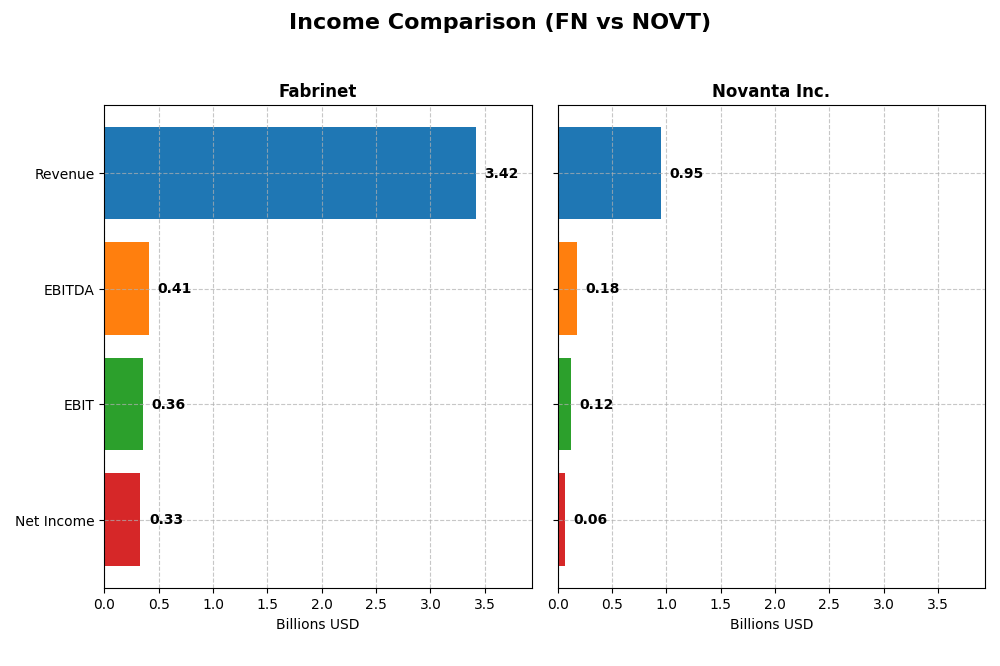
Below is a comparison of the key income statement metrics for Fabrinet and Novanta Inc. for their most recent fiscal years.
| Metric | Fabrinet (FN) | Novanta Inc. (NOVT) |
|---|---|---|
| Market Cap | 16.8B | 4.7B |
| Revenue | 3.42B | 949M |
| EBITDA | 409M | 180M |
| EBIT | 355M | 124M |
| Net Income | 333M | 64.1M |
| EPS | 9.23 | 1.78 |
| Fiscal Year | 2025 | 2024 |
Income Statement Interpretations
Fabrinet
Fabrinet’s revenue rose steadily from $1.88B in 2021 to $3.42B in 2025, with net income expanding from $148M to $333M. Margins mostly improved, with a gross margin near 12% and net margin around 9.7% in the latest year. In 2025, revenue growth accelerated to 18.6%, and EPS increased 13.2%, though net margin slightly contracted.
Novanta Inc.
Novanta’s revenue grew from $591M in 2020 to $949M in 2024, with net income increasing from $45M to $64M. Margins remain stronger than Fabrinet’s, with a 44.4% gross margin and 6.75% net margin in 2024. However, recent growth slowed, with a 7.7% revenue increase and a notable 18.3% decline in net margin year-over-year.
Which one has the stronger fundamentals?
Fabrinet shows stronger revenue and net income growth rates overall, with favorable margin improvements and earnings per share gains. Novanta benefits from higher gross margins but faces recent margin compression and slower growth. Both have favorable overall income statement evaluations, though Fabrinet’s metrics indicate more consistent expansion and margin stability.
Financial Ratios Comparison
The table below presents a side-by-side comparison of key financial ratios for Fabrinet (FN) and Novanta Inc. (NOVT) based on their most recent fiscal year data.
| Ratios | Fabrinet (FN) 2025 | Novanta Inc. (NOVT) 2024 |
|---|---|---|
| ROE | 16.8% | 8.6% |
| ROIC | 15.0% | 7.3% |
| P/E | 32.0 | 85.7 |
| P/B | 5.37 | 7.37 |
| Current Ratio | 3.00 | 2.58 |
| Quick Ratio | 2.28 | 1.72 |
| D/E (Debt to Equity) | 0.003 | 0.63 |
| Debt-to-Assets | 0.002 | 0.34 |
| Interest Coverage | 0 | 3.51 |
| Asset Turnover | 1.21 | 0.68 |
| Fixed Asset Turnover | 8.85 | 6.08 |
| Payout Ratio | 0 | 0 |
| Dividend Yield | 0% | 0% |
Interpretation of the Ratios
Fabrinet
Fabrinet exhibits mostly favorable financial ratios, including a strong return on equity of 16.78% and return on invested capital of 15.01%, supported by a solid current ratio of 3.0 and zero debt-to-equity ratio. However, valuation metrics such as a high PE ratio of 32.02 and PB of 5.37 are unfavorable. The company does not pay dividends, reflecting a likely reinvestment strategy or growth focus.
Novanta Inc.
Novanta’s ratios present a mixed picture with some neutral and unfavorable metrics. Return on equity is relatively low at 8.59%, and the weighted average cost of capital is high at 10.82%, indicating some financial pressure. The PE ratio is elevated at 85.7, with a price-to-book ratio of 7.37 also unfavorable. Novanta does not pay dividends, likely prioritizing reinvestment or R&D.
Which one has the best ratios?
Fabrinet shows a more favorable overall ratio profile with 64.29% favorable metrics, especially in profitability and liquidity, compared to Novanta’s 21.43% favorable ratios. Despite some valuation concerns, Fabrinet’s stronger operational efficiency and balance sheet metrics make its ratios comparatively better than Novanta’s slightly unfavorable profile.
Strategic Positioning
This section compares the strategic positioning of Fabrinet and Novanta Inc., focusing on Market position, Key segments, and Exposure to technological disruption:
Fabrinet
- Leading manufacturer in optical packaging and electro-mechanical services with global reach.
- Key segments include Optical Communications and Lasers, Sensors, and Other industrial lasers.
- Exposure to technological disruption from advancements in optical communications and sensors.
Novanta Inc.
- Designs and sells photonics, vision, and precision motion components mainly for medical and industrial markets.
- Diverse segments: Photonics, Precision Motion, Vision, Robotics, Advanced Surgery, and Precision Medicine.
- Exposure to disruption from innovations in photonics, medical imaging, and robotic automation technologies.
Fabrinet vs Novanta Inc. Positioning
Fabrinet has a more concentrated focus on optical communications and industrial lasers, benefiting from scale in these areas. Novanta Inc. pursues a diversified approach across medical and industrial photonics, vision, and precision motion, offering broader market exposure but potentially higher complexity.
Which has the best competitive advantage?
Fabrinet demonstrates a very favorable moat with value creation and growing ROIC, indicating durable competitive advantage. Novanta Inc. shows slightly unfavorable moat status with value destruction despite improving profitability, suggesting weaker competitive advantage.
Stock Comparison
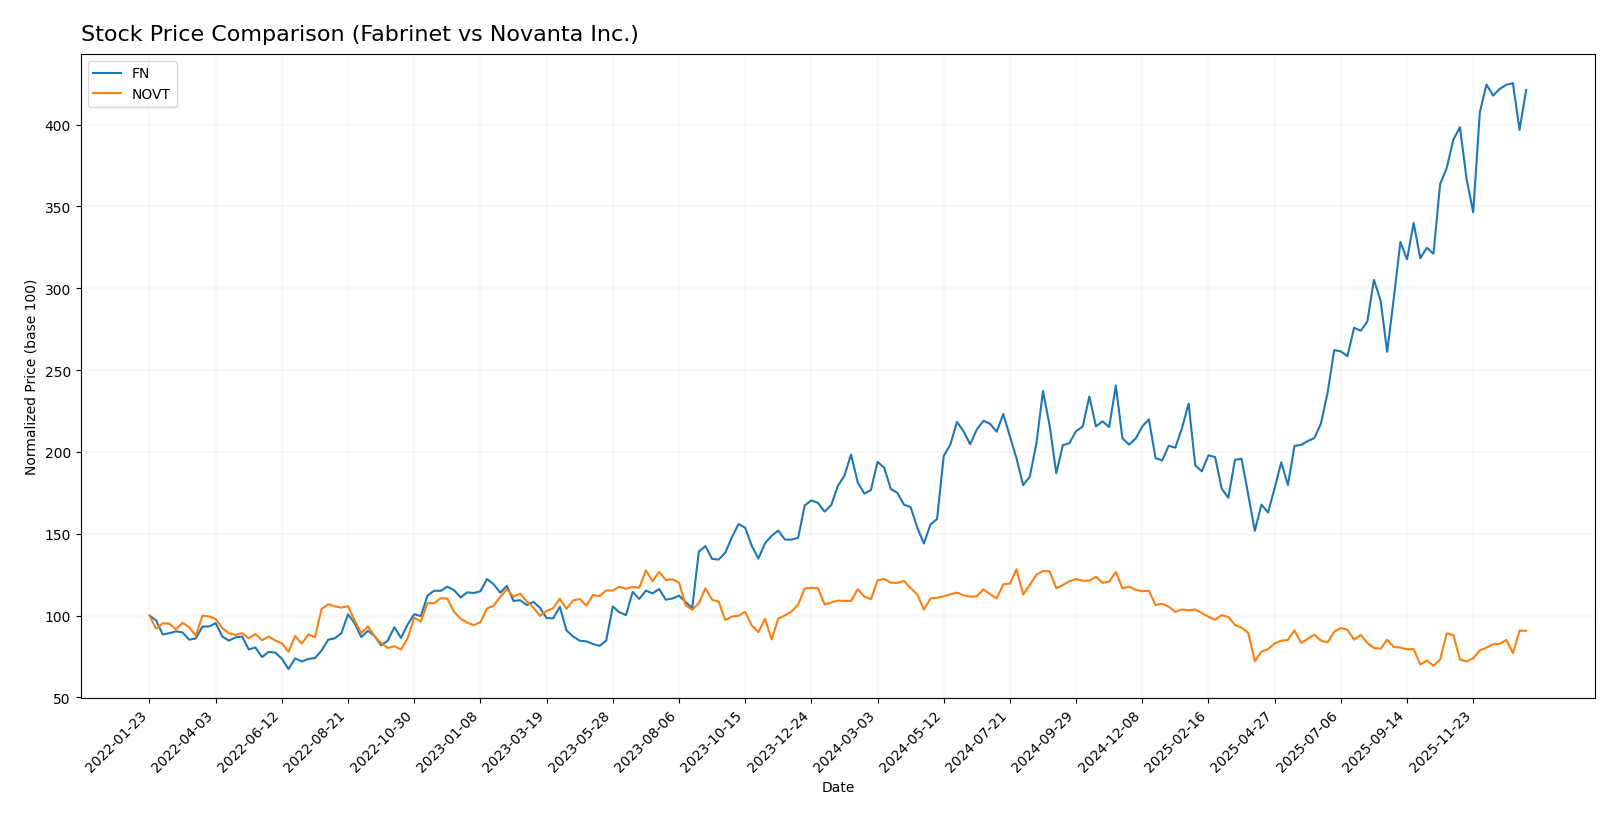
The stock price movements over the past year reveal a strong bullish trend for Fabrinet with significant gains and accelerating momentum, while Novanta Inc. experiences a bearish trend with declining prices despite recent modest recovery.
Trend Analysis
Fabrinet (FN) shows a 138.43% price increase over the past 12 months, indicating a bullish trend with acceleration, a high volatility level (std deviation 85.6), and a notable price range from 162.32 to 479.42.
Novanta Inc. (NOVT) experienced a 17.44% price decline over the same period, reflecting a bearish trend despite acceleration and lower volatility (std deviation 25.04), with prices ranging between 99.96 and 185.16.
Comparing trends, Fabrinet delivered the highest market performance with a substantial positive return, contrasting Novanta’s negative overall price change during the analyzed year.
Target Prices
Analysts present a confident target price consensus for Fabrinet and Novanta Inc.
| Company | Target High | Target Low | Consensus |
|---|---|---|---|
| Fabrinet | 600 | 537 | 568.5 |
| Novanta Inc. | 160 | 160 | 160 |
Fabrinet’s target consensus at 568.5 significantly exceeds its current price of 469.73, indicating upside potential. Novanta’s consensus target of 160 also surpasses its current 130.73 price, suggesting moderate growth expectations from analysts.
Analyst Opinions Comparison
This section compares analysts’ ratings and grades for Fabrinet and Novanta Inc.:
Rating Comparison
Fabrinet Rating
- Rating: A-, categorized as Very Favorable.
- Discounted Cash Flow Score: 3, a Moderate rating.
- ROE Score: 4, indicating Favorable performance.
- ROA Score: 5, rated Very Favorable for asset use.
- Debt To Equity Score: 5, Very Favorable balance sheet.
Novanta Inc. Rating
- Rating: C+, categorized as Very Favorable.
- Discounted Cash Flow Score: 3, a Moderate rating.
- ROE Score: 3, indicating Moderate performance.
- ROA Score: 3, Moderate score for asset efficiency.
- Debt To Equity Score: 1, Very Unfavorable risk level.
Which one is the best rated?
Based strictly on the provided data, Fabrinet is better rated overall with a higher rating (A- vs C+), stronger ROE and ROA scores, and a significantly better debt to equity score compared to Novanta Inc.
Scores Comparison
The comparison of Fabrinet and Novanta Inc. scores is as follows:
Fabrinet Scores
- Altman Z-Score: 13.79, indicating a strong safe zone
- Piotroski Score: 4, representing average financial health
Novanta Inc. Scores
- Altman Z-Score: 5.39, also in the safe zone
- Piotroski Score: 6, showing above-average strength
Which company has the best scores?
Fabrinet has a higher Altman Z-Score, suggesting better financial stability, while Novanta Inc. has a stronger Piotroski Score, indicating better overall financial health. Both companies are in the safe zone for bankruptcy risk.
Grades Comparison
Here is the grades comparison for Fabrinet and Novanta Inc. from recognized grading companies:
Fabrinet Grades
The table below shows recent ratings and grades from reputable financial institutions for Fabrinet:
| Grading Company | Action | New Grade | Date |
|---|---|---|---|
| Barclays | Maintain | Equal Weight | 2025-11-05 |
| Needham | Maintain | Buy | 2025-11-04 |
| JP Morgan | Maintain | Overweight | 2025-11-04 |
| Rosenblatt | Maintain | Buy | 2025-11-04 |
| JP Morgan | Maintain | Overweight | 2025-10-16 |
| Rosenblatt | Maintain | Buy | 2025-10-02 |
| JP Morgan | Upgrade | Overweight | 2025-08-25 |
| B. Riley Securities | Maintain | Neutral | 2025-08-19 |
| Needham | Maintain | Buy | 2025-08-19 |
| Rosenblatt | Maintain | Buy | 2025-08-19 |
Fabrinet’s overall grades trend positively, with multiple “Buy” and “Overweight” ratings sustained and occasional upgrades.
Novanta Inc. Grades
The table below presents recent ratings and grades from recognized financial institutions for Novanta Inc.:
| Grading Company | Action | New Grade | Date |
|---|---|---|---|
| Baird | Maintain | Neutral | 2025-08-11 |
| Baird | Maintain | Neutral | 2025-03-03 |
| Baird | Maintain | Neutral | 2024-11-06 |
| Baird | Maintain | Neutral | 2024-08-07 |
| Baird | Maintain | Neutral | 2023-05-11 |
| Baird | Maintain | Neutral | 2023-05-10 |
| William Blair | Upgrade | Outperform | 2022-05-11 |
| William Blair | Upgrade | Outperform | 2022-05-10 |
| Berenberg | Maintain | Hold | 2020-11-13 |
| Baird | Maintain | Neutral | 2020-05-13 |
Novanta Inc.’s grades show a consistent “Neutral” rating with occasional upgrades to “Outperform” but no recent upgrades since 2022.
Which company has the best grades?
Fabrinet has received better grades overall, with a strong consensus “Buy” and several “Overweight” and “Buy” ratings, indicating more positive analyst sentiment compared to Novanta Inc.’s predominantly “Neutral” consensus. This difference may affect investor perception and portfolio positioning.
Strengths and Weaknesses
Below is a comparison table highlighting key strengths and weaknesses of Fabrinet (FN) and Novanta Inc. (NOVT) based on their most recent data.
| Criterion | Fabrinet (FN) | Novanta Inc. (NOVT) |
|---|---|---|
| Diversification | Primarily focused on Optical Communications (2.62B USD in 2025), with growing segments in Lasers and Sensors | Diversified across Precision Manufacturing, Robotics, Advanced Surgery, and Precision Medicine (~950M USD total in 2024) |
| Profitability | Strong profitability with ROIC 15.01% > WACC 8.63%, ROE 16.78%, net margin 9.72% (favorable overall) | Lower profitability: ROIC 7.25% < WACC 10.82%, ROE 8.59%, net margin 6.75% (slightly unfavorable) |
| Innovation | Consistent growth in ROIC (+19.9%), indicating efficient capital use and innovation in optical tech | ROIC improving (+9.0%) but still below WACC, signaling progress but overall value destruction |
| Global presence | Significant global exposure via Optical Communications, serving telecom and data centers | Broad international footprint with advanced medical and industrial technologies |
| Market Share | Leading in optical components manufacturing with steady revenue growth | Niche player in precision and medical technologies but facing competitive pressures |
Fabrinet stands out with strong profitability, a very favorable economic moat, and focused leadership in the optical communications sector, making it a value creator. Novanta, while diversified and innovating, struggles with profitability below its cost of capital, suggesting caution despite some improvements. Investors should weigh Fabrinet’s stable returns against Novanta’s growth potential but higher risk.
Risk Analysis
Below is a comparison table highlighting key risk factors for Fabrinet (FN) and Novanta Inc. (NOVT) as of their most recent fiscal years:
| Metric | Fabrinet (FN) | Novanta Inc. (NOVT) |
|---|---|---|
| Market Risk | Beta 1.035 (moderate) | Beta 1.603 (higher volatility) |
| Debt Level | Very low debt, D/E = 0.0 (favorable) | Moderate debt, D/E = 0.63 (neutral) |
| Regulatory Risk | Moderate (global manufacturing exposure) | Moderate (medical and industrial sectors) |
| Operational Risk | Complex supply chain across multiple continents | Diverse product lines but smaller scale |
| Environmental Risk | Moderate (manufacturing footprint) | Moderate (industrial and medical product impact) |
| Geopolitical Risk | Exposure to Asia-Pacific manufacturing hubs | Primarily US-based, lower geopolitical risk |
Fabrinet’s low debt and solid operational footing reduce financial risk, but market fluctuations and geopolitical tensions in Asia-Pacific remain key vulnerabilities. Novanta faces higher market volatility and moderate leverage, with operational risks tied to its specialized technology segments. Both require monitoring regulatory developments closely.
Which Stock to Choose?
Fabrinet (FN) has shown strong income growth with an 18.6% revenue increase in 2025 and favorable profitability ratios, including a 16.78% ROE and 15.01% ROIC. It maintains low debt and a very favorable rating (A-) supported by a durable competitive advantage.
Novanta Inc. (NOVT) exhibits moderate income growth of 7.67% in 2024 and neutral to unfavorable financial ratios, such as an 8.59% ROE and 7.25% ROIC. Its debt levels are higher, reflected in a slightly unfavorable rating (C+) and signs of value destruction despite improving profitability.
Investors seeking growth and strong value creation might find Fabrinet’s metrics more appealing, while those willing to accept higher risk with some profitability improvement could see Novanta as a potential opportunity. The choice may appear contingent on the investor’s risk tolerance and focus on either stability or turnaround potential.
Disclaimer: Investment carries a risk of loss of initial capital. The past performance is not a reliable indicator of future results. Be sure to understand risks before making an investment decision.
Go Further
I encourage you to read the complete analyses of Fabrinet and Novanta Inc. to enhance your investment decisions: