Fabrinet and MKS Inc. are two prominent players in the hardware, equipment, and parts sector, specializing in advanced manufacturing technologies for high-growth industries like semiconductors and photonics. Both companies drive innovation through precision engineering and process control solutions, serving overlapping markets including industrial tech and life sciences. In this article, I will analyze their strengths and risks to help you decide which company offers the most compelling investment opportunity in 2026.

Table of contents
Companies Overview
I will begin the comparison between Fabrinet and MKS Inc. by providing an overview of these two companies and their main differences.
Fabrinet Overview
Fabrinet specializes in optical packaging and precision manufacturing services, operating across North America, Asia-Pacific, and Europe. The company supports original equipment manufacturers with advanced optical, electro-mechanical, and electronic products, including switching components and lasers for diverse industries such as telecommunications, medical, and automotive. Founded in 1999 and headquartered in the Cayman Islands, Fabrinet employs over 14,000 people and is listed on the NYSE.
MKS Inc. Overview
MKS Inc. provides instruments, systems, and process control solutions to measure, monitor, and control manufacturing processes globally. Its product portfolio ranges from vacuum and pressure control to laser and photonics technologies, serving semiconductor, industrial, life sciences, and defense markets. Established in 1961 and based in Massachusetts, MKS employs around 10,200 staff and trades on NASDAQ.
Key similarities and differences
Both Fabrinet and MKS operate in the Technology sector within the Hardware, Equipment & Parts industry, serving advanced manufacturing markets with specialized products. Fabrinet focuses more on optical and electro-mechanical manufacturing services, while MKS emphasizes instruments and control systems for manufacturing processes. Fabrinet is larger by market cap and workforce, whereas MKS shows higher stock price volatility with a greater beta.
Income Statement Comparison
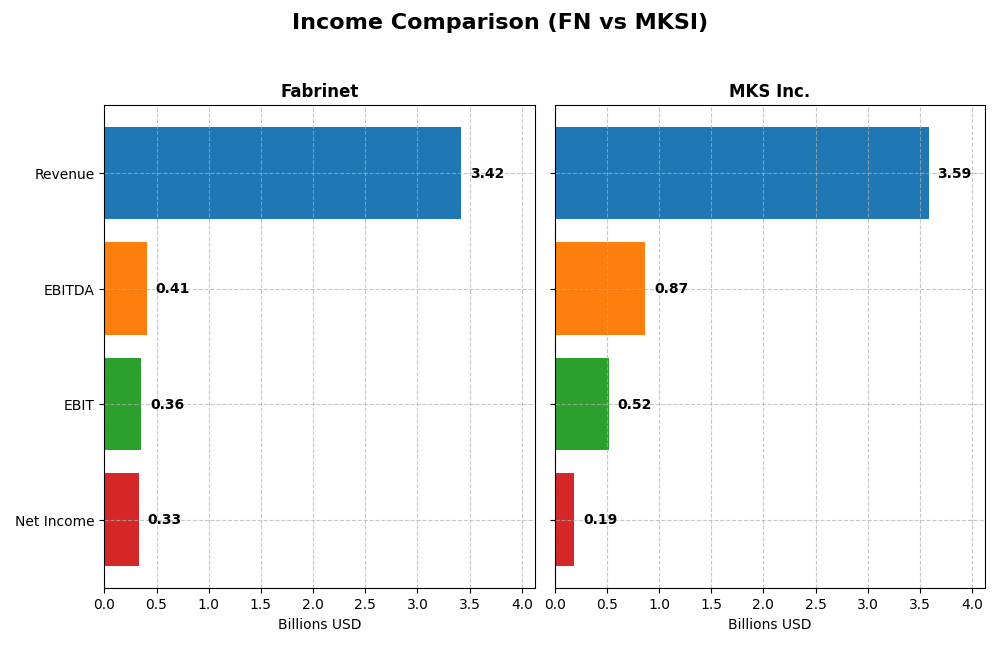
The table below compares key income statement metrics for Fabrinet and MKS Inc. based on their most recent fiscal year data.
| Metric | Fabrinet (FN) | MKS Inc. (MKSI) |
|---|---|---|
| Market Cap | 17B | 12.7B |
| Revenue | 3.42B | 3.59B |
| EBITDA | 409M | 870M |
| EBIT | 355M | 522M |
| Net Income | 333M | 190M |
| EPS | 9.23 | 2.82 |
| Fiscal Year | 2025 | 2024 |
Income Statement Interpretations
Fabrinet
Fabrinet has shown strong revenue growth of 81.9% from 2021 to 2025, with net income increasing by 124.2%. Gross margins remained stable at 12.1%, while EBIT and net margins improved favorably, hitting 10.4% and 9.7%, respectively. In 2025, revenue grew 18.6%, and EBIT rose 14%, though net margin slightly declined by 5.3%, indicating some pressure on profitability despite solid operational gains.
MKS Inc.
MKS Inc. experienced a 53.9% revenue increase over 2020–2024, but net income declined by 45.7%. Gross margin remained high and favorable at 47.6%, with EBIT margin at 14.6%. The 2024 fiscal year saw a slight revenue drop of 1%, but EBIT surged 135%, and net margin doubled, showing a recovery in profitability. However, net income and EPS have decreased overall during the period, reflecting volatility.
Which one has the stronger fundamentals?
Fabrinet presents a more consistent growth trajectory with strong improvements in revenue, net income, and margins over the full period, supported by stable operational efficiency and favorable interest expenses. MKS Inc. offers higher gross and EBIT margins but exhibits greater earnings volatility, with significant net income declines over time. Fabrinet’s fundamentals appear steadier and more robust amid fluctuating market conditions.
Financial Ratios Comparison
The table below presents the latest financial ratios for Fabrinet and MKS Inc., enabling a direct comparison of their profitability, liquidity, leverage, efficiency, and dividend metrics for fiscal year 2025 and 2024 respectively.
| Ratios | Fabrinet (2025) | MKS Inc. (2024) |
|---|---|---|
| ROE | 16.8% | 8.2% |
| ROIC | 15.0% | 6.3% |
| P/E | 32.0 | 37.0 |
| P/B | 5.37 | 3.03 |
| Current Ratio | 3.00 | 3.19 |
| Quick Ratio | 2.28 | 2.04 |
| D/E (Debt-to-Equity) | 0.003 | 2.06 |
| Debt-to-Assets | 0.19% | 55.6% |
| Interest Coverage | 0 | 1.44 |
| Asset Turnover | 1.21 | 0.42 |
| Fixed Asset Turnover | 8.85 | 3.55 |
| Payout Ratio | 0% | 31.1% |
| Dividend Yield | 0% | 0.84% |
Interpretation of the Ratios
Fabrinet
Fabrinet exhibits predominantly favorable financial ratios, including a strong return on equity (16.78%) and return on invested capital (15.01%), supported by a solid current ratio of 3.0, indicating good liquidity. However, its price-to-earnings (PE) and price-to-book (PB) ratios are considered unfavorable, reflecting potential valuation concerns. The company does not pay dividends, likely focusing on reinvestment and growth.
MKS Inc.
MKS Inc. shows mostly unfavorable ratios with a low return on equity (8.18%) and a high debt-to-equity ratio (2.06), suggesting financial leverage risks. Its current ratio is also unfavorable despite a decent quick ratio, indicating liquidity pressures. The company pays a modest dividend with a 0.84% yield, but overall ratio performance reflects challenges in profitability and capital structure stability.
Which one has the best ratios?
Fabrinet clearly holds the advantage with a favorable overall ratio profile, strong profitability, and liquidity measures, despite valuation concerns. In contrast, MKS Inc. faces several unfavorable ratios, particularly related to leverage and returns, resulting in an overall unfavorable assessment. Thus, Fabrinet presents stronger ratio metrics based on the data provided.
Strategic Positioning
This section compares the strategic positioning of Fabrinet and MKS Inc., including market position, key segments, and exposure to technological disruption:
Fabrinet
- Leading in optical packaging and precision manufacturing with global reach; faces competitive pressure in hardware parts.
- Focused on optical communications and lasers, sensors; key drivers include advanced optical and electro-mechanical manufacturing.
- Exposure to disruption through advanced optical and laser technologies supporting data centers and semiconductor industries.
MKS Inc.
- Provides instruments and control solutions globally; experiences strong competitive pressure in hardware and equipment sectors.
- Diversified across vacuum, photonics, and equipment segments; driven by semiconductor, industrial, and life sciences markets.
- Faces disruption risks from evolving laser and photonics technologies affecting manufacturing and process control systems.
Fabrinet vs MKS Inc. Positioning
Fabrinet’s strategy is more concentrated on optical communications and precision manufacturing, enabling focused technological expertise. MKS Inc. pursues a diversified approach across multiple technology-driven segments, balancing exposure but complicating operational focus based on the data.
Which has the best competitive advantage?
Fabrinet demonstrates a very favorable moat with growing ROIC exceeding WACC, indicating durable value creation and competitive advantage. Conversely, MKS Inc. shows a very unfavorable moat with declining ROIC below WACC, signaling value destruction and weaker competitive positioning.
Stock Comparison
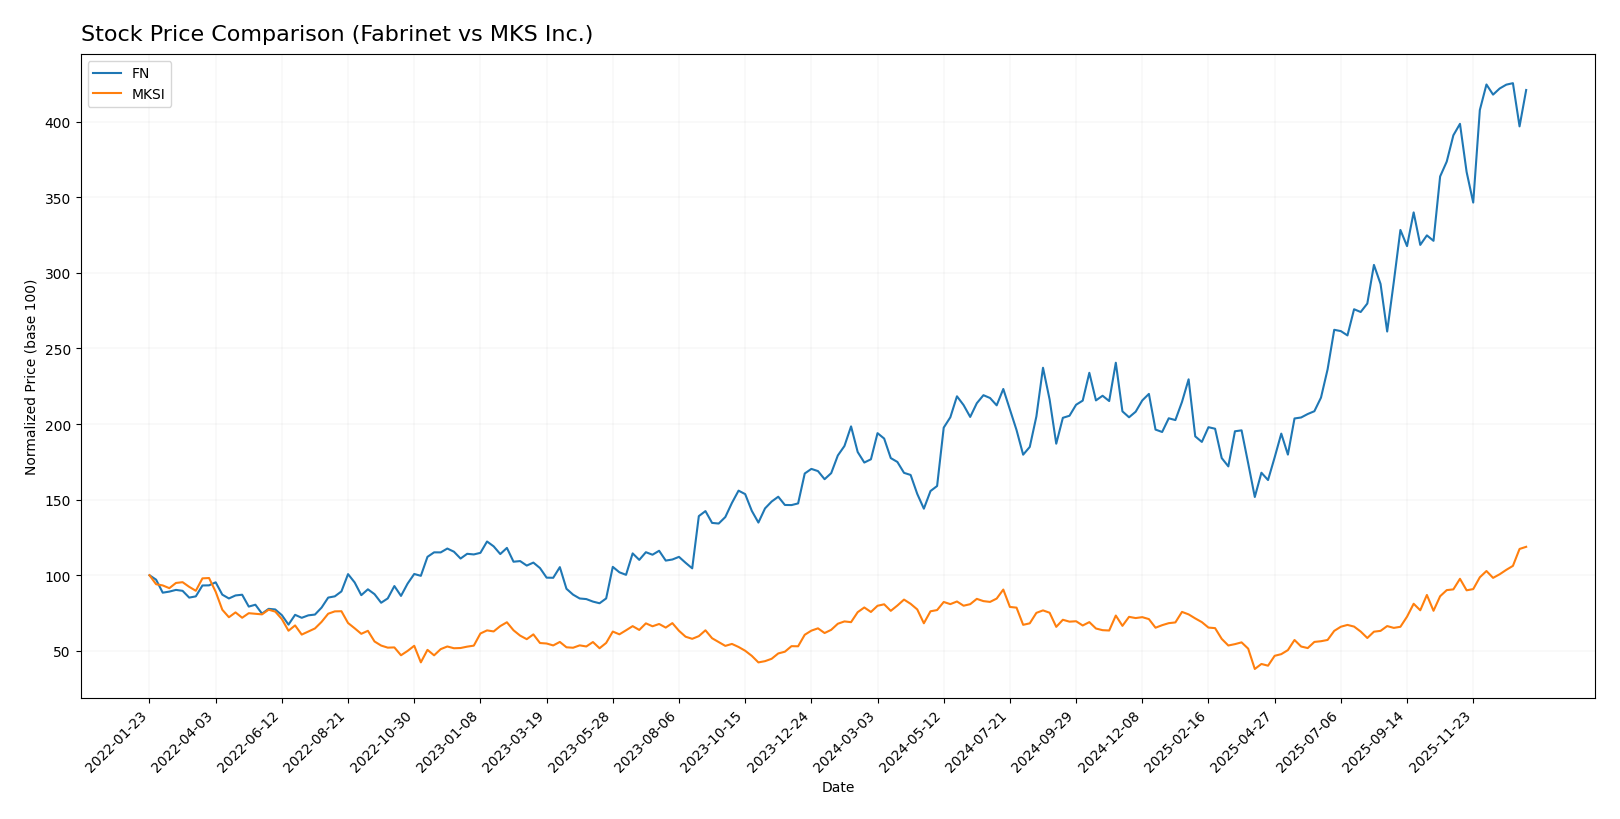
The stock price movements of Fabrinet and MKS Inc. over the past year reveal significant bullish trends, with Fabrinet showing a more pronounced acceleration in gains and higher volatility compared to MKS Inc.
Trend Analysis
Fabrinet’s stock increased by 138.22% over the past 12 months, reflecting a bullish trend with accelerating gains. Price volatility is substantial, with a standard deviation of 85.59 and a price range from 162.32 to 479.42.
MKS Inc. recorded a 56.89% price increase in the same period, also bullish with acceleration. Its volatility is lower, with a standard deviation of 24.25, and prices fluctuated between 60.29 and 188.32.
Comparing both, Fabrinet delivered the highest market performance with a more than double percentage gain versus MKS Inc., despite its higher volatility.
Target Prices
The current analyst consensus for target prices indicates a positive outlook for both Fabrinet and MKS Inc.
| Company | Target High | Target Low | Consensus |
|---|---|---|---|
| Fabrinet | 600 | 537 | 568.5 |
| MKS Inc. | 215 | 136 | 176.17 |
Analysts expect Fabrinet’s stock to rise well above its current price of $474.65, while MKS Inc. shows potential upside from its current $188.76, reflecting overall bullish sentiment.
Analyst Opinions Comparison
This section compares analysts’ ratings and grades for Fabrinet and MKS Inc.:
Rating Comparison
Fabrinet Rating
- Rating: A- grade indicating a very favorable overall status.
- Discounted Cash Flow Score: Moderate score of 3, neutral view.
- ROE Score: Favorable score of 4 showing efficient equity use.
- ROA Score: Very favorable score of 5, excellent asset use.
- Debt To Equity Score: Very favorable 5, indicating low risk.
- Overall Score: Favorable 4 reflecting strong financials.
MKS Inc. Rating
- Rating: B- grade with a very favorable classification.
- Discounted Cash Flow Score: Moderate score of 3, neutral.
- ROE Score: Moderate score of 3, less efficient than Fabrinet.
- ROA Score: Moderate score of 3, average asset utilization.
- Debt To Equity Score: Very unfavorable 1, high financial risk.
- Overall Score: Moderate 2, indicating weaker financials.
Which one is the best rated?
Fabrinet holds a higher overall rating (A-) and scores better across ROE, ROA, and debt-to-equity metrics compared to MKS Inc., which has lower scores and a moderate overall rating (B-).
Scores Comparison
Here is the comparison of Fabrinet and MKS Inc. scores based on Altman Z-Score and Piotroski Score:
Fabrinet Scores
- Altman Z-Score: 13.79, indicating a safe zone.
- Piotroski Score: 4, reflecting average financial strength.
MKS Inc. Scores
- Altman Z-Score: 2.22, indicating a grey zone.
- Piotroski Score: 7, reflecting strong financial strength.
Which company has the best scores?
Fabrinet has a much higher Altman Z-Score, indicating lower bankruptcy risk, while MKS Inc. shows a stronger Piotroski Score, reflecting better financial strength. Each score highlights different financial aspects.
Grades Comparison
Here is a comparison of the latest reliable grades issued by recognized grading companies for both Fabrinet and MKS Inc.:
Fabrinet Grades
The following table summarizes Fabrinet’s recent grades from major financial institutions:
| Grading Company | Action | New Grade | Date |
|---|---|---|---|
| Barclays | Maintain | Equal Weight | 2025-11-05 |
| Needham | Maintain | Buy | 2025-11-04 |
| JP Morgan | Maintain | Overweight | 2025-11-04 |
| Rosenblatt | Maintain | Buy | 2025-11-04 |
| JP Morgan | Maintain | Overweight | 2025-10-16 |
| Rosenblatt | Maintain | Buy | 2025-10-02 |
| JP Morgan | Upgrade | Overweight | 2025-08-25 |
| B. Riley Securities | Maintain | Neutral | 2025-08-19 |
| Needham | Maintain | Buy | 2025-08-19 |
| Rosenblatt | Maintain | Buy | 2025-08-19 |
Overall, Fabrinet’s grades show a stable to positive trend, primarily maintaining Buy and Overweight ratings with no downgrades.
MKS Inc. Grades
Below is the summary table of MKS Inc.’s recent grades from well-known grading firms:
| Grading Company | Action | New Grade | Date |
|---|---|---|---|
| B of A Securities | Maintain | Buy | 2026-01-13 |
| Needham | Maintain | Buy | 2026-01-13 |
| Mizuho | Maintain | Outperform | 2025-12-17 |
| Citigroup | Maintain | Buy | 2025-11-12 |
| Wells Fargo | Maintain | Equal Weight | 2025-11-07 |
| Keybanc | Maintain | Overweight | 2025-11-07 |
| Benchmark | Maintain | Buy | 2025-11-07 |
| Needham | Maintain | Buy | 2025-11-06 |
| Mizuho | Maintain | Outperform | 2025-10-16 |
| Needham | Maintain | Buy | 2025-10-13 |
MKS Inc. displays consistent positive ratings, predominantly Buy and Outperform, with no recent downgrades or negative revisions.
Which company has the best grades?
Both Fabrinet and MKS Inc. hold strong Buy consensus ratings, but MKS Inc. has a larger number of Buy and Outperform grades from diverse reputable firms. This generally indicates stronger analyst confidence that could impact investor sentiment.
Strengths and Weaknesses
Below is a comparative overview of the key strengths and weaknesses of Fabrinet (FN) and MKS Inc. (MKSI) based on the latest available data.
| Criterion | Fabrinet (FN) | MKS Inc. (MKSI) |
|---|---|---|
| Diversification | Moderate: Mainly focused on Optical Communications and Lasers/Sensors segments | High: Diverse product lines including Photonics, Vacuum Solutions, Equipment, and Services |
| Profitability | Strong profitability with ROIC at 15.01%, ROE 16.78%, and favorable margins | Weaker profitability, ROIC at 6.31%, ROE 8.18%, and lower net margin |
| Innovation | Growing ROIC indicates increasing operational efficiency and innovation | Declining ROIC reflects challenges in innovation and operational gains |
| Global presence | Solid global customer base in optical communications market | Broad global presence across multiple industrial segments |
| Market Share | Significant in optical communications manufacturing | Varied market share across photonics and vacuum tech but pressured by competition |
Key takeaways: Fabrinet demonstrates a durable competitive advantage with strong profitability and focused market leadership in optical communications. MKS Inc. shows broad diversification but struggles with profitability and declining returns, signaling caution for investors.
Risk Analysis
Below is a comparative table of key risks for Fabrinet (FN) and MKS Inc. (MKSI) based on the latest 2025/2024 data:
| Metric | Fabrinet (FN) | MKS Inc. (MKSI) |
|---|---|---|
| Market Risk | Moderate beta at 1.04; tech sector exposure | High beta at 1.92; more volatile tech niche |
| Debt Level | Very low debt-to-assets at 19% (favorable) | High debt-to-assets at 56% (unfavorable) |
| Regulatory Risk | Moderate, global manufacturing footprint | Moderate, serving semiconductor and defense markets |
| Operational Risk | Diverse manufacturing processes, strong asset turnover | Complex product mix, lower asset turnover |
| Environmental Risk | Moderate, with global production sites | Moderate, with advanced manufacturing impact |
| Geopolitical Risk | Exposure to Asia-Pacific and Europe | US-based but global clients, sensitive to trade policies |
Fabrinet’s main risk lies in moderate market volatility and global supply chain dependencies, but it benefits from low debt and strong operational efficiency. MKS Inc. faces higher financial risk due to elevated leverage and higher market volatility, although its strong Piotroski score suggests operational resilience. Investors should watch MKSI’s debt burden as the most impactful risk.
Which Stock to Choose?
Fabrinet (FN) has shown strong income growth with an 18.6% revenue increase in 2025, favorable profitability ratios including a 16.78% ROE, very low debt levels, and a very favorable overall rating of A-. Its economic moat is very favorable, indicating durable competitive advantage and value creation.
MKS Inc. (MKSI) presents mixed financials: a slight revenue decline of 0.99% in 2024 but strong EBIT growth of 134.66%, moderate profitability with an 8.18% ROE, significant debt burden, and a moderate overall rating of B-. The company’s economic moat is very unfavorable, signaling declining profitability and value destruction.
Investors prioritizing stability, strong profitability, and durable competitive advantage may find Fabrinet more aligned with their profile, while those with a higher risk tolerance seeking potential turnaround opportunities could view MKS Inc.’s recent earnings growth as a positive sign. Both stocks display bullish price trends but differ markedly in financial strength and risk metrics.
Disclaimer: Investment carries a risk of loss of initial capital. The past performance is not a reliable indicator of future results. Be sure to understand risks before making an investment decision.
Go Further
I encourage you to read the complete analyses of Fabrinet and MKS Inc. to enhance your investment decisions: