Fabrinet and MicroVision, Inc. are two key players in the hardware, equipment, and parts industry, yet they occupy distinct niches within this broad sector. Fabrinet excels in precision optical and electro-mechanical manufacturing services, while MicroVision pioneers lidar and laser scanning technologies for autonomous vehicles and AR. This article will analyze their market positions and innovation strategies to help you decide which company presents a more compelling investment opportunity.

Table of contents
Companies Overview
I will begin the comparison between Fabrinet and MicroVision, Inc. by providing an overview of these two companies and their main differences.
Fabrinet Overview
Fabrinet operates in the technology sector, providing optical packaging and precision manufacturing services across North America, Asia-Pacific, and Europe. The company supports original equipment manufacturers in optical communication components, industrial lasers, automotive parts, medical devices, and sensors. Founded in 1999 and based in the Cayman Islands, Fabrinet employs over 14K people and emphasizes advanced manufacturing processes and supply chain management.
MicroVision, Inc. Overview
MicroVision, Inc. is a technology company specializing in lidar sensors for automotive safety and autonomous driving, as well as micro-display technologies for augmented reality headsets. Founded in 1993 and headquartered in Redmond, Washington, MicroVision focuses on innovative laser beam scanning technology including MEMS and PicoP scanning modules. The company serves OEMs and ODMs primarily in the automotive and consumer electronics sectors with a workforce of 185 employees.
Key similarities and differences
Both Fabrinet and MicroVision operate in the hardware, equipment, and parts industry within the technology sector, serving original equipment manufacturers. However, Fabrinet concentrates on manufacturing and integrating optical and electro-mechanical components at scale, while MicroVision develops specialized lidar and display technologies with an emphasis on innovation in laser scanning. Fabrinet’s global footprint and larger workforce contrast with MicroVision’s niche focus and smaller scale.
Income Statement Comparison
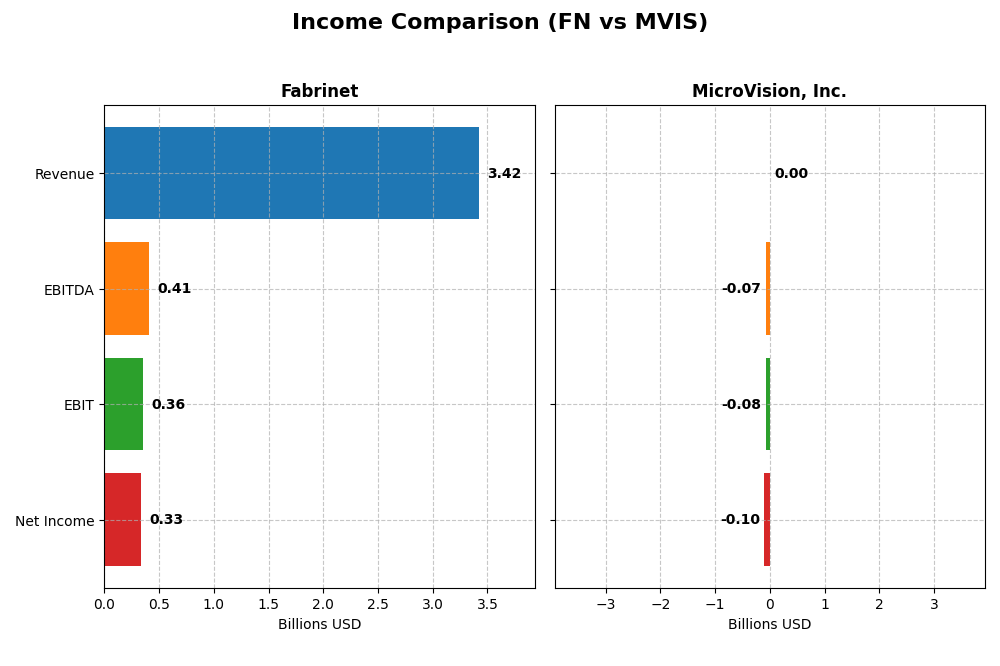
The following table presents a side-by-side comparison of the most recent fiscal year income statement metrics for Fabrinet and MicroVision, Inc., highlighting their financial scale and profitability.
| Metric | Fabrinet (FN) | MicroVision, Inc. (MVIS) |
|---|---|---|
| Market Cap | 16.8B | 292M |
| Revenue | 3.42B | 4.70M |
| EBITDA | 409M | -71M |
| EBIT | 355M | -75M |
| Net Income | 333M | -97M |
| EPS | 9.23 | -0.46 |
| Fiscal Year | 2025 | 2024 |
Income Statement Interpretations
Fabrinet
Fabrinet experienced consistent revenue growth from 2021 to 2025, rising from $1.88B to $3.42B, alongside a net income increase from $148M to $333M. Margins remained generally stable with a slight improvement in EBIT and net margins, signaling operational efficiency. In 2025, revenue growth accelerated to 18.6%, though net margin slightly declined by 5.34%, reflecting some pressure on profitability despite higher earnings per share.
MicroVision, Inc.
MicroVision showed volatile revenue trends from 2020 to 2024, peaking at $7.26M in 2023 before dropping to $4.7M in 2024. The company reported sustained net losses, with net income deteriorating to -$97M in 2024. Margins were deeply negative, with gross and EBIT margins substantially unfavorable. The latest year saw revenue decline by 35.3% and worsening net margin by 80.8%, indicating ongoing financial challenges.
Which one has the stronger fundamentals?
Fabrinet exhibits stronger fundamentals, supported by sustained revenue and net income growth, favorable margin trends, and overall positive income statement evaluations. In contrast, MicroVision’s financials reveal persistent losses, declining revenue, and deeply negative margins, leading to an unfavorable income statement outlook. Fabrinet’s operational consistency contrasts sharply with MicroVision’s financial instability.
Financial Ratios Comparison
The table below presents a side-by-side comparison of key financial ratios for Fabrinet (FN) and MicroVision, Inc. (MVIS) based on their most recent fiscal year data.
| Ratios | Fabrinet (FN) 2025 | MicroVision (MVIS) 2024 |
|---|---|---|
| ROE | 16.78% | -198.72% |
| ROIC | 15.01% | -83.73% |
| P/E | 32.02 | -2.83 |
| P/B | 5.37 | 5.63 |
| Current Ratio | 3.00 | 1.79 |
| Quick Ratio | 2.28 | 1.74 |
| D/E | 0.003 | 1.06 |
| Debt-to-Assets | 0.19% | 42.62% |
| Interest Coverage | 0 | -19.19 |
| Asset Turnover | 1.21 | 0.04 |
| Fixed Asset Turnover | 8.85 | 0.20 |
| Payout ratio | 0% | 0% |
| Dividend yield | 0% | 0% |
Interpretation of the Ratios
Fabrinet
Fabrinet shows a generally favorable ratio profile with strong returns on equity (16.78%) and invested capital (15.01%), supported by a solid current ratio of 3.0, indicating good liquidity. However, elevated price-to-earnings (32.02) and price-to-book (5.37) ratios suggest the stock may be overvalued. The company does not pay dividends, reflecting a possible reinvestment strategy or growth focus.
MicroVision, Inc.
MicroVision’s financial ratios reveal significant weaknesses, including deeply negative net margin (-2063.78%) and return on equity (-198.72%), signaling operational losses and poor profitability. While liquidity ratios are adequate (current ratio 1.79), high debt-to-equity (1.06) and negative interest coverage indicate financial stress. The firm does not pay dividends, consistent with its negative earnings and ongoing investment in R&D.
Which one has the best ratios?
Fabrinet exhibits a more favorable financial ratio set, with robust profitability, liquidity, and capital efficiency metrics. In contrast, MicroVision faces numerous unfavorable indicators, including negative profitability and high leverage, reflecting operational and financial challenges. Based on these evaluations, Fabrinet’s ratios present a stronger financial position.
Strategic Positioning
This section compares the strategic positioning of Fabrinet and MicroVision, Inc. in terms of market position, key segments, and exposure to technological disruption:
Fabrinet
- Large market cap of 16.8B in hardware and equipment, facing typical competitive pressures.
- Diversified revenue from optical communications, lasers, sensors, and precision manufacturing.
- Exposed to disruption in optical and electro-mechanical manufacturing technologies.
MicroVision, Inc.
- Smaller market cap of 292M, in hardware with higher beta, indicating more volatility and competition.
- Focused on lidar sensors for automotive safety, AR headsets, and scanning display technology.
- Exposure to disruption through lidar innovation and emerging AR display applications.
Fabrinet vs MicroVision, Inc. Positioning
Fabrinet adopts a diversified approach across multiple optical and sensor manufacturing segments, supporting stability but facing broad competition. MicroVision concentrates on lidar and AR technologies, offering focused innovation but higher market risk and narrower revenue streams.
Which has the best competitive advantage?
Fabrinet shows a very favorable moat with value creation and growing ROIC, indicating durable advantage. MicroVision’s moat is slightly unfavorable due to value destruction despite improving profitability, suggesting weaker competitive advantage.
Stock Comparison
Over the past 12 months, Fabrinet (FN) exhibited a strong bullish trend with significant price appreciation and accelerating momentum, while MicroVision, Inc. (MVIS) experienced a pronounced bearish trend marked by deceleration and sustained price decline.
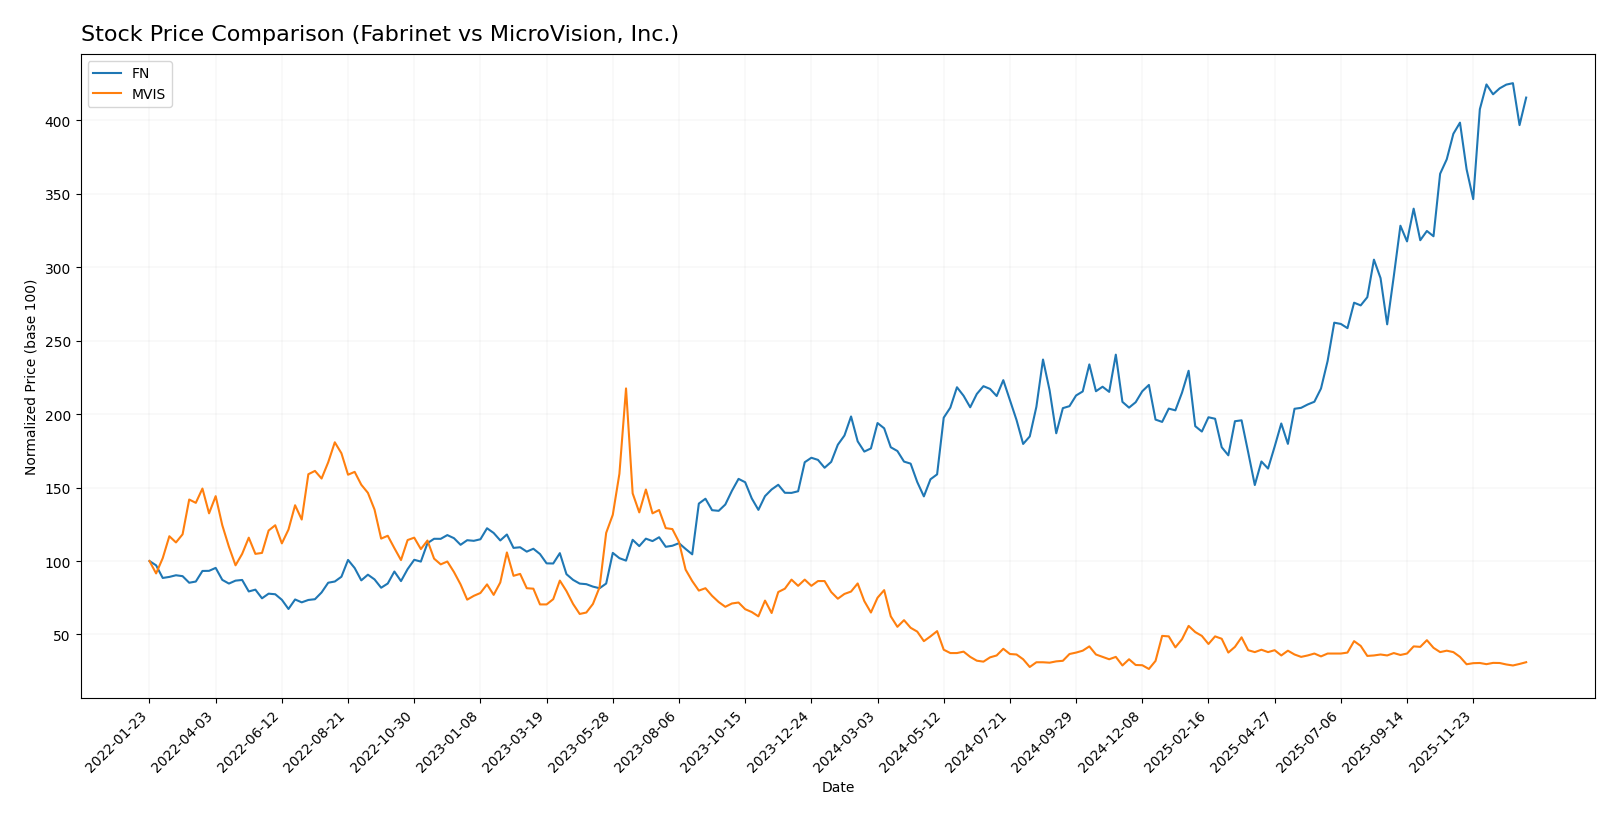
Trend Analysis
Fabrinet’s stock increased by 135.21% over the past year, showing a bullish trend with acceleration and high volatility (std deviation 85.45). The price ranged from 162.32 to a peak of 479.42.
MicroVision’s stock declined by 52.09% over the same period, reflecting a bearish trend with deceleration and very low volatility (std deviation 0.29). Its price fluctuated between 0.82 and 2.47.
Comparatively, Fabrinet outperformed MicroVision, delivering significantly higher market returns and stronger upward momentum over the analyzed 12-month period.
Target Prices
The consensus target prices from verified analysts suggest potential upside for these stocks.
| Company | Target High | Target Low | Consensus |
|---|---|---|---|
| Fabrinet | 600 | 537 | 568.5 |
| MicroVision, Inc. | 5 | 5 | 5 |
Analysts expect Fabrinet’s stock to rise from its current price of 470.06 USD toward the consensus target of 568.5 USD, indicating strong confidence. MicroVision’s target price of 5 USD is significantly above its current price of 0.96 USD, suggesting high growth expectations.
Analyst Opinions Comparison
This section compares analysts’ ratings and grades for Fabrinet and MicroVision, Inc.:
Rating Comparison
Fabrinet Rating
- Rating: A- indicating a very favorable overall assessment
- Discounted Cash Flow Score: 3, moderate valuation based on future cash flows
- ROE Score: 4, favorable efficiency in generating profit from shareholders’ equity
- ROA Score: 5, very favorable asset utilization for earnings
- Debt To Equity Score: 5, very favorable low financial risk
- Overall Score: 4, favorable financial standing
MicroVision, Inc. Rating
- Rating: C- indicating a very unfavorable overall assessment
- Discounted Cash Flow Score: 1, very unfavorable valuation
- ROE Score: 1, very unfavorable efficiency
- ROA Score: 1, very unfavorable asset utilization
- Debt To Equity Score: 2, moderate financial risk
- Overall Score: 1, very unfavorable financial standing
Which one is the best rated?
Based on the provided data, Fabrinet is significantly better rated than MicroVision, Inc. across all key financial metrics, showing stronger profitability, asset utilization, and financial stability.
Scores Comparison
Here is a comparison of the financial scores for Fabrinet and MicroVision, Inc.:
Fabrinet Scores
- Altman Z-Score: 13.79, indicating a safe zone status.
- Piotroski Score: 4, categorized as average financial strength.
MicroVision, Inc. Scores
- Altman Z-Score: -6.42, indicating a distress zone status.
- Piotroski Score: 1, categorized as very weak financial strength.
Which company has the best scores?
Based on the provided data, Fabrinet has a significantly higher Altman Z-Score indicating financial safety, and a better Piotroski Score reflecting average financial strength, compared to MicroVision’s distress-level and very weak scores.
Grades Comparison
Here is a comparison of the recent grades issued by recognized grading companies for Fabrinet and MicroVision, Inc.:
Fabrinet Grades
The following table summarizes Fabrinet’s recent grades from major financial institutions:
| Grading Company | Action | New Grade | Date |
|---|---|---|---|
| Barclays | Maintain | Equal Weight | 2025-11-05 |
| Needham | Maintain | Buy | 2025-11-04 |
| JP Morgan | Maintain | Overweight | 2025-11-04 |
| Rosenblatt | Maintain | Buy | 2025-11-04 |
| JP Morgan | Maintain | Overweight | 2025-10-16 |
| Rosenblatt | Maintain | Buy | 2025-10-02 |
| JP Morgan | Upgrade | Overweight | 2025-08-25 |
| B. Riley Securities | Maintain | Neutral | 2025-08-19 |
| Needham | Maintain | Buy | 2025-08-19 |
| Rosenblatt | Maintain | Buy | 2025-08-19 |
Fabrinet’s grades show a consistent pattern of favorable ratings, predominantly Buy and Overweight, with no downgrades noted recently.
MicroVision, Inc. Grades
The following table presents MicroVision’s recent grades from recognized rating agencies:
| Grading Company | Action | New Grade | Date |
|---|---|---|---|
| D. Boral Capital | Maintain | Buy | 2025-12-16 |
| D. Boral Capital | Maintain | Buy | 2025-11-12 |
| WestPark Capital | Maintain | Buy | 2025-10-21 |
| WestPark Capital | Maintain | Buy | 2025-09-05 |
| D. Boral Capital | Maintain | Buy | 2025-09-02 |
| WestPark Capital | Maintain | Buy | 2025-08-27 |
| D. Boral Capital | Maintain | Buy | 2025-08-11 |
| D. Boral Capital | Maintain | Buy | 2025-05-21 |
| D. Boral Capital | Maintain | Buy | 2025-05-13 |
| WestPark Capital | Maintain | Buy | 2025-03-27 |
MicroVision’s grades consistently reflect a Buy consensus with no changes or downgrades in the past year.
Which company has the best grades?
Both Fabrinet and MicroVision, Inc. hold a Buy consensus from analysts, but Fabrinet shows a broader range of positive ratings including Overweight and Equal Weight, indicating slightly more nuanced analyst confidence. Investors may interpret Fabrinet’s diverse favorable ratings as a signal of steady optimism, whereas MicroVision’s uniform Buy ratings suggest a stable but less differentiated outlook.
Strengths and Weaknesses
Here is a comparison of Fabrinet and MicroVision, Inc. based on key financial and strategic criteria:
| Criterion | Fabrinet (FN) | MicroVision, Inc. (MVIS) |
|---|---|---|
| Diversification | Moderate; mainly Optical Communications with growing Lasers & Sensors segment | Low; revenue concentrated in Product and License segments with volatility |
| Profitability | Strong; 9.72% net margin, 16.78% ROE, 15.01% ROIC, creating value | Weak; highly negative net margin (-2063.78%), ROE (-198.72%), and ROIC (-83.73%), shedding value |
| Innovation | Steady growth in ROIC and product expansion | Improving ROIC trend but still unprofitable |
| Global presence | Established with large revenue in optical communications ($2.62B in 2025) | Smaller scale with $4.8M total 2024 revenue, limited global footprint |
| Market Share | Solid in optical communications niche | Niche player with limited market penetration and financial struggles |
Key takeaways: Fabrinet demonstrates a durable competitive advantage with profitable growth and financial strength, making it a more stable choice. MicroVision shows potential with improving ROIC but remains a high-risk investment due to ongoing losses and smaller scale.
Risk Analysis
Below is a comparison of key risks for Fabrinet (FN) and MicroVision, Inc. (MVIS) based on the most recent data:
| Metric | Fabrinet (FN) | MicroVision, Inc. (MVIS) |
|---|---|---|
| Market Risk | Moderate (Beta 1.035) | Higher (Beta 1.274) |
| Debt level | Very Low (D/E 0.0) | High (D/E 1.06) |
| Regulatory Risk | Moderate (Global presence) | Moderate (US-focused, tech sector) |
| Operational Risk | Low (Strong asset turnover) | High (Low asset turnover, small size) |
| Environmental Risk | Low | Low |
| Geopolitical Risk | Moderate (Cayman Islands base) | Low (US-based) |
Fabrinet shows lower financial risk with zero debt and strong operational efficiency, making market fluctuations its primary risk. MicroVision faces significant financial distress, with high debt and poor profitability, increasing bankruptcy risk notably in 2026. The most impactful risk for MVIS is financial instability, while FN’s risks are primarily market and geopolitical in nature.
Which Stock to Choose?
Fabrinet (FN) has shown a strong income growth of 81.94% over 2021-2025, with favorable profitability and robust financial ratios. Its return on equity is 16.78%, debt remains low, and it holds a very favorable rating of A-. The company demonstrates a durable competitive advantage with a very favorable moat status.
MicroVision, Inc. (MVIS) displays a challenging income profile, with a negative net margin and unfavorable profitability metrics. Despite some revenue growth overall, its financial ratios are mostly unfavorable, with significant debt and a very weak Piotroski score. The rating is C-, reflecting its unfavorable financial position and value destruction.
For investors, Fabrinet might appear more suitable for those seeking quality and stability due to its strong financial health and value creation. Conversely, MicroVision could be interpreted as fitting for risk-tolerant investors focused on potential turnaround or growth opportunities despite current financial weaknesses.
Disclaimer: Investment carries a risk of loss of initial capital. The past performance is not a reliable indicator of future results. Be sure to understand risks before making an investment decision.
Go Further
I encourage you to read the complete analyses of Fabrinet and MicroVision, Inc. to enhance your investment decisions: