Fabrinet and Mesa Laboratories, Inc. both operate within the hardware, equipment, and parts industry, yet they serve distinct but overlapping markets focused on advanced manufacturing and life sciences tools. Fabrinet excels in optical and electro-mechanical manufacturing, while Mesa Laboratories specializes in quality control and calibration solutions for healthcare and biopharmaceutical sectors. This article will guide you through their strengths to identify which company presents a more compelling investment opportunity in 2026.

Table of contents
Companies Overview
I will begin the comparison between Fabrinet and Mesa Laboratories, Inc. by providing an overview of these two companies and their main differences.
Fabrinet Overview
Fabrinet specializes in optical packaging and precision manufacturing services across North America, Asia-Pacific, and Europe. Its mission centers on delivering advanced optical and electro-mechanical products, including tunable lasers, transceivers, and sensors, serving original equipment manufacturers in communications, medical, automotive, and industrial sectors. Listed on the NYSE, Fabrinet operates with over 14K employees and a market cap of approximately 16.8B USD.
Mesa Laboratories, Inc. Overview
Mesa Laboratories, Inc. develops and markets life sciences tools and quality control products, focusing on sterilization indicators, biopharmaceutical development, calibration solutions, and clinical genomics. The company serves healthcare, pharmaceutical, and laboratory markets worldwide. With around 736 employees, it is listed on NASDAQ and holds a market cap near 475M USD, emphasizing specialized instruments and testing services.
Key similarities and differences
Both companies operate within the hardware and equipment industry, targeting specialized markets requiring precision technology. Fabrinet’s scale and product range in optical and electro-mechanical manufacturing contrast with Mesa Laboratories’ more niche focus on life sciences tools and quality control solutions. While Fabrinet serves broader industrial sectors, Mesa Labs concentrates on healthcare and biopharmaceutical applications, reflecting distinct market positioning and business models.
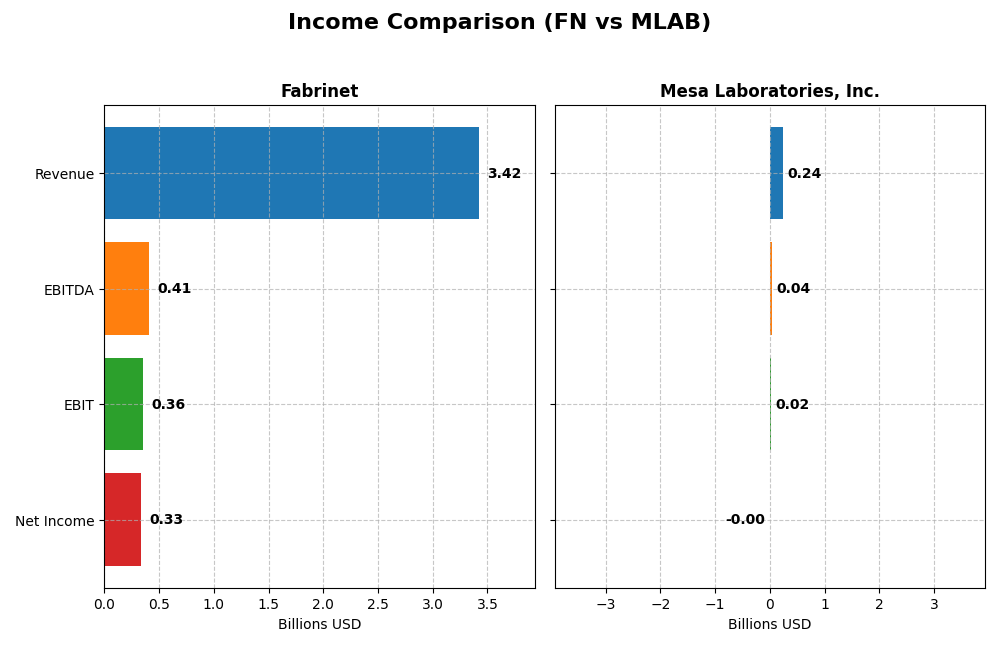
Income Statement Comparison
This table presents a side-by-side comparison of key income statement metrics for Fabrinet and Mesa Laboratories, Inc. for the most recent fiscal year available.
| Metric | Fabrinet (FN) | Mesa Laboratories, Inc. (MLAB) |
|---|---|---|
| Market Cap | 16.8B | 475M |
| Revenue | 3.42B | 241M |
| EBITDA | 409M | 42.3M |
| EBIT | 355M | 17.8M |
| Net Income | 333M | -2.0M |
| EPS | 9.23 | -0.36 |
| Fiscal Year | 2025 | 2025 |
Income Statement Interpretations
Fabrinet
Fabrinet’s revenue and net income have grown consistently from 2021 to 2025, with revenue reaching $3.42B and net income $333M in 2025. Margins show stability, with a neutral gross margin of 12.09% and favorable EBIT and net margins above 9%. The latest year saw strong revenue growth of 18.6%, though net margin dipped slightly by 5.34%.
Mesa Laboratories, Inc.
Mesa Laboratories experienced revenue growth from $134M to $241M over the period, but net income declined, resulting in a net loss of $2M in 2025. Gross margin remains high at 62.61%, but net margin is negative at -0.82%. The most recent year showed improved EBIT and net margin growth, with net margin nearly doubling from the previous year’s negative results.
Which one has the stronger fundamentals?
Fabrinet demonstrates stronger fundamentals with consistent revenue and net income growth, favorable margins, and a solid overall income statement evaluation of 85.7% favorable metrics. Mesa Laboratories, while showing good gross margin and recent margin improvements, struggles with negative net income and less consistent profitability, reflected by a lower favorable metric ratio of 64.3%.
Financial Ratios Comparison
The table below presents a side-by-side comparison of key financial ratios for Fabrinet (FN) and Mesa Laboratories, Inc. (MLAB) based on their most recent fiscal year data.
| Ratios | Fabrinet (FN) 2025 | Mesa Laboratories (MLAB) 2025 |
|---|---|---|
| ROE | 16.78% | -1.24% |
| ROIC | 15.01% | -1.45% |
| P/E | 32.02 | -326.35 |
| P/B | 5.37 | 4.03 |
| Current Ratio | 3.00 | 0.63 |
| Quick Ratio | 2.28 | 0.47 |
| D/E | 0.0028 | 1.14 |
| Debt-to-Assets | 0.19% | 41.88% |
| Interest Coverage | 0 | 1.38 |
| Asset Turnover | 1.21 | 0.56 |
| Fixed Asset Turnover | 8.85 | 7.45 |
| Payout ratio | 0% | -176.68% |
| Dividend yield | 0% | 0.54% |
Interpretation of the Ratios
Fabrinet
Fabrinet shows a majority of favorable ratios, including strong returns on equity (16.78%) and invested capital (15.01%), coupled with a solid current ratio of 3.0, indicating good liquidity. Concerns arise from high price-to-earnings (PE) and price-to-book (PB) ratios, which may suggest overvaluation. Fabrinet does not pay dividends, reflecting a possible reinvestment strategy or growth focus.
Mesa Laboratories, Inc.
Mesa Laboratories presents mostly unfavorable ratios, with negative net margin (-0.82%) and returns on equity (-1.24%) and invested capital (-1.45%), indicating profitability challenges. Liquidity appears weak with a current ratio of 0.63 and debt levels are high (D/E at 1.14). The company pays a modest dividend yield of 0.54%, though this is flagged as unfavorable given the weak earnings and coverage concerns.
Which one has the best ratios?
Fabrinet displays a more favorable overall ratio profile, with strong profitability, liquidity, and leverage metrics, despite valuation concerns. Mesa Laboratories struggles with profitability and liquidity, and its dividend yield is not supported by solid earnings, leading to an unfavorable ratios assessment compared to Fabrinet.
Strategic Positioning
This section compares the strategic positioning of Fabrinet and Mesa Laboratories, Inc. in terms of market position, key segments, and exposure to technological disruption:
Fabrinet
- Leading player in hardware, equipment & parts with a $16.8B market cap, facing typical sector competition.
- Focused on optical communications and lasers, sensors serving OEMs in communications, industrial, automotive, and medical sectors.
- Exposure to advanced optical and electro-mechanical manufacturing with moderate risk of disruption from evolving tech in optical and sensor markets.
Mesa Laboratories, Inc.
- Smaller $475M market cap in hardware, equipment & parts, competing in specialized life sciences tools and quality control products.
- Diversified segments including sterilization control, biopharmaceutical development, calibration solutions, and clinical genomics tools.
- Operating in life sciences and diagnostics sectors, facing potential disruption from rapid advances in genomics and biotech instrumentation.
Fabrinet vs Mesa Laboratories, Inc. Positioning
Fabrinet follows a concentrated approach centered on optical communications and precision manufacturing, benefiting from scale but exposed to sector cyclicality. Mesa Laboratories operates a diversified portfolio across life sciences and calibration, spreading risk but with smaller scale and variable segment focus.
Which has the best competitive advantage?
Fabrinet shows a very favorable moat with a growing ROIC exceeding WACC, indicating durable value creation and efficient capital use. Mesa Laboratories has a very unfavorable moat with declining ROIC below WACC, reflecting value destruction and weakening profitability.
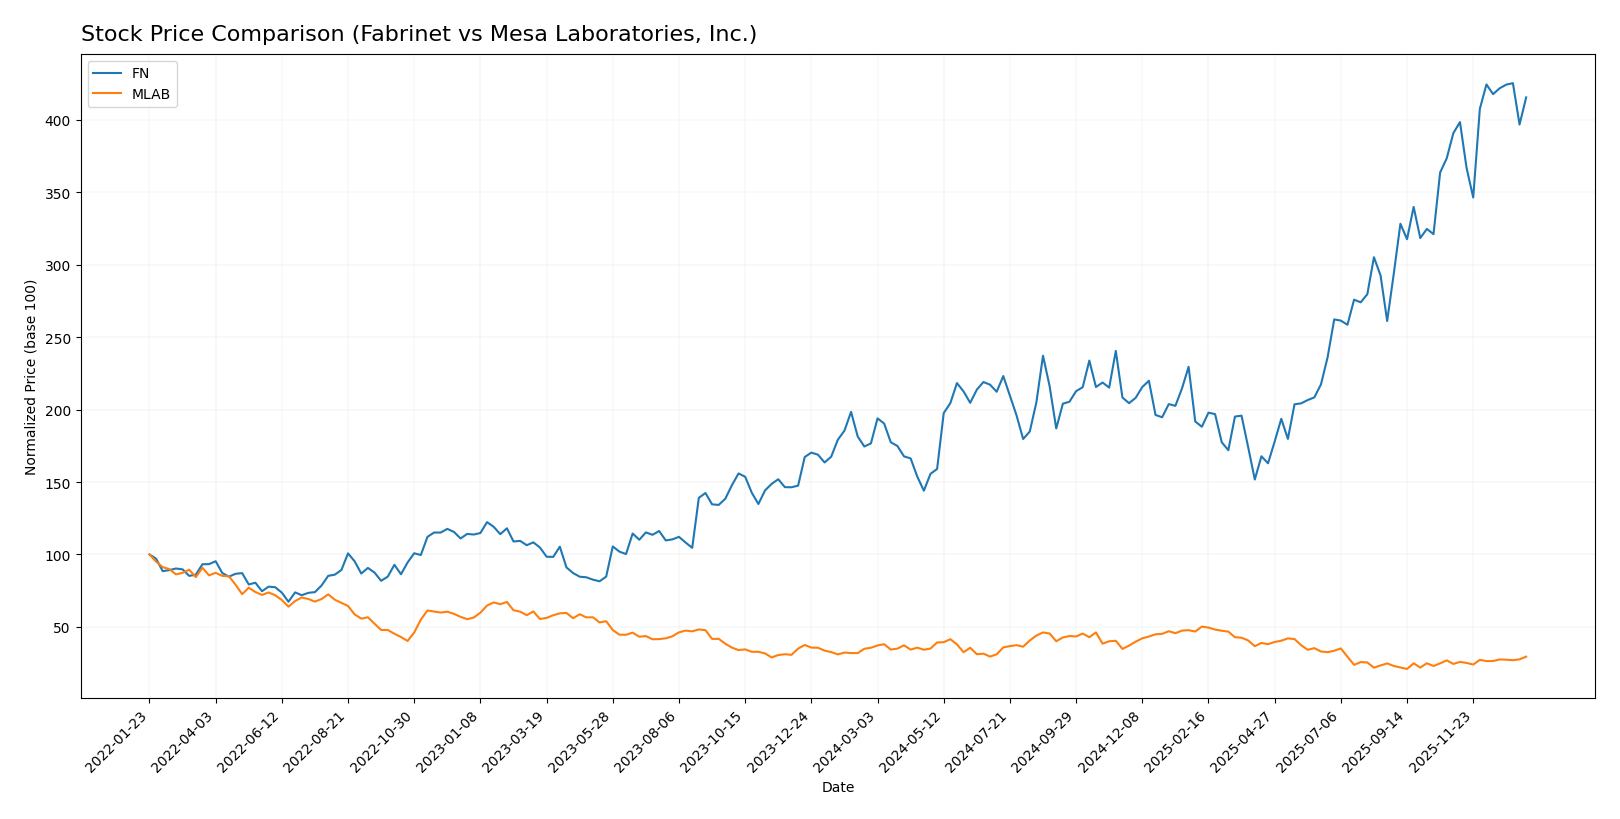
Stock Comparison
The stock price movements over the past 12 months show Fabrinet (FN) experiencing a strong bullish trend with significant price appreciation, while Mesa Laboratories, Inc. (MLAB) has faced a bearish trend despite recent gains.
Trend Analysis
Fabrinet’s stock has surged by 135.21% over the past year, indicating a clear bullish trend with accelerating momentum and high volatility, reaching a high of 479.42 and a low of 162.32.
Mesa Laboratories, Inc. reported a 17.24% decline over the same period, marking a bearish trend with accelerating downside, despite a recent 20.57% rebound and lower volatility compared to Fabrinet.
Comparing these trends, Fabrinet has delivered the highest market performance with a strong upward trajectory, while Mesa Laboratories, Inc. remains in a longer-term bearish phase despite short-term recovery.
Target Prices
The current analyst target consensus for Fabrinet and Mesa Laboratories, Inc. shows moderate upside potential based on recent evaluations.
| Company | Target High | Target Low | Consensus |
|---|---|---|---|
| Fabrinet | 600 | 537 | 568.5 |
| Mesa Laboratories, Inc. | 83 | 83 | 83 |
Analysts expect Fabrinet’s price to rise notably above its current 470 USD, while Mesa Laboratories’ target is slightly below its current 86 USD price, indicating mixed near-term sentiment.
Analyst Opinions Comparison
This section compares analysts’ ratings and grades for Fabrinet and Mesa Laboratories, Inc.:
Rating Comparison
Fabrinet Rating
- Rating: A- indicating a very favorable overall evaluation.
- Discounted Cash Flow Score: Moderate, rated 3 out of 5.
- ROE Score: Favorable efficiency in generating equity profits, rated 4.
- ROA Score: Very favorable asset utilization, rated 5.
- Debt To Equity Score: Very favorable low financial risk, rated 5.
- Overall Score: Favorable, rated 4 out of 5.
Mesa Laboratories, Inc. Rating
- Rating: C+ with a very favorable status despite lower scores.
- Discounted Cash Flow Score: Very favorable, rated 5 out of 5.
- ROE Score: Very unfavorable, rated 1 out of 5.
- ROA Score: Very unfavorable, rated 1 out of 5.
- Debt To Equity Score: Very unfavorable, rated 1 out of 5.
- Overall Score: Moderate, rated 2 out of 5.
Which one is the best rated?
Fabrinet is better rated overall with a strong A- rating and favorable scores in ROE, ROA, and debt-to-equity, while Mesa Laboratories, Inc. has a lower C+ rating and significantly weaker financial efficiency and risk scores despite a high discounted cash flow score.
Scores Comparison
The comparison of Fabrinet and Mesa Laboratories, Inc. scores is as follows:
Fabrinet Scores
- Altman Z-Score: 13.79, indicating a safe zone.
- Piotroski Score: 4, categorized as average.
Mesa Laboratories, Inc. Scores
- Altman Z-Score: 1.36, indicating a distress zone.
- Piotroski Score: 5, categorized as average.
Which company has the best scores?
Fabrinet’s Altman Z-Score is significantly higher, placing it in the safe zone, while Mesa Laboratories is in distress. Both companies have average Piotroski scores, with Mesa slightly higher.
Grades Comparison
Here is a comparison of the recent grades assigned to Fabrinet and Mesa Laboratories, Inc.:
Fabrinet Grades
The following table summarizes Fabrinet’s recent grades from reputable grading companies:
| Grading Company | Action | New Grade | Date |
|---|---|---|---|
| Barclays | Maintain | Equal Weight | 2025-11-05 |
| Needham | Maintain | Buy | 2025-11-04 |
| JP Morgan | Maintain | Overweight | 2025-11-04 |
| Rosenblatt | Maintain | Buy | 2025-11-04 |
| JP Morgan | Maintain | Overweight | 2025-10-16 |
| Rosenblatt | Maintain | Buy | 2025-10-02 |
| JP Morgan | Upgrade | Overweight | 2025-08-25 |
| B. Riley Securities | Maintain | Neutral | 2025-08-19 |
| Needham | Maintain | Buy | 2025-08-19 |
| Rosenblatt | Maintain | Buy | 2025-08-19 |
Fabrinet’s grades show a consistent preference for Buy and Overweight ratings, with no downgrades and some recent upgrades.
Mesa Laboratories, Inc. Grades
Below is a summary of Mesa Laboratories, Inc.’s recent grades from recognized grading firms:
| Grading Company | Action | New Grade | Date |
|---|---|---|---|
| Wells Fargo | Maintain | Equal Weight | 2025-12-15 |
| Wells Fargo | Upgrade | Equal Weight | 2025-08-08 |
| Wells Fargo | Maintain | Underweight | 2025-05-30 |
| Evercore ISI Group | Maintain | Outperform | 2024-10-01 |
| Evercore ISI Group | Maintain | Outperform | 2024-08-06 |
| Evercore ISI Group | Maintain | Outperform | 2024-07-02 |
| Evercore ISI Group | Maintain | Outperform | 2024-04-04 |
| Evercore ISI Group | Upgrade | Outperform | 2024-01-04 |
| Evercore ISI Group | Downgrade | In Line | 2021-01-04 |
| Evercore ISI Group | Downgrade | In Line | 2021-01-03 |
Mesa Laboratories’ grades have been mixed, with multiple Outperform ratings but also some Underweight and In Line assessments, reflecting a more cautious stance.
Which company has the best grades?
Fabrinet holds a stronger consensus with predominantly Buy and Overweight ratings, while Mesa Laboratories’ grades are more varied, including Underweight and Hold recommendations. This contrast may influence investor perceptions of growth potential and risk tolerance differently for each company.
Strengths and Weaknesses
Below is a comparative overview of key strengths and weaknesses for Fabrinet (FN) and Mesa Laboratories, Inc. (MLAB) based on recent financial and operational data.
| Criterion | Fabrinet (FN) | Mesa Laboratories, Inc. (MLAB) |
|---|---|---|
| Diversification | Moderate, focused mainly on Optical Communications with growing Lasers and Sensors segment | Moderate, with products and services in biopharmaceutical development, calibration, genomics, sterilization |
| Profitability | Favorable ROIC (15.01%), ROE (16.78%), net margin neutral at 9.72% | Unfavorable profitability metrics: negative net margin (-0.82%), ROE (-1.24%), and ROIC (-1.45%) |
| Innovation | Strong innovation reflected in growing ROIC trend (+19.9%) and durable competitive advantage | Weak innovation indicated by sharply declining ROIC trend (-166.7%) and value destruction |
| Global presence | Strong global footprint serving Optical Communications markets with $2.62B revenue in 2025 | More niche global presence with $198M in product revenue and diversified service offerings |
| Market Share | Leading position in Optical Communications, expanding in sensors and lasers | Smaller market share with more fragmented product lines and lower revenue scale |
Key takeaway: Fabrinet demonstrates a robust and growing economic moat with favorable profitability and strong market positioning in optical communications. Conversely, Mesa Laboratories faces challenges with declining profitability and value destruction, signaling higher investment risk. Investors should weigh Fabrinet’s stability against Mesa’s turnaround potential cautiously.
Risk Analysis
Below is a comparative table of key risks for Fabrinet (FN) and Mesa Laboratories, Inc. (MLAB) as of 2025:
| Metric | Fabrinet (FN) | Mesa Laboratories (MLAB) |
|---|---|---|
| Market Risk | Moderate (Beta 1.035) | Moderate (Beta 0.889) |
| Debt level | Very low (D/E 0.0) | High (D/E 1.14) |
| Regulatory Risk | Moderate (Tech & manufacturing) | Moderate (Healthcare & biotech) |
| Operational Risk | Moderate (Global supply chain) | Elevated (Lower liquidity, ratio concerns) |
| Environmental Risk | Moderate (Manufacturing focus) | Moderate (Lab equipment impact) |
| Geopolitical Risk | Moderate (Asia-Pacific presence) | Low to moderate (Primarily US) |
Fabrinet’s main risks relate to market fluctuations and international supply chains, but its very low debt and strong liquidity reduce financial risk. Mesa Laboratories faces higher financial risk due to significant debt and weaker liquidity, along with operational challenges, making it more vulnerable despite a favorable discounted cash flow outlook.
Which Stock to Choose?
Fabrinet (FN) shows strong income growth with an 18.6% revenue increase in 2025 and favorable profitability metrics, including a 9.72% net margin and 16.78% ROE. Its debt levels are low, supported by a current ratio of 3.0, and it holds a very favorable A- rating.
Mesa Laboratories, Inc. (MLAB) presents a mixed income evolution with 11.47% revenue growth but a negative net margin of -0.82%. Financial ratios indicate challenges, including unfavorable ROE and debt-to-equity metrics, a low current ratio of 0.63, and a moderate C+ rating.
Considering ratings and financial evaluations, Fabrinet’s very favorable rating and strong value creation suggest it might appeal to risk-averse or quality-focused investors, while Mesa Laboratories’ profile could be interpreted as more suitable for those with higher risk tolerance seeking potential turnaround opportunities.
Disclaimer: Investment carries a risk of loss of initial capital. The past performance is not a reliable indicator of future results. Be sure to understand risks before making an investment decision.
Go Further
I encourage you to read the complete analyses of Fabrinet and Mesa Laboratories, Inc. to enhance your investment decisions: