In the competitive world of technology hardware, Keysight Technologies, Inc. (KEYS) and Fabrinet (FN) stand out as key players with overlapping market interests. Both companies specialize in advanced hardware equipment and precision manufacturing, serving diverse industries from communications to automotive. Their innovation-driven strategies and global reach make them compelling choices for investors seeking growth in this sector. This article will help you determine which company offers the most attractive investment opportunity.

Table of contents
Companies Overview
I will begin the comparison between Keysight Technologies and Fabrinet by providing an overview of these two companies and their main differences.
Keysight Technologies Overview
Keysight Technologies, Inc. specializes in electronic design and test solutions across various sectors, including communications, aerospace, defense, automotive, and semiconductors. The company offers a broad portfolio of test and measurement products, such as oscilloscopes, analyzers, and optical solutions, supported by software platforms and services. Founded in 1939 and headquartered in Santa Rosa, California, Keysight operates globally with a focus on innovation and customer support in the hardware and equipment industry.
Fabrinet Overview
Fabrinet provides precision optical, electro-mechanical, and electronic manufacturing services, serving industries like optical communications, industrial lasers, automotive, and medical devices. Its capabilities include process design, supply chain management, advanced packaging, and testing. Incorporated in 1999 and based in the Cayman Islands, Fabrinet caters primarily to original equipment manufacturers, emphasizing high-performance optical components and customized manufacturing solutions within the hardware and equipment sector.
Key similarities and differences
Both companies operate in the technology sector within hardware, equipment, and parts, focusing on serving diverse high-tech industries globally. Keysight centers on electronic design and test equipment development and sales, while Fabrinet specializes in manufacturing and assembly services for optical and electro-mechanical products. Despite overlapping markets, Keysight develops its own test instruments and software, contrasting with Fabrinet’s role as a contract manufacturer providing tailored production solutions.
Income Statement Comparison
The table below presents a side-by-side comparison of key income statement metrics for Keysight Technologies, Inc. and Fabrinet for their most recent fiscal years.
| Metric | Keysight Technologies, Inc. | Fabrinet |
|---|---|---|
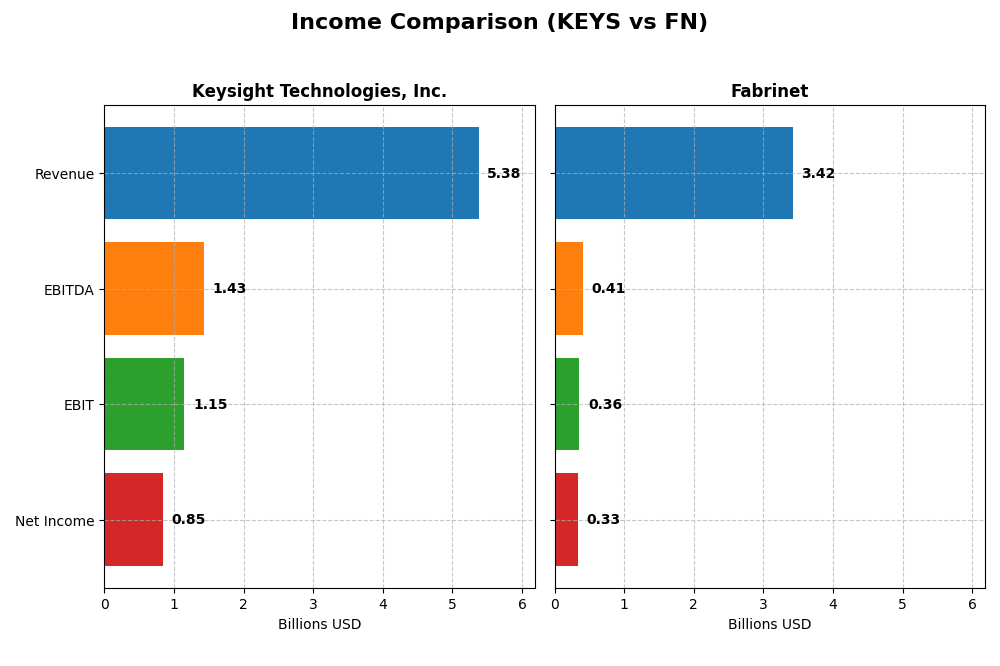
| Market Cap | 36B | 17.5B |
| Revenue | 5.38B | 3.42B |
| EBITDA | 1.43B | 409M |
| EBIT | 1.15B | 355M |
| Net Income | 846M | 333M |
| EPS | 4.90 | 9.23 |
| Fiscal Year | 2025 | 2025 |
Income Statement Interpretations
Keysight Technologies, Inc.
Keysight’s revenue showed a moderate increase over 2021-2025, reaching $5.38B in 2025 with a slight slowdown recently. Net income declined overall but rebounded to $846M in 2025. Margins remain strong and stable, with a gross margin of 62.1% and net margin of 15.7%. The latest year saw improved EBIT and net margin growth, reflecting operational efficiencies.
Fabrinet
Fabrinet demonstrated robust revenue growth, surging 82% over the period to $3.42B in 2025, with net income rising sharply to $333M. Margins are lower but improving, with a gross margin around 12.1% and a net margin near 9.7%. Despite a slight dip in net margin growth in the last year, Fabrinet’s EPS and EBIT growth remained favorable, indicating solid operational progress.
Which one has the stronger fundamentals?
Both companies present favorable income statement evaluations, but Fabrinet shows stronger overall revenue and net income growth with improving margins. Keysight, however, maintains higher absolute margins and a more stable margin profile. Fabrinet’s rapid growth contrasts with Keysight’s steadier performance, highlighting different strengths in fundamentals depending on growth versus margin priorities.
Financial Ratios Comparison
The table below presents a side-by-side comparison of key financial ratios for Keysight Technologies, Inc. (KEYS) and Fabrinet (FN) based on their most recent fiscal year data.
| Ratios | Keysight Technologies, Inc. (2025) | Fabrinet (2025) |
|---|---|---|
| ROE | 14.40% | 16.78% |
| ROIC | 7.98% | 15.01% |
| P/E | 37.41 | 32.02 |
| P/B | 5.39 | 5.37 |
| Current Ratio | 2.35 | 3.00 |
| Quick Ratio | 1.78 | 2.28 |
| D/E (Debt-to-Equity) | 0.51 | 0.003 |
| Debt-to-Assets | 26.31% | 0.19% |
| Interest Coverage | 9.88 | 0 (not available) |
| Asset Turnover | 0.48 | 1.21 |
| Fixed Asset Turnover | 5.21 | 8.85 |
| Payout ratio | 0% | 0% |
| Dividend yield | 0% | 0% |
Interpretation of the Ratios
Keysight Technologies, Inc.
Keysight shows a mixed ratio profile with 43% favorable and 29% unfavorable metrics. The company’s net margin at 15.74% is favorable, while its PE ratio of 37.41 and PB of 5.39 are considered high and unfavorable. Liquidity ratios are strong, but asset turnover is weak. Keysight does not pay dividends, prioritizing reinvestment and growth.
Fabrinet
Fabrinet presents a stronger ratio set, with 64% favorable and only 21% unfavorable evaluations. Its ROE of 16.78% and ROIC of 15.01% are favorable, alongside excellent liquidity and zero debt. The company also does not pay dividends, likely focusing on reinvestment and operational expansion. The PE and PB ratios remain elevated but less so than Keysight.
Which one has the best ratios?
Fabrinet holds the advantage with a higher proportion of favorable ratios, including superior returns and liquidity metrics, and negligible debt. Keysight, while solid in margins and liquidity, shows weaknesses in valuation and turnover ratios. Overall, Fabrinet’s ratios appear more favorable in this comparison based on the available data.
Strategic Positioning
This section compares the strategic positioning of Keysight Technologies and Fabrinet, including market position, key segments, and exposure to technological disruption:
Keysight Technologies, Inc.
- Leading in electronic design and test solutions; faces competition in hardware and equipment industry.
- Focus on Communications Solutions and Electronic Industrial Solutions, driving diversified revenue streams.
- Exposure to evolving electronic test platforms and automation software; must adapt to tech advances.
Fabrinet
- Specializes in optical packaging and precision manufacturing; competes in hardware and equipment sector.
- Concentrated on Optical Communications and Lasers, Sensors, and Other segments as key business drivers.
- Subject to disruption risks in optical components and advanced manufacturing technologies.
Keysight Technologies vs Fabrinet Positioning
Keysight pursues a diversified approach across communications and industrial electronics, offering broad product lines. Fabrinet is more concentrated in optical and precision manufacturing, focusing on specialized components. This results in differing market scope and technological dependencies.
Which has the best competitive advantage?
Fabrinet demonstrates a very favorable moat with growing ROIC and value creation, indicating a durable competitive advantage. Keysight shows a very unfavorable moat with declining ROIC, signaling value destruction and weaker competitive positioning.
Stock Comparison
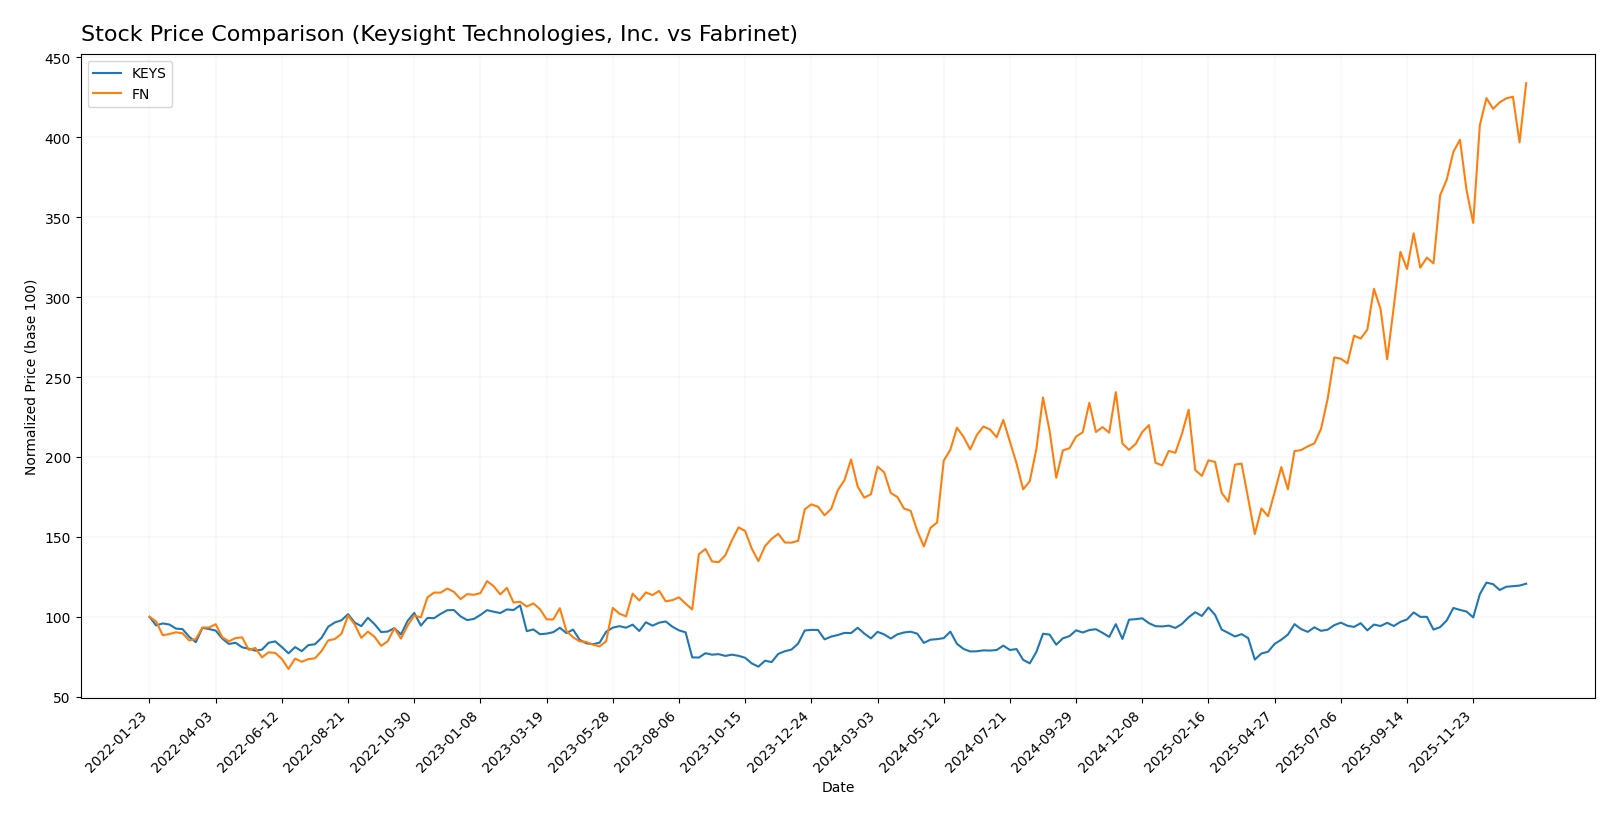
The stock price movements of Keysight Technologies, Inc. (KEYS) and Fabrinet (FN) over the past 12 months reveal significant bullish trends with accelerating momentum and distinct trading volume dynamics.
Trend Analysis
Keysight Technologies, Inc. (KEYS) experienced a 39.56% price increase over the past year, indicating a bullish trend with acceleration. The stock ranged between 122.87 and 210.49, showing moderate volatility (std deviation 18.51).
Fabrinet (FN) showed a stronger bullish trend with a 145.58% price increase and acceleration over the same period. It exhibited higher volatility (std deviation 85.95) with prices fluctuating between 162.32 and 489.0.
Comparing both, Fabrinet delivered the highest market performance with a substantially greater price increase and stronger recent buyer dominance than Keysight Technologies.
Target Prices
Analysts present a positive target price consensus for both Keysight Technologies, Inc. and Fabrinet, reflecting expectations of upward price movement.
| Company | Target High | Target Low | Consensus |
|---|---|---|---|
| Keysight Technologies, Inc. | 232 | 210 | 225.13 |
| Fabrinet | 600 | 499 | 549.5 |
The consensus target prices for Keysight Technologies and Fabrinet are above their current prices of 209.3 and 489 USD, respectively, indicating analyst optimism for potential gains.
Analyst Opinions Comparison
This section compares analysts’ ratings and grades for Keysight Technologies, Inc. (KEYS) and Fabrinet (FN):
Rating Comparison
KEYS Rating
- Rating: B, classified as Very Favorable by analysts.
- Discounted Cash Flow Score: Moderate at 3, reflecting balanced valuation outlook.
- ROE Score: Favorable at 4, showing efficient profit generation from equity.
- ROA Score: Favorable at 4, effective use of assets to generate earnings.
- Debt To Equity Score: Moderate at 2, indicating moderate financial risk.
- Overall Score: Moderate at 3, a balanced overall financial standing.
FN Rating
- Rating: A-, also rated Very Favorable overall.
- Discounted Cash Flow Score: Moderate at 3, indicating similar valuation view.
- ROE Score: Favorable at 4, equally strong in profit generation.
- ROA Score: Very Favorable at 5, superior asset utilization compared to KEYS.
- Debt To Equity Score: Very Favorable at 5, reflecting strong balance sheet.
- Overall Score: Favorable at 4, suggesting stronger overall financial health.
Which one is the best rated?
Based on the provided data, Fabrinet (FN) holds higher overall and specific financial scores, notably in ROA and debt-to-equity, resulting in a better rating than Keysight Technologies (KEYS).
Scores Comparison
The comparison of financial scores for Keysight Technologies and Fabrinet is as follows:
Keysight Technologies Scores
- Altman Z-Score: 5.94, indicating a safe zone with low bankruptcy risk.
- Piotroski Score: 4, categorized as average financial strength.
Fabrinet Scores
- Altman Z-Score: 13.79, well within the safe zone, very low bankruptcy risk.
- Piotroski Score: 4, also indicating average financial strength.
Which company has the best scores?
Based on the provided data, Fabrinet has a higher Altman Z-Score than Keysight Technologies, suggesting stronger financial stability. Both companies share the same average Piotroski Score, reflecting similar financial strength.
Grades Comparison
The following presents a comparison of recent grades assigned by reputable financial institutions to Keysight Technologies, Inc. and Fabrinet:
Keysight Technologies, Inc. Grades
This table summarizes the latest grades assigned by key financial institutions for Keysight Technologies, Inc.
| Grading Company | Action | New Grade | Date |
|---|---|---|---|
| Morgan Stanley | maintain | Equal Weight | 2025-12-17 |
| Jefferies | maintain | Hold | 2025-12-10 |
| Baird | maintain | Outperform | 2025-11-26 |
| Barclays | maintain | Overweight | 2025-11-25 |
| JP Morgan | maintain | Overweight | 2025-11-25 |
| Jefferies | maintain | Hold | 2025-11-25 |
| Citigroup | maintain | Buy | 2025-11-25 |
| UBS | maintain | Buy | 2025-11-25 |
| Wells Fargo | maintain | Overweight | 2025-11-25 |
| Susquehanna | maintain | Positive | 2025-11-25 |
Overall, Keysight Technologies’ grades show a consistent pattern of buy to overweight ratings with no recent downgrades, indicating stable analyst confidence.
Fabrinet Grades
This table shows the recent grades assigned by reputable financial institutions for Fabrinet.
| Grading Company | Action | New Grade | Date |
|---|---|---|---|
| Barclays | maintain | Equal Weight | 2025-11-05 |
| Needham | maintain | Buy | 2025-11-04 |
| JP Morgan | maintain | Overweight | 2025-11-04 |
| Rosenblatt | maintain | Buy | 2025-11-04 |
| JP Morgan | maintain | Overweight | 2025-10-16 |
| Rosenblatt | maintain | Buy | 2025-10-02 |
| JP Morgan | upgrade | Overweight | 2025-08-25 |
| B. Riley Securities | maintain | Neutral | 2025-08-19 |
| Needham | maintain | Buy | 2025-08-19 |
| Rosenblatt | maintain | Buy | 2025-08-19 |
Fabrinet’s grades predominantly indicate buy and overweight ratings, with some recent upgrades, reflecting positive analyst sentiment.
Which company has the best grades?
Both Keysight Technologies and Fabrinet have strong buy-side support, but Fabrinet shows a slightly higher number of buy and overweight ratings along with recent upgrades. This could signal somewhat stronger analyst conviction, potentially affecting investor perception and portfolio weighting.
Strengths and Weaknesses
Below is a comparison of the key strengths and weaknesses for Keysight Technologies, Inc. (KEYS) and Fabrinet (FN) based on the latest available data.
| Criterion | Keysight Technologies, Inc. (KEYS) | Fabrinet (FN) |
|---|---|---|
| Diversification | Moderate diversification with two main segments: Communications Solutions Group (~$3.42B) and Electronic Industrial Solutions Group (~$1.56B) | More focused, primarily on Optical Communications (~$2.62B in 2025) with some exposure to Lasers and Sensors |
| Profitability | Net margin of 15.74%, neutral ROIC (7.98%), but overall value destroying with declining ROIC vs WACC (-0.86%) | Moderate net margin (9.72%), favorable ROIC (15.01%) well above WACC, showing value creation and growing profitability |
| Innovation | Strong in measurement and communications solutions, but declining profitability suggests challenges in sustaining innovation-led gains | Innovation in optical communications and sensors drives growing ROIC and competitive advantage |
| Global presence | Established global footprint in electronics and communications markets | Global player in optical communications manufacturing, benefiting from niche specialization |
| Market Share | Large presence with revenues over $5B, but facing margin pressure and value destruction | Smaller scale (~$2.6B revenue) but with durable competitive advantages and improving market position |
Key takeaways: Fabrinet exhibits a stronger economic moat with growing profitability and efficient capital use, while Keysight shows solid revenue diversification but struggles with declining returns and value destruction. Investors should weigh Fabrinet’s focused growth and favorable financials against Keysight’s broader but currently challenged position.
Risk Analysis
Below is a comparative table outlining key risks for Keysight Technologies, Inc. (KEYS) and Fabrinet (FN) based on the latest 2025 data.
| Metric | Keysight Technologies, Inc. (KEYS) | Fabrinet (FN) |
|---|---|---|
| Market Risk | Beta 1.18 (moderate volatility) | Beta 1.04 (lower volatility) |
| Debt level | Debt-to-Equity 0.51 (neutral) | Debt-to-Equity 0.0 (favorable, no debt) |
| Regulatory Risk | Moderate, US-focused regulations | Moderate, operates in Cayman Islands, Asia-Pacific, and Europe |
| Operational Risk | Complex product portfolio, global supply chain | Precision manufacturing, multi-regional operations |
| Environmental Risk | Moderate, technology manufacturing impact | Moderate, manufacturing and packaging processes |
| Geopolitical Risk | Exposure to US-China trade tensions | Exposure to Asia-Pacific geopolitical dynamics |
The most impactful risks are market volatility for KEYS, given its higher beta, and operational complexity for both companies. KEYS faces moderate debt risk, while FN’s zero debt strengthens its balance sheet. Geopolitical tensions remain a concern for both, especially in Asia-Pacific regions.
Which Stock to Choose?
Keysight Technologies, Inc. (KEYS) shows a favorable income statement with a strong gross margin of 62.08% and improving net margin growth recently, though its overall net income declined over 2021-2025. Financial ratios are slightly favorable, with solid liquidity and moderate debt. However, its economic moat evaluation is very unfavorable, indicating value destruction and declining profitability. The company holds a very favorable rating of B.
Fabrinet (FN) demonstrates a favorable income statement marked by impressive revenue and net income growth over the period, alongside a solid EBIT margin. Its financial ratios are favorable, highlighted by excellent asset turnover and zero debt, supporting financial strength. The firm benefits from a very favorable economic moat with growing ROIC above WACC, reflecting durable competitive advantage. Fabrinet holds a very favorable A- rating.
Which stock is most favorable depends on the investor’s profile. Those prioritizing companies with a durable competitive advantage and strong value creation might view Fabrinet more favorably. Conversely, investors focusing on established income statement performance and moderate financial ratios might see Keysight as a reasonable option despite its weaker moat. Risk tolerance and investment strategy will influence the interpretation of these results.
Disclaimer: Investment carries a risk of loss of initial capital. The past performance is not a reliable indicator of future results. Be sure to understand risks before making an investment decision.
Go Further
I encourage you to read the complete analyses of Keysight Technologies, Inc. and Fabrinet to enhance your investment decisions: