In the competitive landscape of technology manufacturing, Jabil Inc. and Fabrinet stand out as key players delivering advanced hardware and precision engineering services. Both companies operate in the Hardware, Equipment & Parts industry, catering to overlapping markets like telecommunications, data centers, and industrial sectors. Their distinct innovation approaches and global footprints make this comparison essential. Join me as we explore which company presents the most compelling investment opportunity in 2026.

Table of contents
Companies Overview
I will begin the comparison between Jabil Inc. and Fabrinet by providing an overview of these two companies and their main differences.
Jabil Inc. Overview
Jabil Inc. operates globally in manufacturing services and solutions, focusing on Electronics Manufacturing Services and Diversified Manufacturing Services. Its offerings include electronic design, rapid prototyping, and product management services, serving industries such as 5G, automotive, healthcare, and cloud. Founded in 1966 and based in Saint Petersburg, Florida, Jabil has a strong presence with 138K employees and a market cap of $25.5B.
Fabrinet Overview
Fabrinet specializes in optical packaging and precision manufacturing of optical, electro-mechanical, and electronic components. It serves original equipment manufacturers in optical communications, industrial lasers, automotive, and medical devices. Founded in 1999 and headquartered in Grand Cayman, Fabrinet employs 14K people and holds a market cap of $17.5B. The company’s manufacturing process emphasizes advanced packaging and final assembly.
Key similarities and differences
Both Jabil and Fabrinet operate in the technology sector within hardware and equipment manufacturing, offering specialized manufacturing services. While Jabil covers a broader range of industries with electronics and diversified manufacturing, Fabrinet focuses on precision optical and electro-mechanical components. Jabil’s workforce and market cap are significantly larger, reflecting its global scale compared to Fabrinet’s niche specialization.
Income Statement Comparison
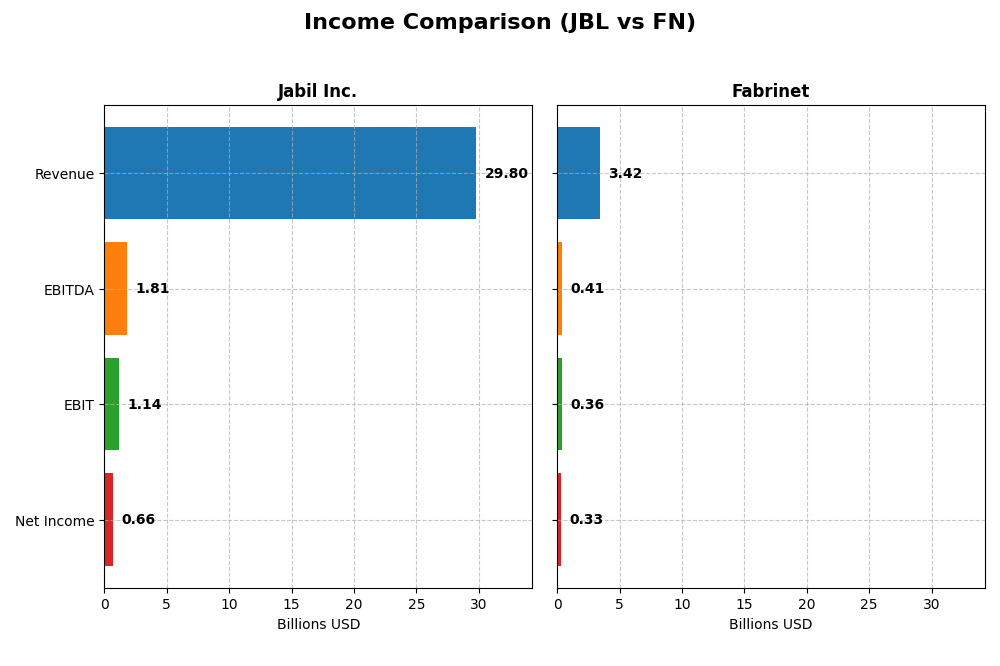
The following table presents a side-by-side comparison of key income statement metrics for Jabil Inc. and Fabrinet for the fiscal year 2025.
| Metric | Jabil Inc. (JBL) | Fabrinet (FN) |
|---|---|---|
| Market Cap | 25.5B | 17.5B |
| Revenue | 29.8B | 3.42B |
| EBITDA | 1.81B | 409M |
| EBIT | 1.14B | 355M |
| Net Income | 657M | 333M |
| EPS | 6.00 | 9.23 |
| Fiscal Year | 2025 | 2025 |
Income Statement Interpretations
Jabil Inc.
Jabil Inc. showed modest revenue growth of 1.77% over 2021-2025, with a notable decline in net income by 5.6%. Margins remained largely stable, with an 8.88% gross margin and 2.2% net margin in 2025, though EBIT margin slipped to 3.81%. The most recent year saw slowed growth and unfavorable declines in profitability, including a 40.96% drop in EBIT and a 54.13% net margin reduction.
Fabrinet
Fabrinet experienced strong revenue growth of 81.94% from 2021 to 2025 and a 124.16% increase in net income. Its 2025 gross margin stood at 12.09% and net margin at 9.72%, both favorable compared to prior years. EBIT margin was robust at 10.39%. Despite a slight 5.34% decrease in net margin growth in the last year, overall income statement trends are positive, driven by solid gains in revenue and earnings per share.
Which one has the stronger fundamentals?
Fabrinet’s fundamentals appear stronger, supported by consistent favorable income statement metrics including substantial revenue, net income, and margin improvements. Conversely, Jabil’s performance reflects mostly unfavorable trends with shrinking net income and margins over the period, despite stable revenue. Fabrinet’s higher profitability and growth rates provide more robust financial footing based on the data presented.
Financial Ratios Comparison
The table below presents a comparison of key financial ratios for Jabil Inc. and Fabrinet based on the most recent fiscal year data available, providing a snapshot of their performance and financial health.
| Ratios | Jabil Inc. (2025) | Fabrinet (2025) |
|---|---|---|
| ROE | 43.4% | 16.8% |
| ROIC | 16.1% | 15.0% |
| P/E | 34.1 | 32.0 |
| P/B | 14.8 | 5.4 |
| Current Ratio | 1.00 | 3.00 |
| Quick Ratio | 0.66 | 2.28 |
| D/E (Debt-to-Equity) | 2.22 | 0.003 |
| Debt-to-Assets | 18.2% | 0.2% |
| Interest Coverage | 4.8 | 0 (not available) |
| Asset Turnover | 1.61 | 1.21 |
| Fixed Asset Turnover | 9.01 | 8.85 |
| Payout ratio | 5.5% | 0% |
| Dividend yield | 0.16% | 0% |
Interpretation of the Ratios
Jabil Inc.
Jabil Inc. presents a mixed ratio profile with a strong return on equity (43.42%) and return on invested capital (16.06%), yet weak net margin (2.2%) and unfavorable valuation multiples (P/E 34.14, P/B 14.82). Liquidity ratios are neutral to weak, and debt levels are relatively high with a debt-to-equity of 2.22. The company pays a modest dividend with a low yield of 0.16%, indicating limited shareholder return through dividends.
Fabrinet
Fabrinet shows generally favorable financial ratios, including solid returns on equity (16.78%) and invested capital (15.01%), strong liquidity with a current ratio of 3.0, and no debt. However, P/E and P/B ratios remain unfavorable, reflecting a relatively high valuation. Fabrinet does not pay dividends, likely focusing on reinvestment and growth, supported by a debt-free balance sheet and strong cash flow metrics.
Which one has the best ratios?
Fabrinet holds a more favorable overall ratio profile with 64.29% favorable metrics, strong liquidity, and no leverage, reflecting financial stability. Jabil, despite strong profitability ratios, has multiple unfavorable valuation and liquidity indicators, resulting in a slightly unfavorable overall opinion. Fabrinet’s lack of dividends aligns with its growth and reinvestment strategy.
Strategic Positioning
This section compares the strategic positioning of JBL and FN regarding market position, key segments, and exposure to technological disruption:
JBL
- Large market cap of 25.5B with diversified competition in global EMS and diversified manufacturing services.
- Diverse business segments: Connected Living, Intelligent Infrastructure, and Regulated Industries drive revenue.
- Operates in electronics design, PCBA, and systems assembly with evolving technology demands.
FN
- Market cap of 17.5B focusing on optical packaging and precision electro-mechanical manufacturing.
- Concentrated in Optical Communications and Lasers, Sensors, and other precision components.
- Specialized in advanced optical, laser, and sensor technologies with high precision manufacturing.
JBL vs FN Positioning
JBL pursues a diversified strategy across multiple industries and manufacturing services, offering broad market exposure. FN maintains a focused approach on optical and sensor manufacturing, which may limit exposure but allows specialization. Diversification versus concentration presents distinct operational scopes.
Which has the best competitive advantage?
Both JBL and FN demonstrate a very favorable moat with growing ROIC above WACC, indicating durable competitive advantages and efficient capital use, though JBL’s broader segments may contribute to a more resilient position.
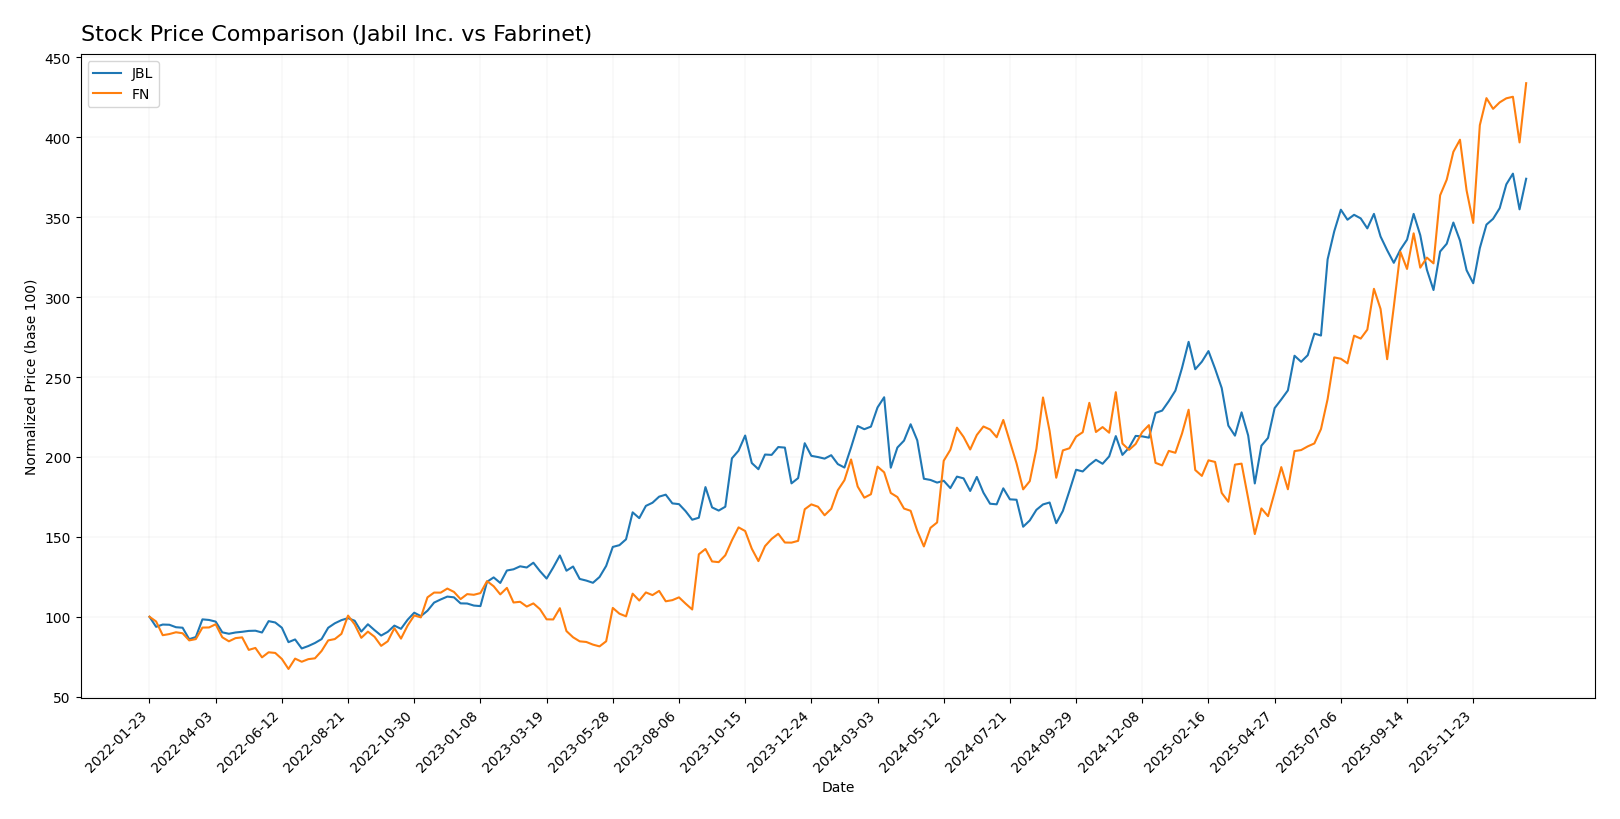
Stock Comparison
The stock prices of Jabil Inc. (JBL) and Fabrinet (FN) have demonstrated significant bullish momentum over the past 12 months, with FN showing stronger acceleration and higher volatility compared to JBL.
Trend Analysis
Jabil Inc. (JBL) posted a 70.84% price increase over the past year, reflecting a bullish trend with accelerating momentum. The stock ranged from a low of 99.62 to a high of 240.39, showing moderate volatility with a standard deviation of 42.66.
Fabrinet (FN) exhibited a stronger bullish trend, rising 145.58% in the same period. This stock also experienced acceleration and higher volatility, with prices fluctuating between 162.32 and 489.00 and a standard deviation of 85.95.
Comparing both, Fabrinet (FN) delivered the highest market performance with a larger price increase and greater acceleration, outperforming Jabil Inc. (JBL) over the past year.
Target Prices
The current analyst consensus points to promising upside potential for both Jabil Inc. and Fabrinet.
| Company | Target High | Target Low | Consensus |
|---|---|---|---|
| Jabil Inc. | 283 | 244 | 260.5 |
| Fabrinet | 600 | 537 | 568.5 |
Analysts expect Jabil’s price to rise above its current 238.35 USD, with consensus at 260.5 USD, while Fabrinet shows strong growth potential from 489 USD to a consensus near 568.5 USD.
Analyst Opinions Comparison
This section compares analysts’ ratings and grades for Jabil Inc. and Fabrinet:
Rating Comparison
JBL Rating
- Rating: B-, classified as Very Favorable by analysts.
- Discounted Cash Flow Score: Moderate at 3, indicating neutral valuation view.
- ROE Score: Very Favorable at 5, indicating strong profit generation.
- ROA Score: Moderate at 3, reflecting average asset utilization.
- Debt To Equity Score: Very Unfavorable at 1, signaling higher financial risk.
- Overall Score: Moderate at 3, showing average overall financial standing.
FN Rating
- Rating: A-, classified as Very Favorable by analysts.
- Discounted Cash Flow Score: Moderate at 3, suggesting a balanced valuation.
- ROE Score: Favorable at 4, showing efficient profit generation.
- ROA Score: Very Favorable at 5, indicating excellent asset utilization.
- Debt To Equity Score: Very Favorable at 5, indicating low financial risk.
- Overall Score: Favorable at 4, reflecting better overall financial health.
Which one is the best rated?
Fabrinet holds a stronger overall rating with an A- and a favorable overall score of 4, compared to Jabil’s B- and moderate 3. Fabrinet also shows superior ROA and debt-to-equity scores, indicating better asset use and financial stability.
Scores Comparison
Here is a comparison of the Altman Z-Score and Piotroski Score for Jabil Inc. and Fabrinet:
JBL Scores
- Altman Z-Score: 3.09, indicating a safe zone with low bankruptcy risk.
- Piotroski Score: 8, classified as very strong financial health.
FN Scores
- Altman Z-Score: 13.79, indicating a safe zone with very low bankruptcy risk.
- Piotroski Score: 4, classified as average financial health.
Which company has the best scores?
Fabrinet has a significantly higher Altman Z-Score, suggesting stronger bankruptcy safety. However, Jabil Inc. has a much higher Piotroski Score, reflecting stronger overall financial health. The scores favor different aspects of financial stability.
Grades Comparison
Here is a detailed comparison of the latest available grades for Jabil Inc. and Fabrinet:
Jabil Inc. Grades
The following table summarizes recent grades issued by major financial institutions for Jabil Inc.:
| Grading Company | Action | New Grade | Date |
|---|---|---|---|
| JP Morgan | Maintain | Overweight | 2025-12-18 |
| UBS | Maintain | Neutral | 2025-12-18 |
| Barclays | Maintain | Overweight | 2025-12-18 |
| B of A Securities | Maintain | Buy | 2025-12-10 |
| Barclays | Maintain | Overweight | 2025-09-26 |
| B of A Securities | Maintain | Buy | 2025-09-26 |
| JP Morgan | Maintain | Overweight | 2025-07-17 |
| B of A Securities | Maintain | Buy | 2025-06-20 |
| UBS | Maintain | Neutral | 2025-06-18 |
| JP Morgan | Maintain | Overweight | 2025-06-18 |
Overall, Jabil Inc. maintains mostly positive grades, dominated by “Overweight” and “Buy” ratings, indicating a generally favorable outlook.
Fabrinet Grades
The table below shows recent grades for Fabrinet from recognized grading firms:
| Grading Company | Action | New Grade | Date |
|---|---|---|---|
| Barclays | Maintain | Equal Weight | 2025-11-05 |
| Needham | Maintain | Buy | 2025-11-04 |
| JP Morgan | Maintain | Overweight | 2025-11-04 |
| Rosenblatt | Maintain | Buy | 2025-11-04 |
| JP Morgan | Maintain | Overweight | 2025-10-16 |
| Rosenblatt | Maintain | Buy | 2025-10-02 |
| JP Morgan | Upgrade | Overweight | 2025-08-25 |
| B. Riley Securities | Maintain | Neutral | 2025-08-19 |
| Needham | Maintain | Buy | 2025-08-19 |
| Rosenblatt | Maintain | Buy | 2025-08-19 |
Fabrinet’s grades reveal a strong leaning toward “Buy” and “Overweight” recommendations, suggesting a positive consensus among analysts.
Which company has the best grades?
Fabrinet has received a higher proportion of “Buy” and “Overweight” ratings compared to Jabil Inc., which shows a mix of “Buy,” “Overweight,” and “Neutral” grades. This difference may influence investors’ perception of Fabrinet as having a stronger growth or value potential.
Strengths and Weaknesses
Below is a comparative overview of key strengths and weaknesses for Jabil Inc. (JBL) and Fabrinet (FN) based on the most recent data.
| Criterion | Jabil Inc. (JBL) | Fabrinet (FN) |
|---|---|---|
| Diversification | Highly diversified with multiple segments: Connected Living & Digital Commerce (5.6B), Intelligent Infrastructure (12.3B), Regulated Industries (11.9B) | Less diversified, focused mainly on Optical Communications (2.6B) with smaller segments in Lasers and Sensors |
| Profitability | Mixed profitability: ROE strong at 43.4%, ROIC favorable at 16.1%, but net margin weak at 2.2% | Solid profitability: ROE 16.8%, ROIC 15.0%, net margin neutral at 9.7% |
| Innovation | Demonstrates durable competitive advantage with growing ROIC (25.4%) and value creation (ROIC > WACC by 6.9%) | Also shows durable competitive advantage with growing ROIC (19.9%) and value creation (ROIC > WACC by 6.4%) |
| Global presence | Strong global infrastructure reflected in diverse product segments and high asset turnover (1.61) | More niche global presence focused on optical and sensor technologies with good asset turnover (1.21) |
| Market Share | Large market with revenues exceeding 30B across segments | Smaller niche market with revenues around 2.6B in main segment |
Key takeaways: Jabil Inc. offers strong diversification and higher scale but has some margin pressures and liquidity concerns. Fabrinet excels in profitability ratios and operational efficiency within its niche but lacks diversification. Both show durable competitive moats with growing returns on capital, making them interesting but distinct investment candidates.
Risk Analysis
Below is a comparison of key risks for Jabil Inc. (JBL) and Fabrinet (FN) based on the most recent 2025 data:
| Metric | Jabil Inc. (JBL) | Fabrinet (FN) |
|---|---|---|
| Market Risk | Beta 1.25, moderate volatility | Beta 1.04, lower volatility |
| Debt level | Debt-to-equity 2.22 (high) | Debt-to-equity 0.0 (none) |
| Regulatory Risk | Moderate, operates globally | Moderate, global operations |
| Operational Risk | High complexity in diverse manufacturing services | Moderate, specialized optical manufacturing |
| Environmental Risk | Moderate, manufacturing impact | Moderate, optical manufacturing impact |
| Geopolitical Risk | Exposure due to global supply chains | Exposure due to global supply chains |
Jabil faces higher financial risk due to significant debt and operational complexity, while Fabrinet benefits from strong balance sheet and lower leverage. Market volatility is moderate for both, but Jabil’s higher beta implies more sensitivity to market swings. Operational and geopolitical risks remain relevant for both due to global manufacturing exposure.
Which Stock to Choose?
Jabil Inc. (JBL) shows a mixed income evolution with a slight revenue growth of 3.18% in 2025 but unfavorable profitability trends, including a 54.13% net margin decline. Its financial ratios are slightly unfavorable overall, with a strong ROE of 43.42% yet weaknesses in debt management and valuation metrics. The company maintains moderate debt levels and a very favorable B- rating, supported by a very favorable MOAT indicating durable competitive advantage.
Fabrinet (FN) demonstrates strong income growth, with 18.6% revenue growth in 2025 and favorable profitability metrics, despite a small dip in net margin growth. Its financial ratios are generally favorable, featuring low debt, excellent liquidity, and a solid ROE of 16.78%. FN holds a very favorable A- rating, supported by a very favorable MOAT and strong income statement performance signaling efficient capital use and competitive strength.
For investors, Fabrinet might appear more attractive for those prioritizing growth and financial stability, given its superior income growth and favorable financial ratios. Conversely, Jabil could be more relevant for risk-tolerant investors focused on companies with high ROE and a durable competitive moat despite recent income challenges. Each stock’s appeal depends on the investor’s risk tolerance and strategic focus.
Disclaimer: Investment carries a risk of loss of initial capital. The past performance is not a reliable indicator of future results. Be sure to understand risks before making an investment decision.
Go Further
I encourage you to read the complete analyses of Jabil Inc. and Fabrinet to enhance your investment decisions: