Garmin Ltd. and Fabrinet are two prominent players in the hardware, equipment, and parts industry, each excelling through distinct innovation strategies. Garmin focuses on consumer and professional GPS and wearable technology, while Fabrinet specializes in advanced optical and electro-mechanical manufacturing services. Their shared sector and technological edge make them worthy of comparison. In this article, I will help you identify which company presents the most compelling investment opportunity in 2026.

Table of contents
Companies Overview
I will begin the comparison between Garmin Ltd. and Fabrinet by providing an overview of these two companies and their main differences.
Garmin Ltd. Overview
Garmin Ltd. designs, develops, manufactures, markets, and distributes a broad range of wireless devices worldwide. The company operates across several segments, including fitness, outdoor, aviation, marine, and automotive, offering products such as sport watches, avionics, chartplotters, and infotainment systems. Founded in 1989 and based in Switzerland, Garmin holds a strong position in the hardware, equipment, and parts industry with a market cap of 41.16B USD.
Fabrinet Overview
Fabrinet provides optical packaging and precision manufacturing services globally, specializing in optical, electro-mechanical, and electronic components. Its product portfolio includes optical modules, lasers, sensors, and custom glass products serving diverse sectors like telecommunications, industrial lasers, automotive, and medical devices. Incorporated in 1999 and headquartered in the Cayman Islands, Fabrinet operates within the hardware, equipment, and parts industry with a market cap of 17.52B USD.
Key similarities and differences
Both Garmin and Fabrinet operate in the technology sector, focusing on hardware and equipment manufacturing, yet their product scopes differ significantly. Garmin offers consumer and professional wireless devices with a strong presence in fitness and navigation, while Fabrinet concentrates on advanced optical and electro-mechanical manufacturing services for communication and industrial markets. Despite their shared industry, Garmin’s business model emphasizes finished product sales, whereas Fabrinet primarily provides manufacturing services to original equipment manufacturers.
Income Statement Comparison
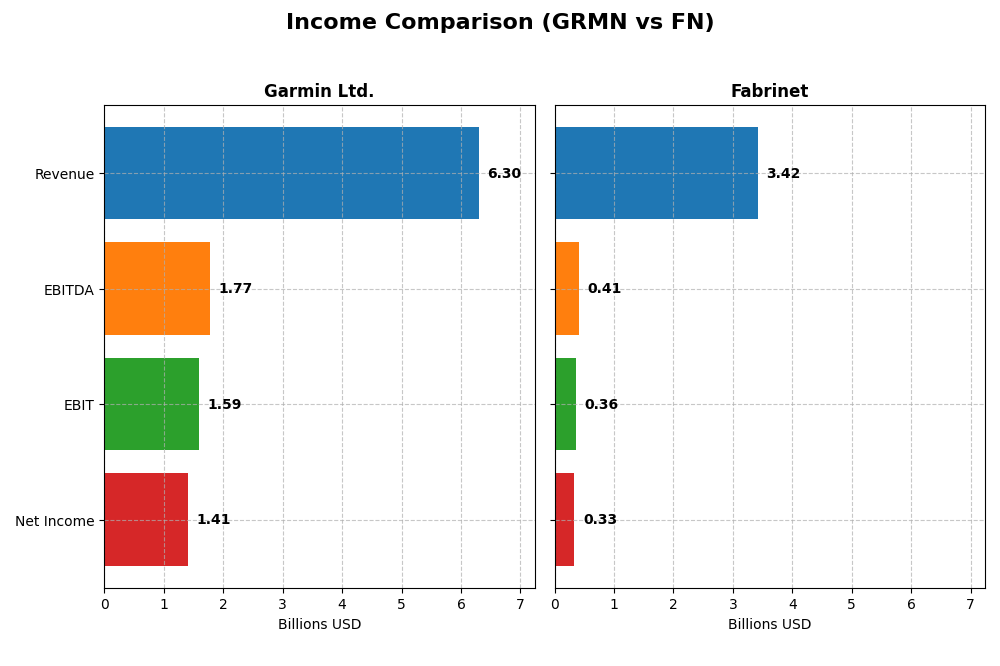
The table below presents a side-by-side comparison of the most recent fiscal year income statement figures for Garmin Ltd. and Fabrinet, providing key financial metrics for evaluation.
| Metric | Garmin Ltd. (GRMN) | Fabrinet (FN) |
|---|---|---|
| Market Cap | 41.2B | 17.5B |
| Revenue | 6.30B | 3.42B |
| EBITDA | 1.77B | 409M |
| EBIT | 1.59B | 355M |
| Net Income | 1.41B | 333M |
| EPS | 7.35 | 9.23 |
| Fiscal Year | 2024 | 2025 |
Income Statement Interpretations
Garmin Ltd.
Garmin Ltd. showed consistent revenue growth from 4.19B in 2020 to 6.30B in 2024, with net income rising from 992M to 1.41B. Margins remained strong and stable, with a gross margin of 58.7% and an EBIT margin of 25.31% in 2024. The latest year reflected favorable revenue and EBIT growth, though net margin slightly declined.
Fabrinet
Fabrinet’s revenue increased significantly from 1.88B in 2021 to 3.42B in 2025, alongside net income growth from 148M to 333M. Gross margin was modest at 12.09%, but EBIT and net margins were favorable at 10.39% and 9.72%, respectively. The most recent year showed solid revenue and EPS growth, offset by a small net margin contraction.
Which one has the stronger fundamentals?
Both companies demonstrate favorable overall income statement evaluations with over 85% favorable metrics. Garmin leads with higher margins and stable profitability, while Fabrinet shows stronger revenue and net income growth rates with improving margins. Garmin’s margin stability contrasts with Fabrinet’s rapid expansion, indicating differing fundamental strengths for investors to consider.
Financial Ratios Comparison
The following table compares key financial ratios for Garmin Ltd. (GRMN) and Fabrinet (FN) based on the most recent available data for fiscal year 2024 and mid-2025 respectively.
| Ratios | Garmin Ltd. (GRMN) 2024 | Fabrinet (FN) 2025 |
|---|---|---|
| ROE | 17.98% | 16.78% |
| ROIC | 16.28% | 15.01% |
| P/E | 28.5 | 32.0 |
| P/B | 5.13 | 5.37 |
| Current Ratio | 3.54 | 3.00 |
| Quick Ratio | 2.56 | 2.28 |
| D/E (Debt to Equity) | 0.021 | 0.003 |
| Debt-to-Assets | 1.69% | 0.19% |
| Interest Coverage | 0 | 0 |
| Asset Turnover | 0.65 | 1.21 |
| Fixed Asset Turnover | 4.49 | 8.85 |
| Payout Ratio | 40.6% | 0% |
| Dividend Yield | 1.42% | 0% |
Note: Interest Coverage ratio is reported as zero for both companies in the latest data. Dividend data for Fabrinet shows no payouts as of the latest fiscal year.
Interpretation of the Ratios
Garmin Ltd.
Garmin Ltd. shows generally strong ratios with favorable net margin at 22.41%, ROE of 17.98%, and ROIC of 16.28%, indicating solid profitability and capital efficiency. However, valuation multiples like P/E at 28.5 and P/B at 5.13 are considered unfavorable, alongside a high current ratio of 3.54, suggesting potential overcapitalization. The company pays dividends, with a 1.42% yield, indicating moderate shareholder returns supported by free cash flow coverage.
Fabrinet
Fabrinet’s ratios present a favorable overall picture, with a strong ROE of 16.78%, ROIC of 15.01%, and efficient asset turnover at 1.21. While its net margin is neutral at 9.72%, it maintains a solid liquidity position with a current ratio of 3.0 and no debt. Fabrinet does not pay dividends, likely focusing on reinvestment or growth, with no share buybacks reported, prioritizing operational expansion.
Which one has the best ratios?
Both Garmin Ltd. and Fabrinet have favorable global ratio evaluations, but Fabrinet edges ahead with a higher percentage of favorable ratios (64.29% vs. 57.14%) and stronger efficiency metrics like asset turnover and fixed asset turnover. Garmin’s valuation multiples and liquidity ratios present some caution, whereas Fabrinet’s lack of dividends reflects a different capital allocation strategy rather than a weakness.
Strategic Positioning
This section compares the strategic positioning of Garmin Ltd. and Fabrinet in terms of market position, key segments, and exposure to technological disruption:
Garmin Ltd.
- Large market cap of 41B USD in hardware, with broad competitive pressure in tech segments.
- Diversified segments: Fitness, Outdoor, Marine, Aviation, and Automotive Mobile driving revenues.
- Exposure includes wireless devices and avionics, with evolving digital platforms and connectivity.
Fabrinet
- Mid-sized market cap of 17.5B USD, focused on precision optical and electro-mechanical manufacturing.
- Concentrated in optical communications and lasers, sensors, and other precision components.
- Faces disruption risks from advancements in optical and laser technologies in communications.
Garmin Ltd. vs Fabrinet Positioning
Garmin adopts a diversified product strategy across multiple consumer and professional hardware segments, offering resilience but also broad competition. Fabrinet concentrates on specialized manufacturing for optical communications and sensors, benefiting from niche focus but higher dependency on specific technologies.
Which has the best competitive advantage?
Fabrinet shows a very favorable moat with growing ROIC, indicating a durable competitive advantage and increasing profitability. Garmin has a favorable moat with stable profitability, reflecting a solid but less dynamic competitive position.
Stock Comparison
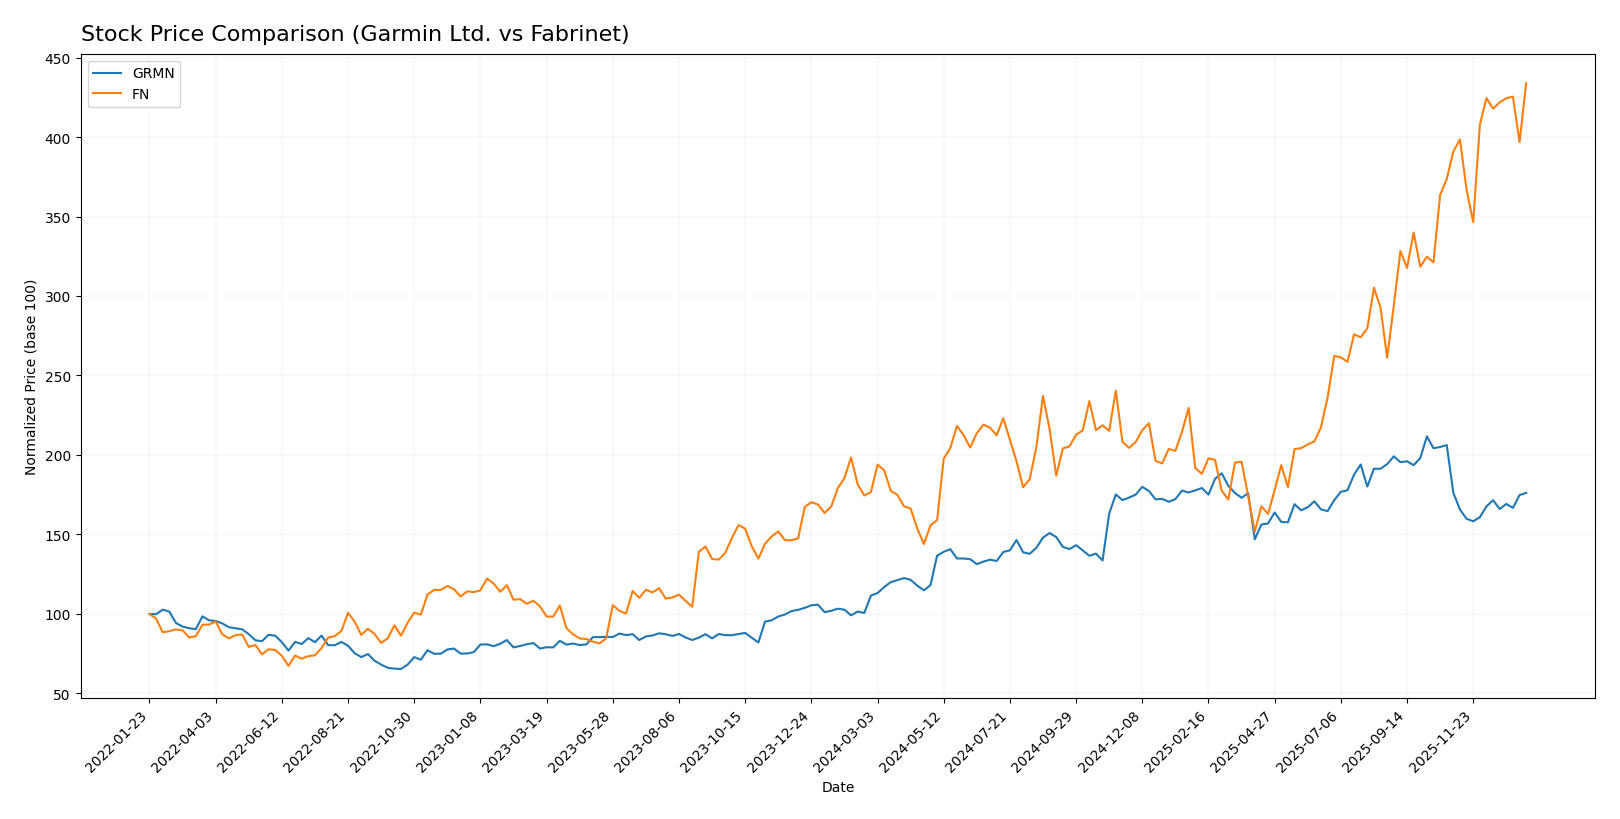
The past year revealed significant bullish momentum for both Garmin Ltd. and Fabrinet, with Fabrinet exhibiting stronger price appreciation and recent trading dynamics indicating diverging buyer-seller dominance.
Trend Analysis
Garmin Ltd. showed a strong bullish trend over the past 12 months with a 57.86% price increase, marked by acceleration and a high volatility level (std deviation 29.55). Recent weeks indicate a neutral trend with a slight -0.01% change.
Fabrinet exhibited a pronounced bullish trend with a 145.58% rise over the same period, also accelerating and displaying higher volatility (std deviation 85.95). Its recent trend remains bullish, gaining 10.99% with increased buyer dominance.
Comparing both, Fabrinet outperformed Garmin Ltd. in market performance over the last year, delivering the highest price appreciation and maintaining bullish momentum recently.
Target Prices
The latest analyst consensus target prices indicate potential upside for both Garmin Ltd. and Fabrinet.
| Company | Target High | Target Low | Consensus |
|---|---|---|---|
| Garmin Ltd. | 310 | 193 | 237 |
| Fabrinet | 600 | 499 | 549.5 |
Analysts expect Garmin’s stock to rise modestly above the current price of $213.93, with a consensus target of $237. Fabrinet’s target consensus of $549.5 suggests significant upside from its current price of $489.00.
Analyst Opinions Comparison
This section compares analysts’ ratings and grades for Garmin Ltd. and Fabrinet:
Rating Comparison
Garmin Ltd. Rating
- Rating: A- with a very favorable status
- Discounted Cash Flow Score: 3, indicating moderate value
- ROE Score: 4, showing favorable profit generation
- ROA Score: 5, reflecting very favorable asset efficiency
- Debt To Equity Score: 4, indicating favorable financial risk
- Overall Score: 4, favorable financial standing
Fabrinet Rating
- Rating: A- with a very favorable status
- Discounted Cash Flow Score: 3, indicating moderate value
- ROE Score: 4, showing favorable profit generation
- ROA Score: 5, reflecting very favorable asset efficiency
- Debt To Equity Score: 5, indicating very favorable financial risk
- Overall Score: 4, favorable financial standing
Which one is the best rated?
Both companies share the same overall rating (A-) and scores in DCF, ROE, ROA, and overall metrics. Fabrinet holds a slightly better debt-to-equity score, indicating lower financial risk in comparison to Garmin Ltd.
Scores Comparison
Here is a comparison of the Altman Z-Score and Piotroski Score for Garmin Ltd. and Fabrinet:
GRMN Scores
- Altman Z-Score: 14.62, well within the safe zone.
- Piotroski Score: 5, indicating average financial health.
FN Scores
- Altman Z-Score: 13.79, also firmly in the safe zone.
- Piotroski Score: 4, reflecting average financial health.
Which company has the best scores?
Both Garmin Ltd. and Fabrinet have Altman Z-Scores in the safe zone, indicating low bankruptcy risk. Garmin has a slightly higher Z-Score and a marginally better Piotroski Score, suggesting somewhat stronger financial stability based on the provided data.
Grades Comparison
Here is a detailed comparison of the grading trends from recognized financial institutions for both companies:
Garmin Ltd. Grades
The table below summarizes recent analyst grades for Garmin Ltd. from verified grading companies:
| Grading Company | Action | New Grade | Date |
|---|---|---|---|
| Tigress Financial | Maintain | Strong Buy | 2025-12-19 |
| Longbow Research | Upgrade | Buy | 2025-12-03 |
| Barclays | Maintain | Underweight | 2025-10-30 |
| Morgan Stanley | Maintain | Underweight | 2025-10-30 |
| Tigress Financial | Maintain | Strong Buy | 2025-09-30 |
| Morgan Stanley | Maintain | Underweight | 2025-09-19 |
| Morgan Stanley | Maintain | Underweight | 2025-07-31 |
| Barclays | Maintain | Underweight | 2025-07-31 |
| JP Morgan | Maintain | Neutral | 2025-07-17 |
| JP Morgan | Maintain | Neutral | 2025-05-01 |
Garmin Ltd. shows a mixed trend with strong buy ratings from Tigress Financial, contrasted by persistent underweight ratings from Barclays and Morgan Stanley, indicating a divided analyst outlook.
Fabrinet Grades
The following table shows recent verified analyst grades for Fabrinet:
| Grading Company | Action | New Grade | Date |
|---|---|---|---|
| Barclays | Maintain | Equal Weight | 2025-11-05 |
| Needham | Maintain | Buy | 2025-11-04 |
| JP Morgan | Maintain | Overweight | 2025-11-04 |
| Rosenblatt | Maintain | Buy | 2025-11-04 |
| JP Morgan | Maintain | Overweight | 2025-10-16 |
| Rosenblatt | Maintain | Buy | 2025-10-02 |
| JP Morgan | Upgrade | Overweight | 2025-08-25 |
| B. Riley Securities | Maintain | Neutral | 2025-08-19 |
| Needham | Maintain | Buy | 2025-08-19 |
| Rosenblatt | Maintain | Buy | 2025-08-19 |
Fabrinet’s ratings predominantly show buy and overweight opinions, with consistent maintenance of positive grades, reflecting a broadly favorable analyst consensus.
Which company has the best grades?
Fabrinet has received a stronger and more consistent set of buy and overweight grades compared to Garmin Ltd., which displays a polarized rating spectrum from strong buy to underweight. This divergence suggests Fabrinet may be viewed more optimistically by analysts, potentially influencing investor sentiment towards more confidence in its near-term prospects.
Strengths and Weaknesses
Below is a comparison of Garmin Ltd. (GRMN) and Fabrinet (FN) highlighting their key strengths and weaknesses based on recent financial and operational data.
| Criterion | Garmin Ltd. (GRMN) | Fabrinet (FN) |
|---|---|---|
| Diversification | Highly diversified across Automotive, Aviation, Fitness, Marine, and Outdoor segments, reducing dependency on any single market | Primarily focused on Optical Communications with some exposure to Lasers and Sensors; less diversified |
| Profitability | Strong profitability with 22.4% net margin and 17.98% ROE; consistently creates value (ROIC 16.3%) | Moderate profitability with 9.7% net margin but solid ROE of 16.8%; also value-creating (ROIC 15.0%) |
| Innovation | Stable innovation reflected by favorable ROIC trend and product mix across growing segments | Rapidly growing ROIC trend indicates increasing innovation and efficiency in optical tech manufacturing |
| Global presence | Broad global footprint with varied product lines serving multiple industries worldwide | Global player in optical components manufacturing but more niche market focus |
| Market Share | Established market leader in multiple segments with strong brand recognition | Leading contract manufacturer in optical communications but narrower market scope |
Key takeaways: Garmin shows strength in diversification and profitability with a stable competitive advantage. Fabrinet exhibits a very favorable moat due to strong ROIC growth and niche market focus, though with less diversification. Both demonstrate solid value creation but differ in market breadth and innovation scope.
Risk Analysis
Below is a comparative risk overview of Garmin Ltd. (GRMN) and Fabrinet (FN) based on recent financial data and market conditions.
| Metric | Garmin Ltd. (GRMN) | Fabrinet (FN) |
|---|---|---|
| Market Risk | Beta 1.013: Moderate market volatility sensitivity | Beta 1.035: Slightly higher market volatility sensitivity |
| Debt level | Very low debt-to-equity 0.02; strong balance sheet | Virtually no debt (0.0 debt-to-equity); very strong balance sheet |
| Regulatory Risk | Moderate: Technology sector with global operations, subject to varying international regulations | Moderate: Operates in manufacturing, exposed to trade and export regulations |
| Operational Risk | Diversified product lines reducing operational risk | Concentrated in optical manufacturing; supply chain dependency risks |
| Environmental Risk | Moderate: Manufacturing footprint with sustainability initiatives | Moderate: Manufacturing impacts and raw material sourcing challenges |
| Geopolitical Risk | Exposure to multiple regions including Americas, Asia, Europe | Exposure mainly in Asia-Pacific and Europe; susceptible to geopolitical tensions affecting supply chains |
Garmin’s most impactful risks are moderate market sensitivity and international regulatory challenges given its global footprint. Fabrinet faces operational risks linked to supply chain dependencies and geopolitical tensions in Asia. Both have very low debt, reducing financial distress risk, and maintain solid financial health with Altman Z-scores well within the safe zone. Investors should weigh Garmin’s product diversification against Fabrinet’s supply chain concentration when managing portfolio risks.
Which Stock to Choose?
Garmin Ltd. (GRMN) shows strong income growth with a 20.44% revenue rise in 2024 and favorable profitability ratios, including a 22.41% net margin. The company maintains low debt, a very favorable rating, and a stable economic moat indicated by ROIC exceeding WACC by 7.77%.
Fabrinet (FN) exhibits robust income expansion with an 18.6% revenue increase in 2025 and favorable profitability metrics, including a 9.72% net margin. Debt levels are minimal, ratings are very favorable, and the company shows a very favorable and growing economic moat with ROIC surpassing WACC by 6.38%.
For investors prioritizing stable profitability and a solid competitive position, Garmin’s consistent value creation and strong margins might appear attractive. Conversely, those favoring a company with a rapidly growing economic moat and higher recent price appreciation might see Fabrinet as more compelling, especially given its strong income growth and improving profitability.
Disclaimer: Investment carries a risk of loss of initial capital. The past performance is not a reliable indicator of future results. Be sure to understand risks before making an investment decision.
Go Further
I encourage you to read the complete analyses of Garmin Ltd. and Fabrinet to enhance your investment decisions: