Home > Comparison > Technology > FTV vs FN
The strategic rivalry between Fortive Corporation and Fabrinet defines the current trajectory of the Technology sector’s hardware and equipment landscape. Fortive operates as a diversified industrial technology leader, blending engineered products with software services. Fabrinet specializes in precision optical and electro-mechanical manufacturing with a strong focus on advanced packaging. This analysis pits industrial breadth against niche specialization to identify the superior risk-adjusted outlook for a diversified portfolio.

Table of contents
Companies Overview
Fortive Corporation and Fabrinet stand as pivotal players in the hardware and equipment sector, shaping technology markets globally.
Fortive Corporation: Diverse Industrial Technology Leader
Fortive Corporation leads in professional and engineered products, generating revenue through connected reliability tools, industrial software, and advanced healthcare solutions. Its 2026 focus sharpens on integrated software services and precision test tools across manufacturing, healthcare, and energy sectors. Fortive’s broad brand portfolio underpins its market strength and operational resilience.
Fabrinet: Precision Optical Manufacturing Expert
Fabrinet specializes in optical and electro-mechanical manufacturing services, driving revenue via complex assembly and testing of optical components for communications and industrial lasers. In 2026, Fabrinet prioritizes advanced packaging and supply chain innovation to support data center and semiconductor clients. Its niche expertise in high-speed optical connectivity defines its competitive edge.
Strategic Collision: Similarities & Divergences
Both firms serve the hardware and equipment industry but pursue different philosophies: Fortive embraces a diversified portfolio with software integration, while Fabrinet focuses on specialized optical manufacturing precision. Their primary battleground is industrial technology innovation and supply chain efficiency. Investors face distinct risk profiles: Fortive’s multi-industry exposure contrasts with Fabrinet’s concentrated high-tech manufacturing specialization.
Income Statement Comparison
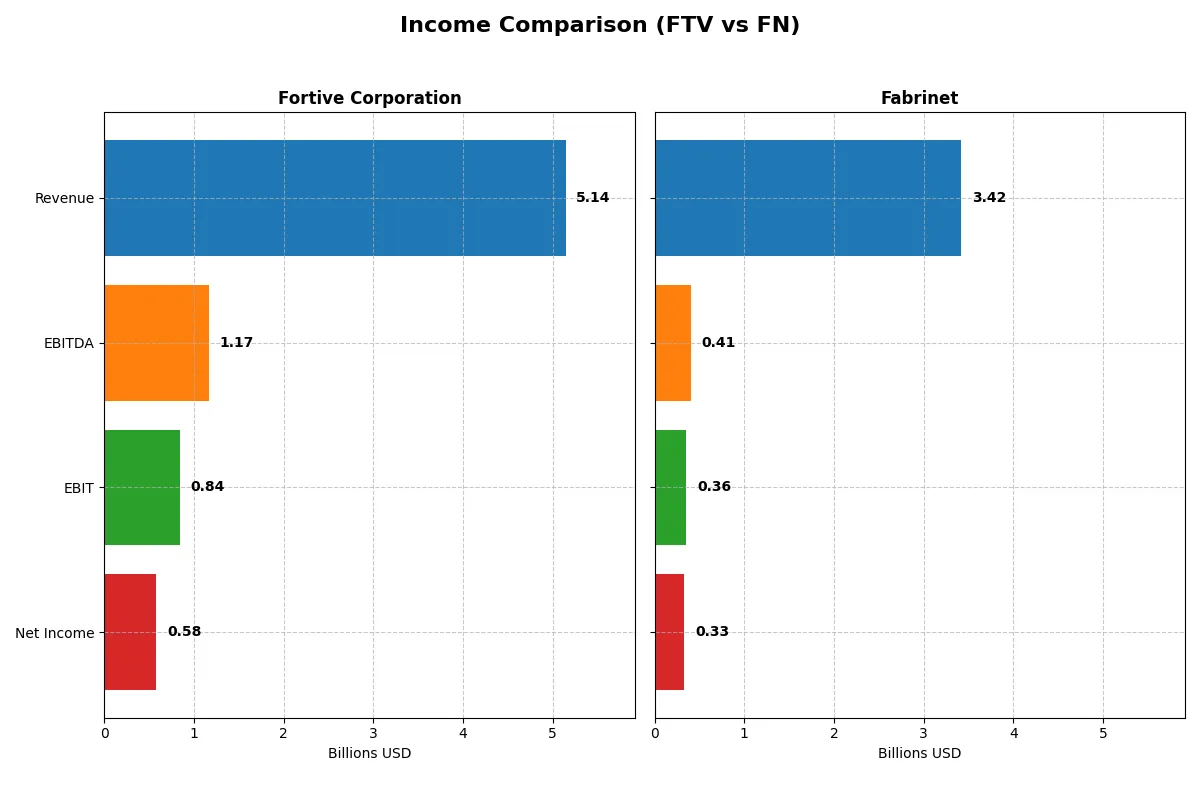
This data dissects the core profitability and scalability of both corporate engines to reveal who dominates the bottom line:
| Metric | Fortive Corporation (FTV) | Fabrinet (FN) |
|---|---|---|
| Revenue | 5.14B | 3.42B |
| Cost of Revenue | 2.01B | 3.01B |
| Operating Expenses | 2.23B | 89M |
| Gross Profit | 3.13B | 413M |
| EBITDA | 1.17B | 409M |
| EBIT | 843M | 355M |
| Interest Expense | 121M | 0 |
| Net Income | 579M | 333M |
| EPS | 1.75 | 9.23 |
| Fiscal Year | 2025 | 2025 |
Income Statement Analysis: The Bottom-Line Duel
This income statement comparison reveals which company operates its business more efficiently, balancing scale and profitability over recent years.
Fortive Corporation Analysis
Fortive’s revenue peaked at 6.23B in 2024 but declined to 5.14B in 2025, dragging net income down from 833M to 579M. Its gross margin remains robust near 61%, and net margin holds at 11.3%, reflecting disciplined cost control despite falling top-line momentum. However, year-over-year declines in revenue and EBIT highlight operational headwinds in 2025.
Fabrinet Analysis
Fabrinet’s revenue climbed steadily from 1.88B in 2021 to 3.42B in 2025, with net income more than doubling to 333M. Margins are leaner, with a 12.1% gross margin but a solid 9.7% net margin, supported by zero interest expense. The company shows strong revenue and EBIT growth, signaling improving efficiency and expanding scale in a competitive niche.
Margin Strength vs. Growth Momentum
Fortive delivers higher margins but suffers recent revenue and net income contraction, signaling operational challenges. Fabrinet posts impressive top-line and bottom-line growth, with improving margins and negligible interest costs. For investors prioritizing growth and expanding profitability, Fabrinet’s profile appears more compelling amid Fortive’s margin resilience but shrinking scale.
Financial Ratios Comparison
These vital ratios act as a diagnostic tool to expose the underlying fiscal health, valuation premiums, and capital efficiency of each company:
| Ratios | Fortive Corporation (FTV) | Fabrinet (FN) |
|---|---|---|
| ROE | 8.98% | 16.78% |
| ROIC | 7.44% | 15.00% |
| P/E | 30.16 | 32.02 |
| P/B | 2.71 | 5.37 |
| Current Ratio | 0.71 | 3.00 |
| Quick Ratio | 0.58 | 2.28 |
| D/E | 0.50 | 0.003 |
| Debt-to-Assets | 27.31% | 0.19% |
| Interest Coverage | 7.54 | 0 |
| Asset Turnover | 0.44 | 1.21 |
| Fixed Asset Turnover | 19.06 | 8.85 |
| Payout ratio | 15.92% | 0% |
| Dividend yield | 0.53% | 0% |
| Fiscal Year | 2025 | 2025 |
Efficiency & Valuation Duel: The Vital Signs
Financial ratios act as a company’s DNA, unveiling hidden risks and operational strengths that shape investor confidence and valuation.
Fortive Corporation
Fortive posts a modest 8.98% ROE, below sector expectations, signaling challenges in profitability. Its P/E of 30.16 suggests a stretched valuation compared to peers. The company yields a low 0.53% dividend, indicating limited shareholder returns and a focus on reinvestment in R&D at 6.66% of sales, emphasizing growth over payouts.
Fabrinet
Fabrinet shines with a robust 16.78% ROE and a solid 15% ROIC, demonstrating efficient capital deployment. However, its expensive P/E of 32.02 and high P/B of 5.37 suggest stretched valuation. The absence of dividends indicates reinvestment in operations, supporting sustained growth and operational efficiency, backed by a strong balance sheet and liquidity ratios.
Premium Valuation vs. Operational Safety
Fabrinet offers superior profitability and stronger balance sheet metrics, justifying its premium valuation. Fortive’s lower returns and stretched multiples present more risk. Investors prioritizing growth with operational safety may lean toward Fabrinet, while those favoring modest yields and R&D focus may consider Fortive’s profile.
Which one offers the Superior Shareholder Reward?
I compare Fortive Corporation (FTV) and Fabrinet (FN) on dividends and buybacks. FTV pays a modest dividend yield near 0.53%, with a sustainable payout ratio around 15%, covering dividends well with free cash flow (FCF). It also executes steady buybacks, enhancing total shareholder return. FN pays no dividends but reinvests heavily in growth and innovation, reflected in soaring revenue and high asset turnover. FN’s buyback activity is minimal, focusing on expansion. Historically, dividend payers like FTV provide more predictable income, but FN’s reinvestment fuels higher growth potential. For 2026, I favor FTV’s balanced distribution and buybacks, offering a superior total return with lower risk.
Comparative Score Analysis: The Strategic Profile
The radar chart reveals the fundamental DNA and trade-offs of Fortive Corporation and Fabrinet, highlighting their core financial strengths and vulnerabilities:
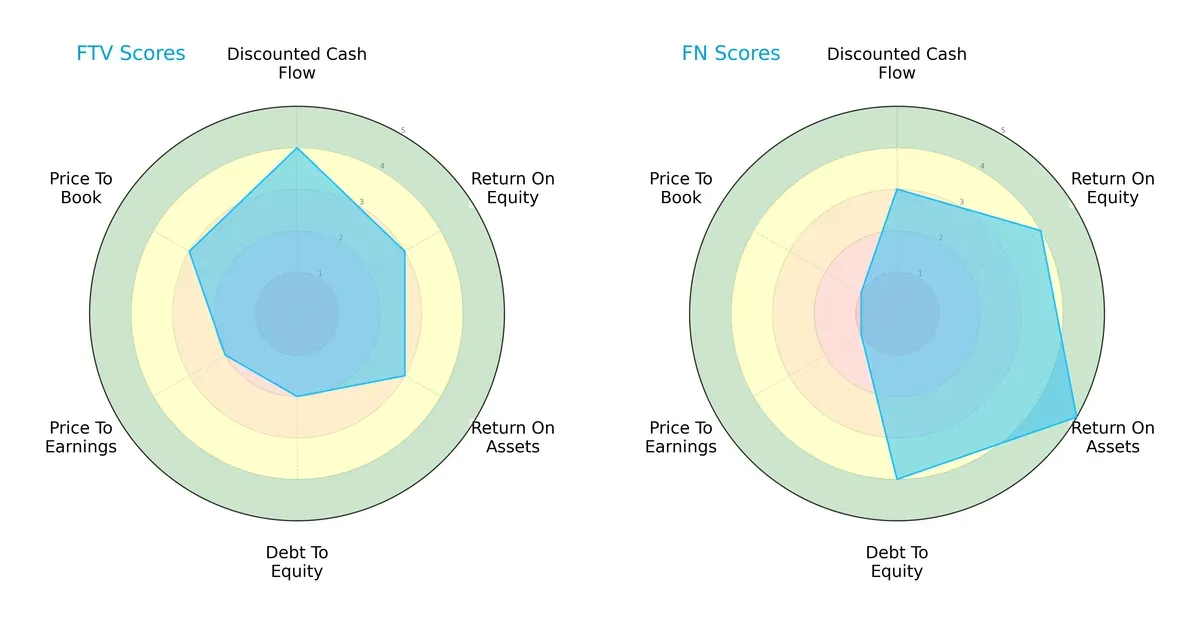
Fortive shows strength in discounted cash flow with a score of 4, but lags in debt-to-equity and valuation metrics (scores of 2). Fabrinet excels in return on equity (4) and assets (5), plus a stronger debt-to-equity score (4), yet suffers from very unfavorable valuation scores (1). Fortive presents a more balanced profile, while Fabrinet relies heavily on operational efficiency but trades at a steep premium.
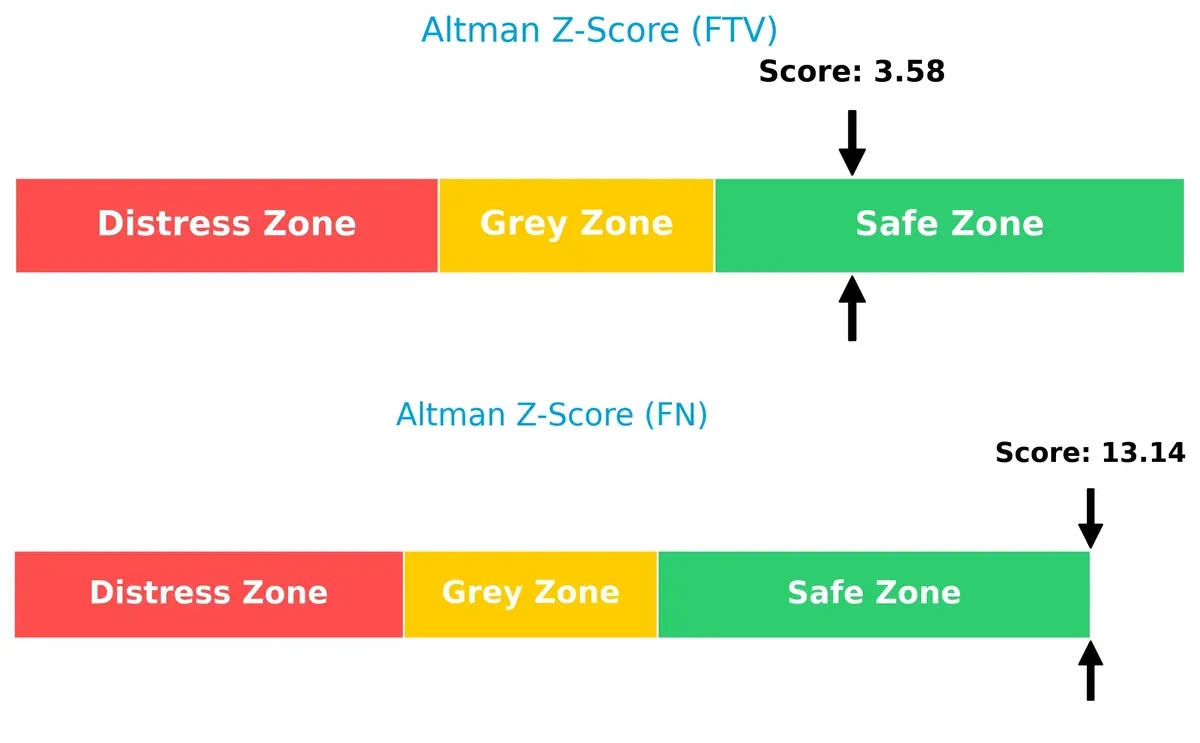
Bankruptcy Risk: Solvency Showdown
Fortive’s Altman Z-Score of 3.58 versus Fabrinet’s 13.14 places both firms comfortably in the safe zone, but Fabrinet’s far superior score signals a significantly stronger buffer against bankruptcy risk in this economic cycle:
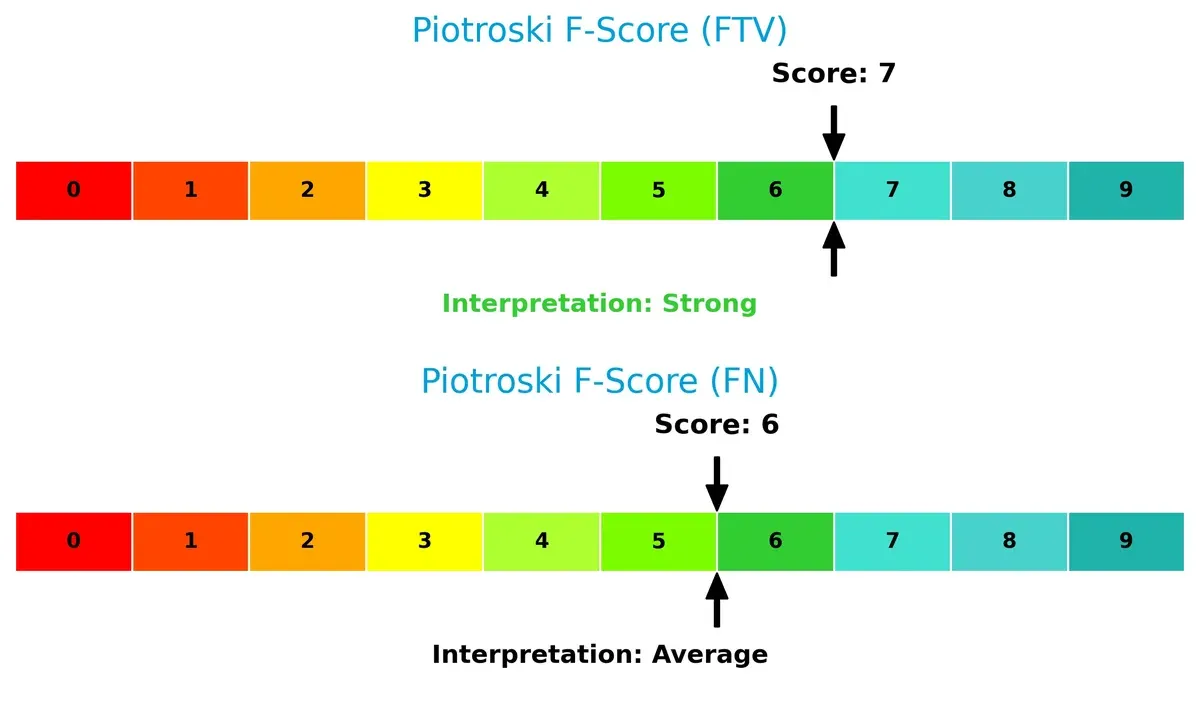
Financial Health: Quality of Operations
Fortive’s Piotroski F-Score of 7 indicates strong financial health, outperforming Fabrinet’s 6, which is merely average. Fortive’s internal metrics suggest fewer red flags and more consistent operational quality:
How are the two companies positioned?
This section dissects the operational DNA of Fortive and Fabrinet by comparing their revenue distribution and internal dynamics. The goal is to confront their economic moats to reveal which model delivers the most resilient, sustainable advantage today.
Revenue Segmentation: The Strategic Mix
This visual comparison dissects how Fortive Corporation and Fabrinet diversify their income streams and where their primary sector bets lie:
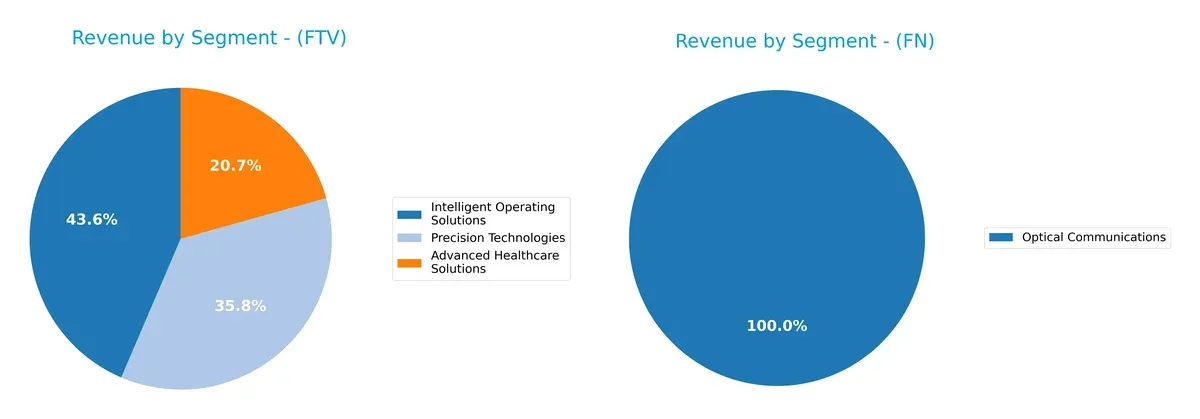
Fortive reveals a balanced revenue mix, with Intelligent Operating Solutions at $2.7B, Precision Technologies at $2.2B, and Advanced Healthcare Solutions at $1.3B in 2024. This diversification reduces concentration risk and anchors Fortive’s ecosystem lock-in. Fabrinet, by contrast, pivots heavily on Optical Communications, which dwarfs all other segments at $2.6B, signaling a dominant reliance that heightens sector-specific risks despite scale advantages.
Strengths and Weaknesses Comparison
This table compares the Strengths and Weaknesses of Fortive Corporation and Fabrinet:
Fortive Corporation Strengths
- Diversified revenue across Advanced Healthcare, Intelligent Operating, and Precision Technologies
- Favorable net margin at 11.26%
- Low debt-to-assets ratio at 27.31% supports financial stability
- Strong fixed asset turnover at 19.06
- Global presence with significant US and international sales
Fabrinet Strengths
- High profitability with ROE at 16.78% and ROIC at 15.0%
- Strong liquidity indicated by current ratio of 3.0 and quick ratio of 2.28
- No debt enhances financial flexibility
- Asset turnover of 1.21 shows efficient use of assets
- Diverse geographic exposure across Asia Pacific, Europe, and North America
Fortive Corporation Weaknesses
- Low current and quick ratios below 1 signal liquidity risk
- ROE at 8.98% is unfavorable compared to sector peers
- PE ratio of 30.16 suggests high valuation risk
- Asset turnover at 0.44 indicates less efficient asset use
- Dividend yield low at 0.53%
Fabrinet Weaknesses
- High PE of 32.02 and PB ratio at 5.37 signal valuation concerns
- Zero dividend yield may deter income-focused investors
- Less diversified product base focused on Optical Communications
- Neutral net margin at 9.72% limits profitability strength
Fortive’s diversified business model and solid margin provide resilience, but liquidity constraints and efficiency issues pose risks. Fabrinet’s strong profitability and financial health underpin a favorable profile, though valuation and product concentration introduce caution. Both companies’ strengths and weaknesses shape their strategic options distinctly.
The Moat Duel: Analyzing Competitive Defensibility
A durable structural moat alone shields long-term profits from relentless competitive erosion in capital-intensive industries:
Fortive Corporation: Diverse Industrial Software & Tools Moat
Fortive relies on intangible assets and brand portfolio to sustain margin stability and 16.4% EBIT margin. Its growing ROIC signals improving capital efficiency despite recent revenue weakness. New connected reliability and healthcare software could deepen its moat by 2026.
Fabrinet: Precision Manufacturing Scale & Customer Integration Moat
Fabrinet’s cost advantage and specialized manufacturing capabilities contrast with Fortive’s software focus. It delivers a solid 10.4% EBIT margin and growing ROIC well above WACC, reflecting strong value creation. Robust revenue growth and expansion into optical components mark promising 2026 prospects.
Verdict: Intangible Asset Breadth vs. Cost Leadership Depth
Fabrinet holds the deeper moat with ROIC exceeding WACC by over 6%, creating clear economic value, unlike Fortive which still destroys value despite improving ROIC. Fabrinet’s focused scale and growth better equip it to defend market share amid competitive pressures.
Which stock offers better returns?
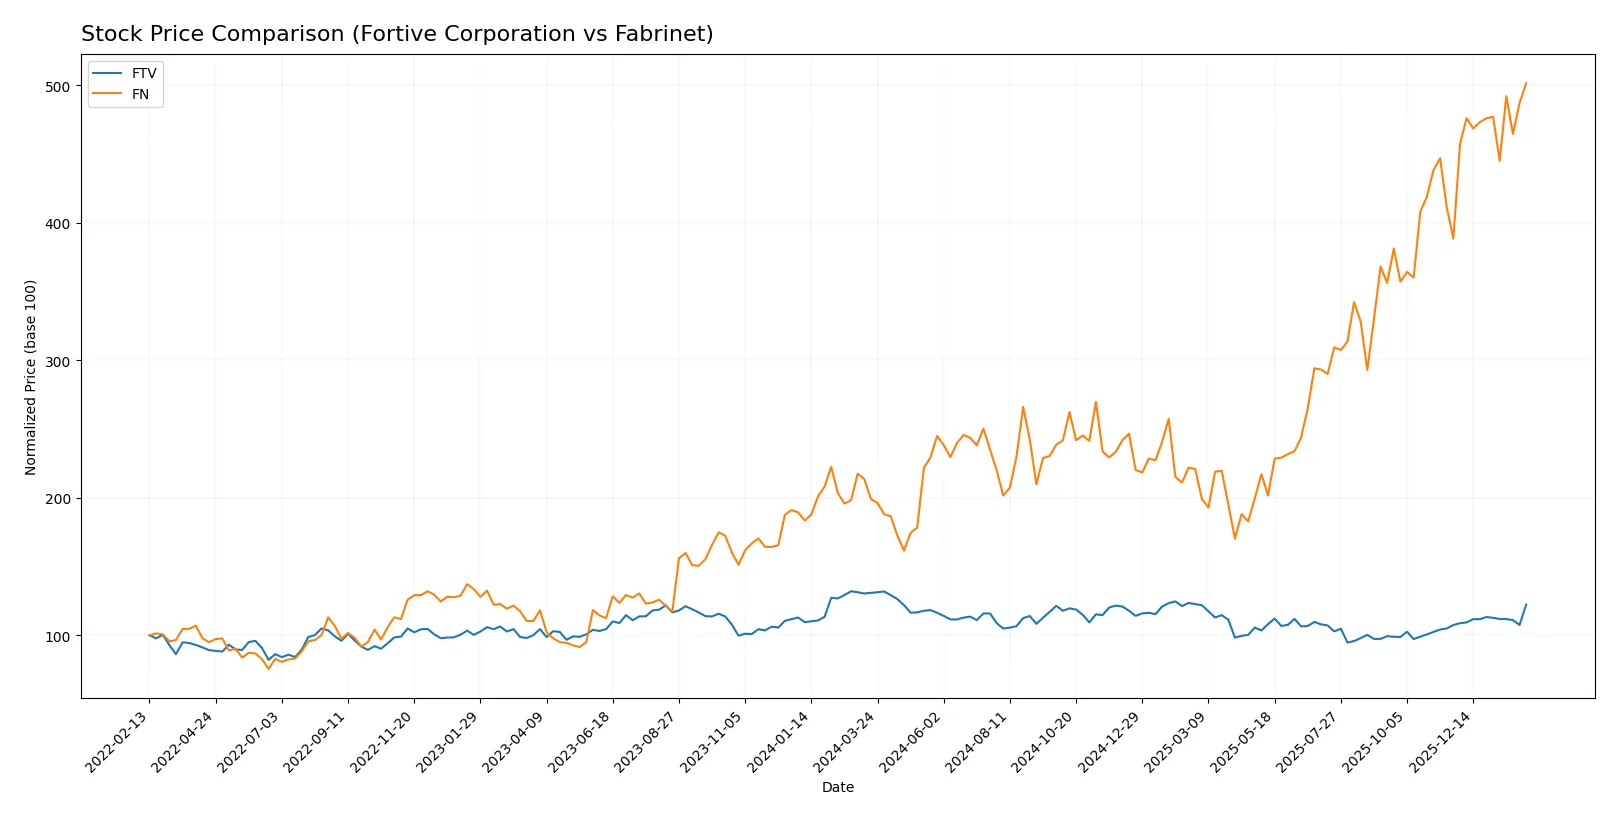
The past year reveals stark contrasts: Fortive Corporation’s shares declined 6.53%, while Fabrinet surged 152%, reflecting divergent trading dynamics and investor sentiment.
Trend Comparison
Fortive Corporation’s stock fell 6.53% over the past 12 months, signaling a bearish trend with accelerating downside momentum. The price ranged between 46.55 and 64.82, with recent months showing a 13.82% rebound.
Fabrinet’s shares soared 151.97% in the same period, confirming a strong bullish trend with accelerating gains. Volatility is high, as indicated by a 92.8 standard deviation and price swings from 162.32 to 503.99.
Comparing both, Fabrinet delivered significantly higher market returns, outperforming Fortive by a wide margin during the 12-month span.
Target Prices
Analysts present a clear consensus on target prices for Fortive Corporation and Fabrinet, reflecting their growth potential.
| Company | Target Low | Target High | Consensus |
|---|---|---|---|
| Fortive Corporation | 51 | 70 | 59.83 |
| Fabrinet | 540 | 600 | 564.5 |
Fortive’s consensus target of 59.83 is slightly below its current price of 60.12, suggesting modest downside risk. Fabrinet’s target consensus of 564.5 indicates substantial upside from its current 503.99 price.

Don’t Let Luck Decide Your Entry Point
Optimize your entry points with our advanced ProRealTime indicators. You’ll get efficient buy signals with precise price targets for maximum performance. Start outperforming now!
How do institutions grade them?
Here is a summary of recent institutional grades for Fortive Corporation and Fabrinet:
Fortive Corporation Grades
The following table shows Fortive Corporation’s recent grades from several major institutions.
| Grading Company | Action | New Grade | Date |
|---|---|---|---|
| Wells Fargo | Maintain | Equal Weight | 2026-02-05 |
| RBC Capital | Maintain | Sector Perform | 2026-02-05 |
| Citigroup | Maintain | Neutral | 2026-02-05 |
| JP Morgan | Downgrade | Underweight | 2026-01-16 |
| Mizuho | Downgrade | Underperform | 2026-01-05 |
Fabrinet Grades
Below is a summary of Fabrinet’s latest grades from recognized financial institutions.
| Grading Company | Action | New Grade | Date |
|---|---|---|---|
| Rosenblatt | Maintain | Buy | 2026-02-03 |
| Barclays | Maintain | Overweight | 2026-02-03 |
| B. Riley Securities | Maintain | Neutral | 2026-02-03 |
| Needham | Maintain | Buy | 2026-02-03 |
| Susquehanna | Maintain | Positive | 2026-01-22 |
Which company has the best grades?
Fabrinet consistently receives buy and overweight ratings, reflecting stronger institutional confidence. Fortive’s grades lean toward neutral and underperform, indicating cautious outlooks. This divergence may influence investor sentiment and risk assessment.
Risks specific to each company
The following categories identify the critical pressure points and systemic threats facing both firms in the 2026 market environment:
1. Market & Competition
Fortive Corporation (FTV)
- Faces intense competition in industrial and healthcare tech sectors, with moderate net margin (11.26%) but ROE lagging peers.
Fabrinet (FN)
- Operates in niche optical manufacturing with high ROE (16.78%) and ROIC (15%), yet faces pricing pressure and rapid tech shifts.
2. Capital Structure & Debt
Fortive Corporation (FTV)
- Maintains moderate leverage (D/E 0.5) with solid interest coverage (7x), but weak liquidity ratios (current ratio 0.71) raise short-term risk concerns.
Fabrinet (FN)
- Virtually no debt (D/E 0.0), excellent liquidity (current ratio 3.0), presenting a very conservative balance sheet and low financial risk.
3. Stock Volatility
Fortive Corporation (FTV)
- Beta near 1.03 signals average market correlation with moderate price range volatility ($45.5–62.8).
Fabrinet (FN)
- Similar beta at 1.03 but wider price range ($148.6–531.2) and recent 13.8% surge indicate higher price swings and speculative risk.
4. Regulatory & Legal
Fortive Corporation (FTV)
- Operates globally in regulated healthcare and industrial fields; regulatory compliance costs may pressure margins.
Fabrinet (FN)
- Faces complex regulations across multiple regions, especially in optical and semiconductor components, risking supply disruptions and penalties.
5. Supply Chain & Operations
Fortive Corporation (FTV)
- Diverse supplier base but some exposure to global logistics challenges impacting delivery and production efficiency.
Fabrinet (FN)
- Highly specialized manufacturing dependent on precision components; supply chain disruptions could cause significant operational delays.
6. ESG & Climate Transition
Fortive Corporation (FTV)
- Moderate ESG initiatives with increasing pressure to reduce carbon footprint in manufacturing and software solutions.
Fabrinet (FN)
- Growing focus on sustainable manufacturing processes, yet energy-intensive optical production may face future carbon regulation risks.
7. Geopolitical Exposure
Fortive Corporation (FTV)
- Primarily US-based with global sales; geopolitical tensions could affect supply chains and international sales.
Fabrinet (FN)
- Based in the Cayman Islands with major operations in Asia-Pacific; vulnerable to trade policy shifts and regional instability.
Which company shows a better risk-adjusted profile?
Fabrinet’s minimal debt and superior liquidity underpin a stronger financial foundation than Fortive. However, Fabrinet’s heightened stock volatility and geopolitical exposure temper its advantage. Fortive’s solid interest coverage and diversified markets provide stability, but weak liquidity ratios increase risk. The clearest risk for Fortive is liquidity strain; for Fabrinet, it is market price swings amid geopolitical uncertainty. Overall, Fabrinet presents a better risk-adjusted profile, supported by its safe-zone Altman Z-score (13.1) and favorable ROIC (15%), despite valuation concerns.
Final Verdict: Which stock to choose?
Fortive Corporation’s superpower lies in its operational resilience and strong cash flow generation despite current headwinds. However, its stretched liquidity ratios signal a point of vigilance. It fits portfolios targeting steady industrial exposure with a tolerance for cyclical volatility.
Fabrinet stands out with a durable competitive moat rooted in operational efficiency and a pristine balance sheet. Its financial safety and growing profitability offer a smoother ride compared to Fortive. Fabrinet suits investors seeking growth with a preference for quality and stability.
If you prioritize operational cash flow strength and industrial sector exposure, Fortive might be the compelling choice despite liquidity concerns. However, if you seek a company with a sustainable moat and better financial stability, Fabrinet offers superior value creation and risk management. Each plays a distinct role depending on your portfolio’s risk appetite.
Disclaimer: Investment carries a risk of loss of initial capital. The past performance is not a reliable indicator of future results. Be sure to understand risks before making an investment decision.
Go Further
I encourage you to read the complete analyses of Fortive Corporation and Fabrinet to enhance your investment decisions: