Home > Comparison > Technology > ZS vs FFIV
The strategic rivalry between Zscaler, Inc. and F5, Inc. shapes critical dynamics in the technology sector’s software infrastructure industry. Zscaler operates as a cloud-native security pioneer, focusing on scalable SaaS solutions, while F5 combines hardware and software to deliver multi-cloud application security and performance. This head-to-head contrasts innovation-driven growth with established integrated delivery models. This analysis aims to identify which company presents a superior risk-adjusted opportunity for a diversified portfolio in 2026.
Table of contents
Companies Overview
Zscaler and F5 remain pivotal players in the software infrastructure market, shaping cloud security and application delivery.
Zscaler, Inc.: Cloud Security Innovator
Zscaler leads as a cloud security provider, generating revenue through its Internet Access and Private Access solutions. The company’s strategic focus in 2026 sharpens on enhancing digital experience and workload segmentation to prevent lateral threats inside public clouds and data centers. Its platform’s modular design underpins a robust defense against data breaches.
F5, Inc.: Multi-Cloud Application Specialist
F5 dominates multi-cloud application security and delivery, monetizing through appliances, software modules, and professional services. In 2026, it emphasizes expanding integration with major public cloud platforms like AWS, Azure, and Google Cloud. This strategy supports enterprises securing and optimizing applications across hybrid and public cloud environments.
Strategic Collision: Similarities & Divergences
Both companies prioritize securing cloud-based assets but diverge in approach: Zscaler offers a cloud-native zero-trust model, while F5 blends hardware-software synergy for multi-cloud application delivery. Their primary battleground is enterprise cloud security, where Zscaler targets SaaS and internal apps, and F5 focuses on application performance and protection. Investors face distinct profiles: Zscaler’s pure SaaS growth contrasts with F5’s hybrid infrastructure legacy.
Income Statement Comparison
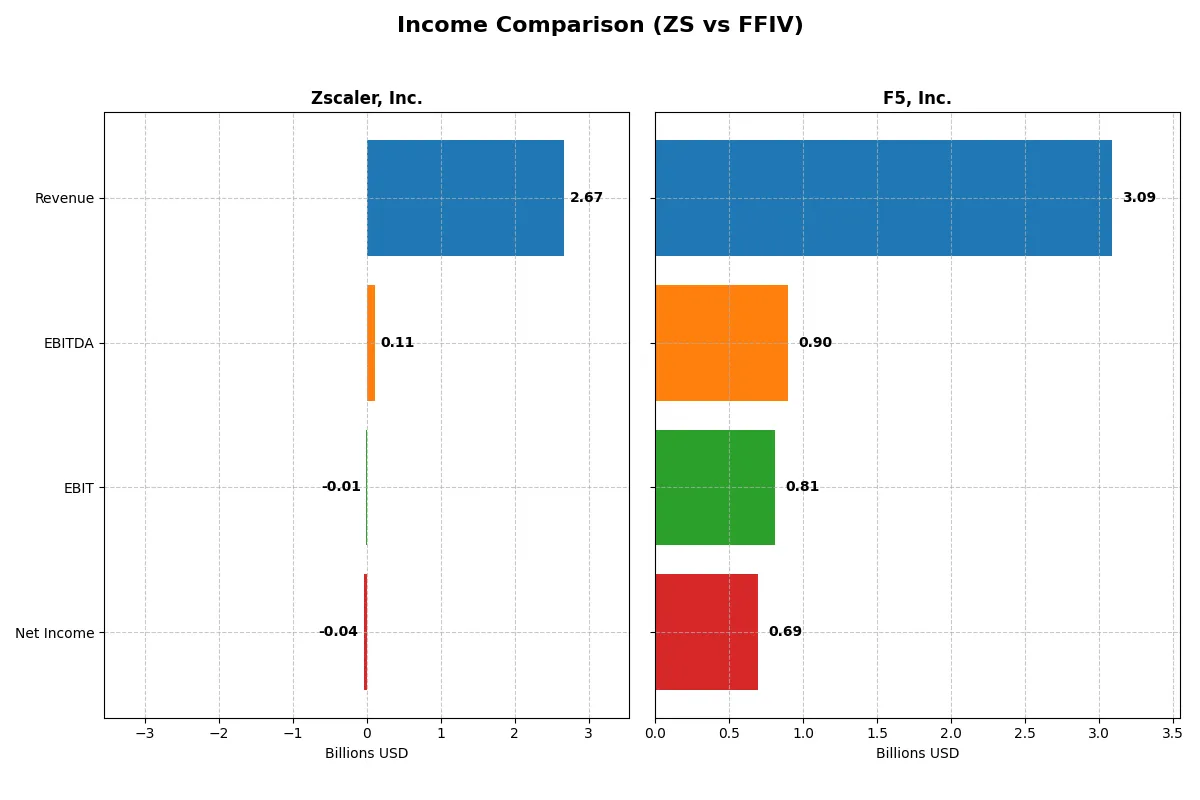
This data dissects the core profitability and scalability of both corporate engines to reveal who dominates the bottom line:
| Metric | Zscaler, Inc. (ZS) | F5, Inc. (FFIV) |
|---|---|---|
| Revenue | 2.67B | 3.09B |
| Cost of Revenue | 618M | 564M |
| Operating Expenses | 2.18B | 1.76B |
| Gross Profit | 2.05B | 2.52B |
| EBITDA | 112M | 901M |
| EBIT | -8.8M | 808M |
| Interest Expense | 9.5M | 0 |
| Net Income | -41M | 692M |
| EPS | -0.27 | 11.95 |
| Fiscal Year | 2025 | 2025 |
Income Statement Analysis: The Bottom-Line Duel
This income statement comparison reveals which company operates more efficiently and translates revenue into profit effectively.
Zscaler, Inc. Analysis
Zscaler’s revenue surged from 673M in 2021 to 2.67B in 2025, showing strong growth momentum. Gross margins remain healthy at 76.9%, but the net margin stayed negative at -1.55%, reflecting ongoing investment costs. The FY 2025 showed improving EBIT and EPS, signaling progress toward profitability despite a small net loss.
F5, Inc. Analysis
F5’s revenue grew steadily from 2.6B in 2021 to 3.1B in 2025, with an 81.7% gross margin that outpaces peers. Its net margin stands robust at 22.4%, and EBIT margin at 26.2%. The company delivered strong earnings growth with a 692M net income in 2025, demonstrating operational efficiency and consistent profitability.
Profitability Strength vs. Growth Trajectory
F5 dominates in profitability with solid net and EBIT margins and consistent earnings growth. Zscaler impresses with rapid revenue expansion but struggles to convert growth into profits yet. For investors, F5’s stable, high-margin profile offers a clearer path to sustainable returns compared to Zscaler’s growth-heavy, loss-making model.
Financial Ratios Comparison
These vital ratios act as a diagnostic tool to expose the underlying fiscal health, valuation premiums, and capital efficiency of each company:
| Ratios | Zscaler, Inc. (ZS) | F5, Inc. (FFIV) |
|---|---|---|
| ROE | -2.31% | 19.28% |
| ROIC | -3.18% | 13.99% |
| P/E | -1063 | 26.91 |
| P/B | 24.51 | 5.19 |
| Current Ratio | 2.01 | 1.56 |
| Quick Ratio | 2.01 | 1.51 |
| D/E (Debt-to-Equity) | 1.00 | 0.06 |
| Debt-to-Assets | 28.0% | 3.7% |
| Interest Coverage | -13.49 | 0 (not reported) |
| Asset Turnover | 0.42 | 0.49 |
| Fixed Asset Turnover | 4.22 | 9.02 |
| Payout Ratio | 0 | 0 |
| Dividend Yield | 0% | 0% |
| Fiscal Year | 2025 | 2025 |
Efficiency & Valuation Duel: The Vital Signs
Ratios act as a company’s DNA, revealing hidden risks and operational excellence that numbers alone cannot fully capture.
Zscaler, Inc.
Zscaler shows unfavorable profitability with negative ROE (-2.31%) and margins, despite a very attractive P/E ratio driven by negative earnings. The stock appears stretched with a high P/B of 24.5, signaling expensive equity. No dividends are paid; the firm reinvests heavily in R&D, prioritizing growth over immediate shareholder returns.
F5, Inc.
F5 delivers robust profitability with a 19.3% ROE and 22.4% net margin, reflecting operational efficiency. Its valuation is moderate with a P/E of 26.9, somewhat stretched versus sector averages. The company does not pay dividends but generates strong free cash flow, likely balancing growth investments and shareholder value preservation.
Growth Focus vs. Profitability Strength
F5 offers a more favorable ratio profile with consistent profitability and manageable valuation, balancing risk and reward better than Zscaler. Investors favoring stable returns and operational safety may prefer F5’s profile, while growth seekers might tolerate Zscaler’s stretched metrics and reinvestment strategy.
Which one offers the Superior Shareholder Reward?
I observe that Zscaler (ZS) pays no dividends and has no buyback program, reinvesting heavily in growth. Its negative net margins and high valuation (P/FCF ~61) signal risk. F5 (FFIV) also pays no dividends but returns cash via robust buybacks, supported by 22% net margins and strong free cash flow (FCF/share $15.7). F5’s distribution model, combining buybacks with sustainable profitability, offers superior total shareholder reward in 2026.
Comparative Score Analysis: The Strategic Profile
The radar chart reveals the fundamental DNA and trade-offs of Zscaler, Inc. and F5, Inc., highlighting their financial strengths and valuation approaches:
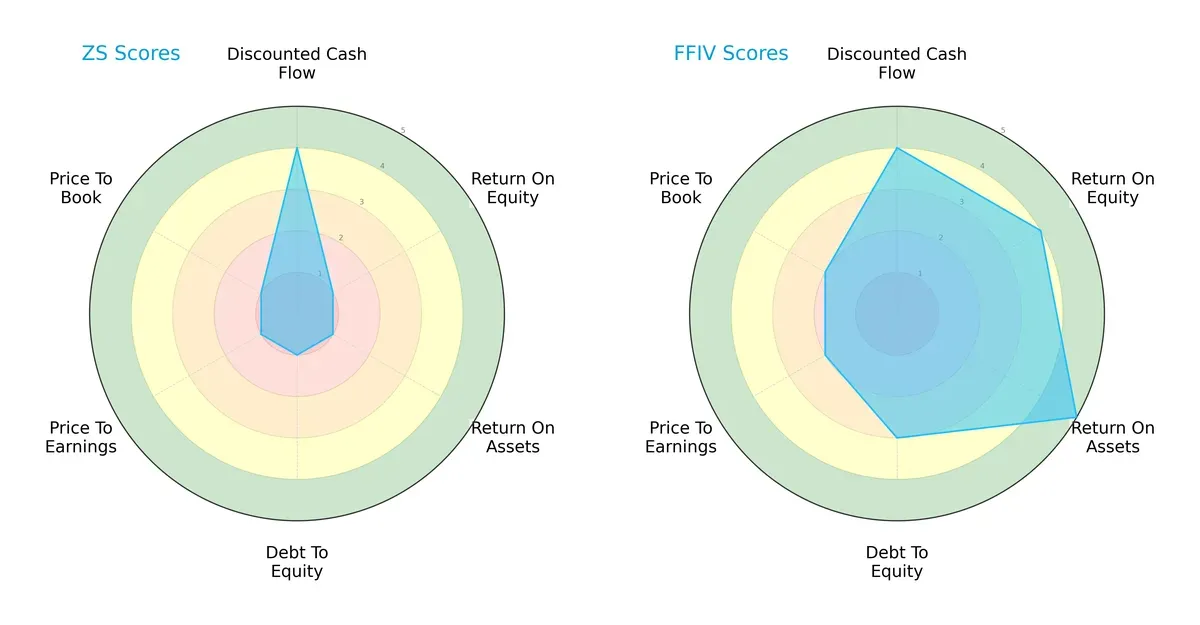
F5, Inc. exhibits a far more balanced profile with strong ROE (4) and ROA (5) scores, indicating efficient asset and equity utilization. Zscaler, Inc. relies mainly on a favorable DCF score (4) but suffers from very weak profitability and leverage metrics (all scores at 1). F5’s moderate debt-to-equity score (3) contrasts sharply with Zscaler’s weak score (1), signaling better financial stability for F5.
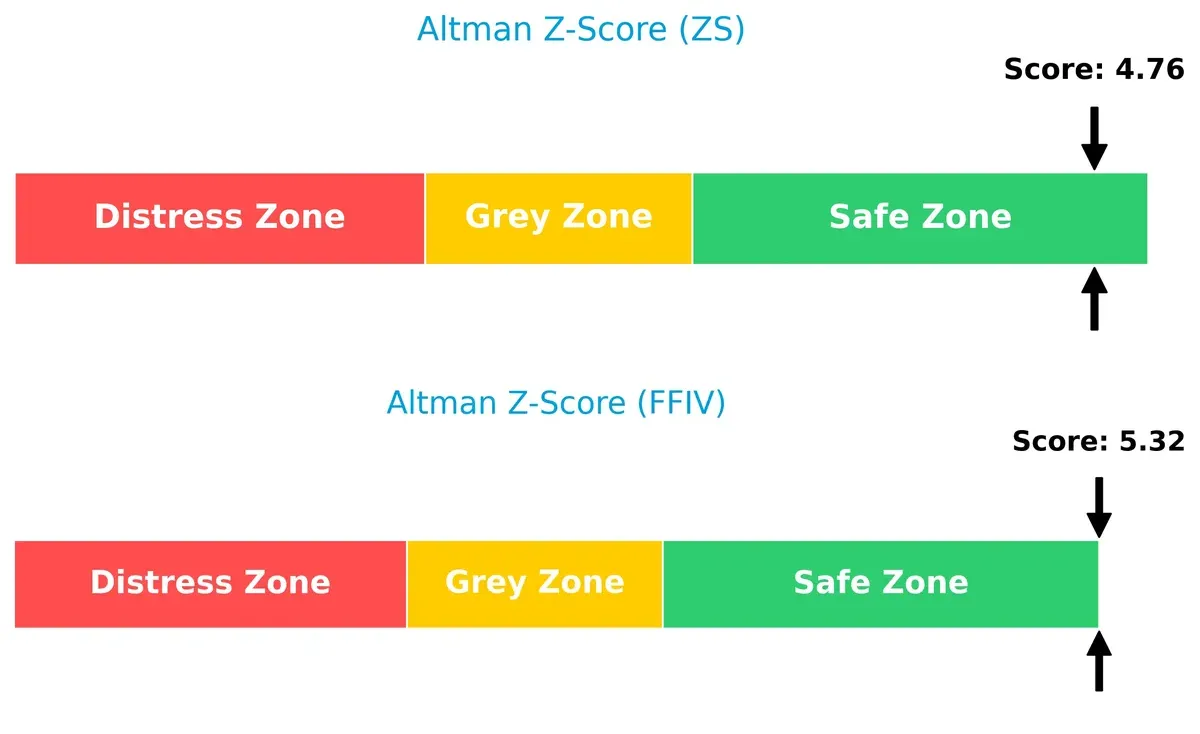
Bankruptcy Risk: Solvency Showdown
F5, Inc. (5.3) holds a higher Altman Z-Score than Zscaler, Inc. (4.8), placing both safely above distress thresholds but confirming F5’s stronger long-term solvency:
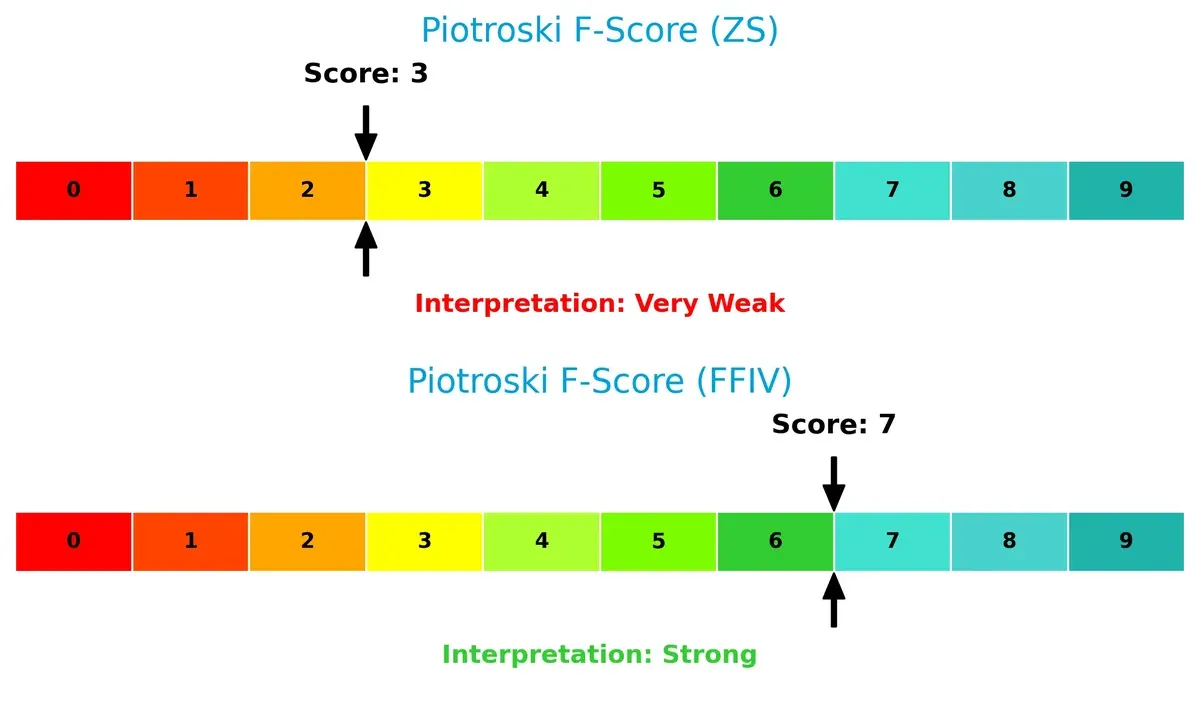
Financial Health: Quality of Operations
F5, Inc. scores a robust 7 on the Piotroski F-Score scale, signaling strong operational quality and internal financial health. Zscaler, Inc.’s score of 3 raises red flags, indicating weak fundamentals and potential internal risks:
How are the two companies positioned?
This section dissects the operational DNA of Zscaler and F5 by comparing their revenue distribution and internal dynamics—strengths and weaknesses. The goal is to confront their economic moats to identify which model offers the most resilient, sustainable competitive advantage today.
Revenue Segmentation: The Strategic Mix
The following visual comparison dissects how Zscaler, Inc. and F5, Inc. diversify their income streams and where their primary sector bets lie:
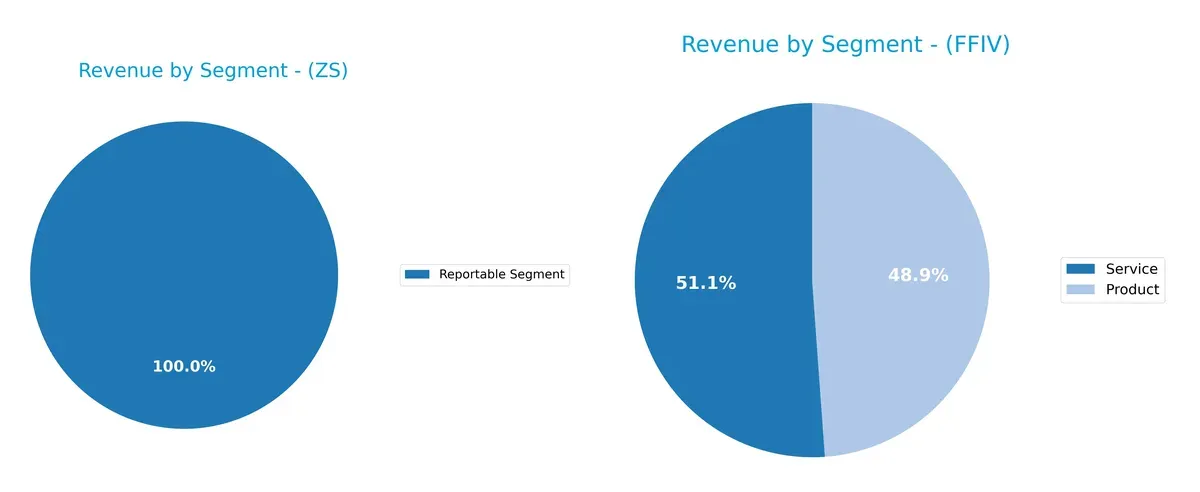
Zscaler, Inc. relies exclusively on a single reportable segment, generating $2.67B in revenue. In contrast, F5, Inc. balances its $3.1B revenue between Product ($1.51B) and Service ($1.58B) segments. F5’s diversified mix lowers concentration risk and supports ecosystem lock-in through services. Zscaler’s focus anchors its growth but increases exposure to market shifts in that singular area.
Strengths and Weaknesses Comparison
This table compares the Strengths and Weaknesses of Zscaler, Inc. and F5, Inc.:
Zscaler Strengths
- Strong current and quick ratios at 2.01 each
- Favorable debt-to-assets at 28%
- Fixed asset turnover of 4.22 indicates asset efficiency
- Large single reportable segment revenue of 2.67B USD
F5 Strengths
- High net margin at 22.42%
- Strong ROE at 19.28% and ROIC at 13.99%
- Low debt-to-equity at 0.06 and favorable interest coverage
- Balanced revenue from products (1.51B USD) and services (1.58B USD)
- Extensive global presence with 1.82B USD Americas sales
Zscaler Weaknesses
- Negative profitability ratios: net margin -1.55%, ROE -2.31%, ROIC -3.18%
- Unfavorable interest coverage (-0.92) signals risk
- High price-to-book of 24.51
- Asset turnover low at 0.42
- No dividend yield
F5 Weaknesses
- Unfavorable P/E of 26.91 and price-to-book at 5.19
- Asset turnover low at 0.49
- No dividend yield despite strong profitability
Zscaler shows liquidity strength but struggles with profitability and valuation metrics. F5 combines strong profitability and diversified revenue but faces valuation premiums and modest asset turnover. These contrasts highlight differing strategic positions and financial health.
The Moat Duel: Analyzing Competitive Defensibility
A structural moat is the only safeguard protecting long-term profits from relentless competitive erosion. Let’s dissect the moats of two tech infrastructure leaders:
Zscaler, Inc.: Cloud Security with a Network Effect Moat
Zscaler’s primary advantage stems from its network effects in cloud security, reflected in rapid revenue growth and improving profitability. Yet, a negative ROIC vs. WACC signals value destruction, raising questions about long-term moat durability in 2026.
F5, Inc.: Application Delivery with Cost Advantage and Intangible Assets
F5 leverages cost advantages and strong brand-intangible assets, delivering high ROIC well above WACC and stable double-digit margins. Its growing profitability and expanding multi-cloud solutions reinforce a robust moat heading into 2026.
Verdict: Network Effects vs. Cost Leadership – Which Moat Runs Deeper?
F5’s combination of cost advantage and intangible assets creates a wider, more durable moat than Zscaler’s nascent network effects. F5 is better positioned to defend market share amid intensifying competition.
Which stock offers better returns?
Over the past 12 months, Zscaler, Inc. and F5, Inc. displayed distinct price movements and trading dynamics, reflecting divergent investor sentiment and market momentum trends.
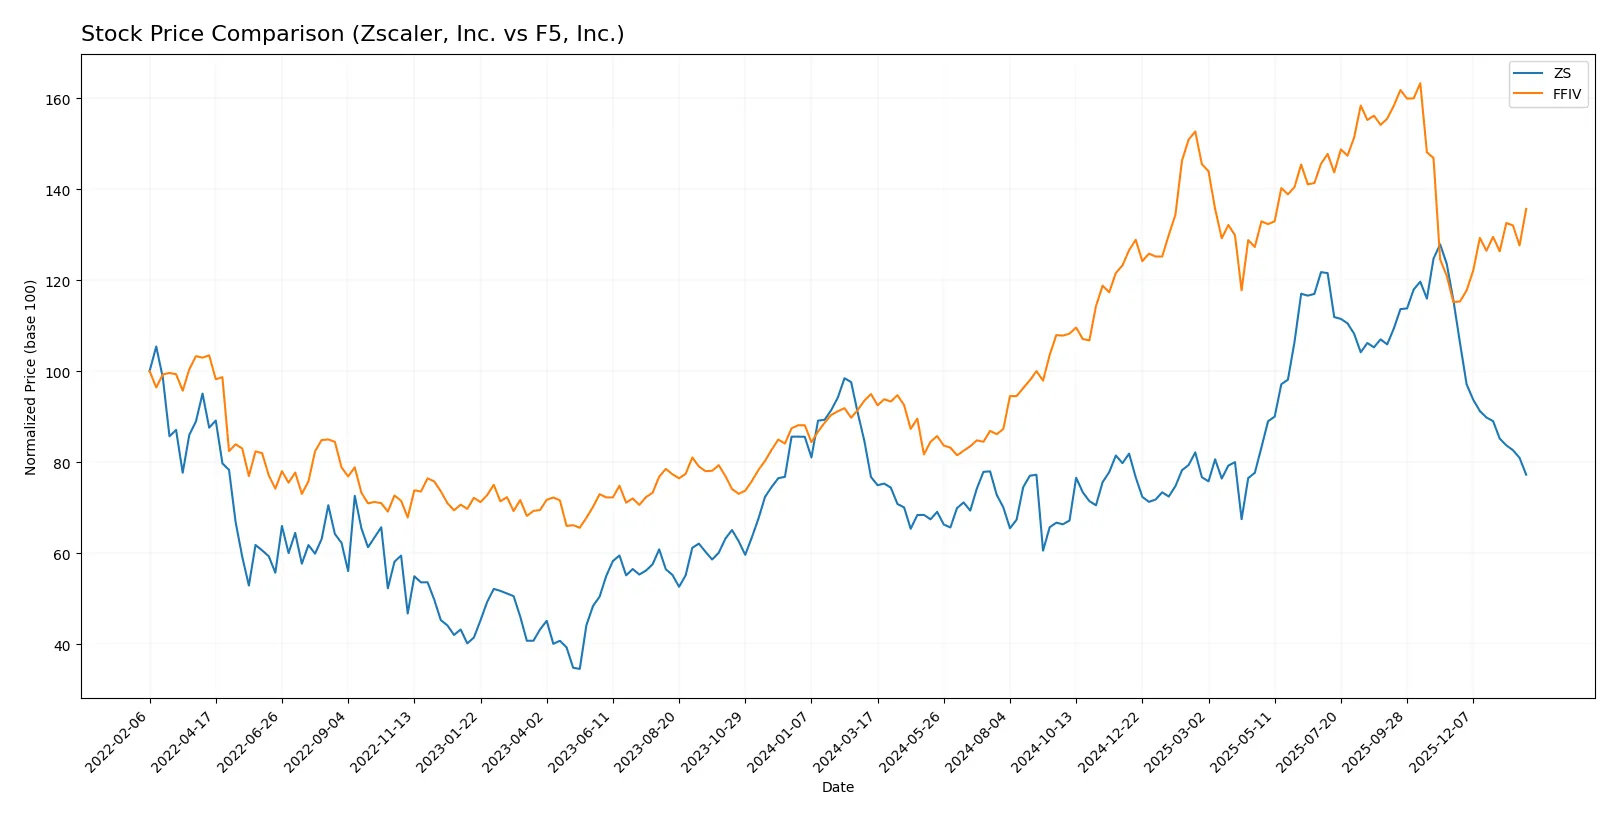
Trend Comparison
Zscaler, Inc. shows a mild bullish trend with a 0.66% price increase over the last year, but recent months reveal a sharp 33.21% decline, indicating deceleration and growing seller dominance.
F5, Inc. exhibits a strong bullish trend with a 42.85% price gain over 12 months, accelerating upward momentum, supported by increasing volume and recent 17.78% growth.
F5, Inc. outperformed Zscaler, Inc. with significantly higher overall returns and sustained positive momentum during the recent period.
Target Prices
Analysts present a bullish consensus for both Zscaler, Inc. and F5, Inc., signaling potential upside from current prices.
| Company | Target Low | Target High | Consensus |
|---|---|---|---|
| Zscaler, Inc. | 260 | 360 | 311.41 |
| F5, Inc. | 295 | 352 | 330.67 |
Zscaler’s consensus target at 311.41 exceeds its current price of 200.01 by over 55%, indicating strong growth expectations. F5’s target consensus at 330.67 is roughly 20% above its current 275.61 price, reflecting solid analyst confidence.

Don’t Let Luck Decide Your Entry Point
Optimize your entry points with our advanced ProRealTime indicators. You’ll get efficient buy signals with precise price targets for maximum performance. Start outperforming now!
How do institutions grade them?
Zscaler, Inc. Grades
The following table summarizes recent institutional grades for Zscaler, Inc.:
| Grading Company | Action | New Grade | Date |
|---|---|---|---|
| Citigroup | Maintain | Buy | 2026-01-13 |
| Keybanc | Maintain | Overweight | 2026-01-12 |
| RBC Capital | Maintain | Outperform | 2026-01-05 |
| Piper Sandler | Maintain | Neutral | 2026-01-05 |
| Mizuho | Upgrade | Outperform | 2025-12-16 |
| Bernstein | Downgrade | Market Perform | 2025-12-01 |
| Citigroup | Maintain | Buy | 2025-12-01 |
| Mizuho | Maintain | Neutral | 2025-11-26 |
| Bernstein | Maintain | Outperform | 2025-11-26 |
| JP Morgan | Maintain | Overweight | 2025-11-26 |
F5, Inc. Grades
Below is a summary of the latest institutional grades for F5, Inc.:
| Grading Company | Action | New Grade | Date |
|---|---|---|---|
| Needham | Maintain | Hold | 2026-01-28 |
| Piper Sandler | Maintain | Overweight | 2026-01-28 |
| Goldman Sachs | Maintain | Neutral | 2026-01-28 |
| Barclays | Maintain | Equal Weight | 2026-01-28 |
| RBC Capital | Maintain | Outperform | 2026-01-28 |
| JP Morgan | Upgrade | Overweight | 2026-01-15 |
| Piper Sandler | Upgrade | Overweight | 2026-01-05 |
| RBC Capital | Upgrade | Outperform | 2026-01-05 |
| Morgan Stanley | Maintain | Equal Weight | 2025-12-17 |
| Morgan Stanley | Maintain | Equal Weight | 2025-10-28 |
Which company has the best grades?
Zscaler, Inc. consistently receives strong buy and outperform ratings from multiple firms, indicating higher institutional confidence. F5, Inc. shows a mix of hold, equal weight, and overweight grades, suggesting more cautious optimism. Investors may interpret Zscaler’s stronger grades as reflecting better growth or risk-adjusted potential.
Risks specific to each company
In 2026, these categories highlight the critical pressure points and systemic threats facing Zscaler, Inc. and F5, Inc. in the current market environment:
1. Market & Competition
Zscaler, Inc.
- Faces intense cloud security competition, with pressure on margins and innovation pace.
F5, Inc.
- Competes in multi-cloud security with strong legacy presence but must innovate against agile rivals.
2. Capital Structure & Debt
Zscaler, Inc.
- Moderate leverage (D/E = 1.0) with weak interest coverage signals refinancing risks.
F5, Inc.
- Low leverage (D/E = 0.06) and robust interest coverage reduce financial distress risk.
3. Stock Volatility
Zscaler, Inc.
- Beta near 1.0 implies market-level volatility; wide price range heightens uncertainty.
F5, Inc.
- Slightly less volatile (beta 0.975) with a more stable trading range suggests lower risk.
4. Regulatory & Legal
Zscaler, Inc.
- Subject to evolving cybersecurity regulations, increasing compliance costs.
F5, Inc.
- Faces regulatory scrutiny on data privacy and cloud security; compliance demands rising steadily.
5. Supply Chain & Operations
Zscaler, Inc.
- Cloud-native model limits physical supply chain risks but depends on cloud providers’ stability.
F5, Inc.
- Hardware reliance exposes F5 to component shortages and logistic disruptions.
6. ESG & Climate Transition
Zscaler, Inc.
- Growing pressure to demonstrate sustainable cloud operations; ESG disclosures still maturing.
F5, Inc.
- Faces increasing demands to reduce hardware environmental footprint and enhance governance transparency.
7. Geopolitical Exposure
Zscaler, Inc.
- US-based but global client base exposes it to cross-border data regulation risks.
F5, Inc.
- Similar US base with extensive global sales, vulnerable to trade tensions and export controls.
Which company shows a better risk-adjusted profile?
Zscaler’s most impactful risk is its weak capital structure and negative profitability, which strain financial resilience. F5’s key risk lies in supply chain fragility due to hardware dependencies. Overall, F5 presents a superior risk-adjusted profile, bolstered by strong profitability, low leverage, and stable cash flows. Zscaler’s negative returns and interest coverage raise caution, despite its cloud-native advantages. Recent data confirming F5’s strong Altman Z-Score (5.3) and Piotroski score (7) versus Zscaler’s weaker Piotroski (3) justifies this view.
Final Verdict: Which stock to choose?
Zscaler, Inc. impresses with its rapid revenue growth and expanding profitability, signaling an emerging cash flow engine. However, its current inability to deliver positive ROIC relative to WACC calls for caution. It might suit investors chasing aggressive growth in a transformative tech niche, willing to tolerate elevated risk.
F5, Inc. stands out with a durable moat evidenced by ROIC comfortably exceeding WACC and a consistent track record of value creation. Its strong profitability and healthier balance sheet offer better stability compared to Zscaler. This makes it appealing for investors targeting GARP—growth at a reasonable price—with more measured risk exposure.
If you prioritize high-growth potential and can absorb volatility, Zscaler might be the compelling choice due to its accelerating top-line and improving income metrics. However, if you seek a more stable investment with a proven competitive advantage and solid returns, F5 offers better stability and a stronger economic moat, commanding a premium valuation. Each fits distinct investor profiles with different risk appetites.
Disclaimer: Investment carries a risk of loss of initial capital. The past performance is not a reliable indicator of future results. Be sure to understand risks before making an investment decision.
Go Further
I encourage you to read the complete analyses of Zscaler, Inc. and F5, Inc. to enhance your investment decisions: