Home > Comparison > Technology > FFIV vs WIX
The strategic rivalry between F5, Inc. and Wix.com Ltd. shapes the evolving landscape of the technology sector. F5, Inc. operates as a capital-intensive software infrastructure provider focusing on multi-cloud application security and delivery. In contrast, Wix.com Ltd. delivers a high-growth, cloud-based platform enabling easy website creation and digital business solutions. This analysis aims to discern which company’s business model offers superior risk-adjusted returns for a diversified portfolio in today’s dynamic tech environment.
Table of contents
Companies Overview
Two tech players reshape software infrastructure with distinct global footprints and innovation models.
F5, Inc.: Multi-Cloud Security & Delivery Specialist
F5, Inc. dominates the multi-cloud application security and delivery market. It earns revenue from advanced hardware and software solutions like BIG-IP appliances and NGINX products. In 2026, F5’s strategic focus centers on enhancing cloud-native security and expanding partnerships with AWS, Azure, and Google Cloud to secure and optimize enterprise applications worldwide.
Wix.com Ltd.: Cloud-Based Web Development Platform
Wix.com Ltd. leads in cloud-based website creation and business automation tools. Its revenue comes from premium subscriptions and a suite of products, including drag-and-drop editors and payment platforms. In 2026, Wix emphasizes broadening its app ecosystem and AI-driven tools to empower millions of users in DIY website creation and digital business growth.
Strategic Collision: Similarities & Divergences
F5 and Wix both innovate in software infrastructure but pursue divergent philosophies. F5 focuses on a secure, hybrid cloud ecosystem for enterprises, while Wix champions an open, user-friendly platform for SMBs and individuals. Their main battleground is digital infrastructure—F5 on security and performance, Wix on accessibility and automation. Investors will find F5’s profile more enterprise-driven, whereas Wix appeals with scalable, consumer-centric growth.
Income Statement Comparison
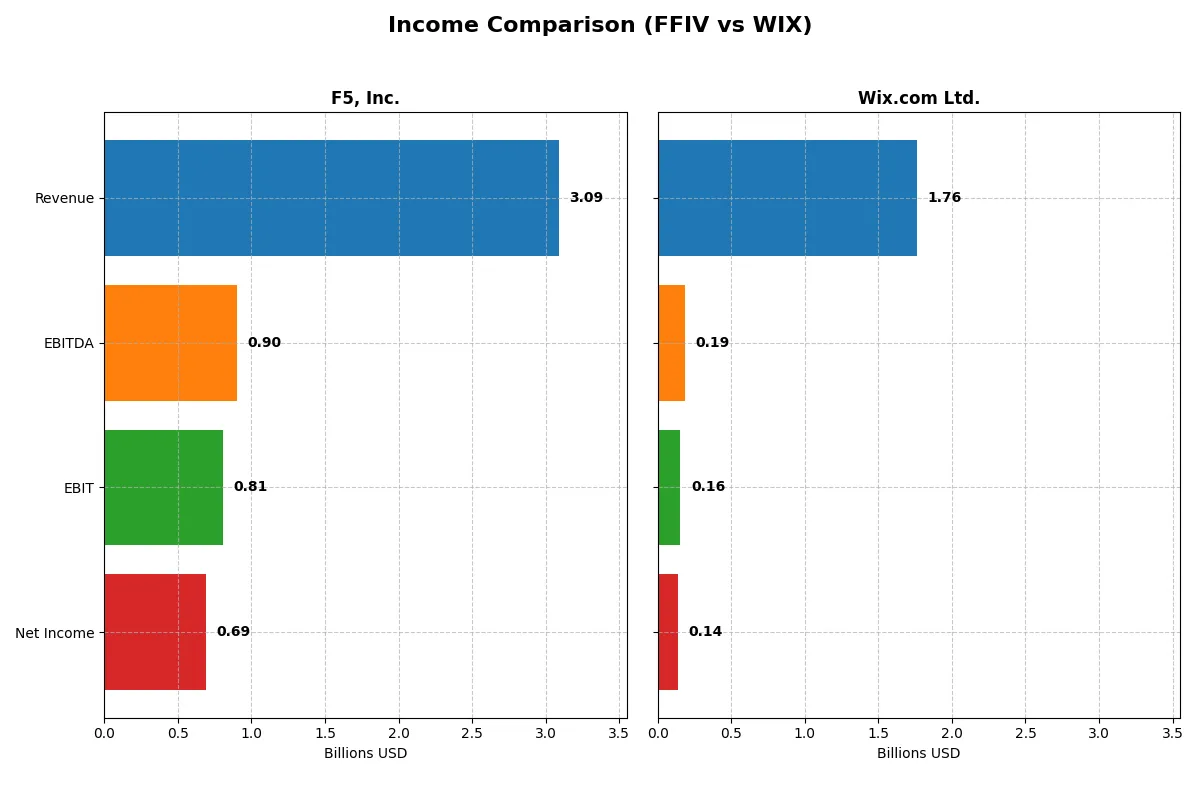
This comparison dissects the core profitability and scalability of both corporate engines to reveal who dominates the bottom line:
| Metric | F5, Inc. (FFIV) | Wix.com Ltd. (WIX) |
|---|---|---|
| Revenue | 3.09B | 1.76B |
| Cost of Revenue | 564M | 565M |
| Operating Expenses | 1.76B | 1.10B |
| Gross Profit | 2.52B | 1.20B |
| EBITDA | 901M | 186M |
| EBIT | 808M | 155M |
| Interest Expense | 0 | 4M |
| Net Income | 692M | 138M |
| EPS | 11.95 | 2.49 |
| Fiscal Year | 2025 | 2024 |
Income Statement Analysis: The Bottom-Line Duel
This income statement comparison exposes which company runs a more efficient and profitable corporate engine over recent years.
F5, Inc. Analysis
F5, Inc. shows steady revenue growth from $2.6B in 2021 to $3.1B in 2025, with net income surging from $331M to $692M. Its gross margin holds strongly above 81%, and net margin climbs to 22.4%, reflecting robust profitability. The 2025 results highlight improved operating efficiency and expanding bottom-line momentum.
Wix.com Ltd. Analysis
Wix.com’s revenue rose sharply from $984M in 2020 to $1.76B in 2024, with net income turning positive at $138M after years of losses. Gross margin remains healthy near 68%, while net margin improved to 7.9%. The latest year shows significant operating leverage gains and rapid margin expansion, signaling a successful turnaround.
Margin Strength vs. Growth Trajectory
F5, Inc. dominates with superior margins and consistent profit growth, doubling net income in five years. Wix.com impresses with faster revenue and income growth from a lower base, recovering from prior losses. Investors favor F5’s stable, high-margin profile for dependable returns, while Wix offers a higher-growth but riskier investment case.
Financial Ratios Comparison
These vital ratios act as a diagnostic tool to expose the underlying fiscal health, valuation premiums, and capital efficiency of the companies compared below:
| Ratios | F5, Inc. (FFIV) | Wix.com Ltd. (WIX) |
|---|---|---|
| ROE | 19.3% (2025) | -175.6% (2024) |
| ROIC | 14.0% (2025) | 9.1% (2024) |
| P/E | 26.9 (2025) | 86.2 (2024) |
| P/B | 5.19 (2025) | -151.4 (2024) |
| Current Ratio | 1.56 (2025) | 0.84 (2024) |
| Quick Ratio | 1.51 (2025) | 0.84 (2024) |
| D/E | 0.064 (2025) | -12.3 (2024) |
| Debt-to-Assets | 3.65% (2025) | 50.7% (2024) |
| Interest Coverage | 0 (2025) | 25.9 (2024) |
| Asset Turnover | 0.49 (2025) | 0.92 (2024) |
| Fixed Asset Turnover | 9.02 (2025) | 3.33 (2024) |
| Payout Ratio | 0% (2025) | 0% (2024) |
| Dividend Yield | 0% (2025) | 0% (2024) |
| Fiscal Year | 2025 | 2024 |
Efficiency & Valuation Duel: The Vital Signs
Ratios serve as a company’s DNA, unveiling hidden risks and operational strengths that raw numbers often mask.
F5, Inc.
F5 posts a strong 19.3% ROE and a robust 22.4% net margin, signaling excellent profitability. The stock trades at a stretched 26.9 P/E, reflecting high investor expectations. Despite no dividend yield, F5 reinvests heavily in R&D (17.5% of revenue), fueling growth and innovation.
Wix.com Ltd.
Wix struggles with a deeply negative ROE of -175.6% and a modest 7.9% net margin, indicating operational challenges. Valuation is expensive, with an 86.2 P/E ratio, which heightens risk. The company pays no dividend, investing aggressively in R&D (28.1% of revenue) to drive future expansion.
Premium Valuation vs. Operational Safety
F5 balances profitability and valuation concerns better than Wix, which faces steep losses and stretched multiples. Investors seeking operational safety and solid returns may prefer F5. Conversely, those targeting high-growth profiles with tolerance for risk might consider Wix’s aggressive reinvestment strategy.
Which one offers the Superior Shareholder Reward?
I observe that both F5, Inc. (FFIV) and Wix.com Ltd. (WIX) do not pay dividends, focusing instead on reinvestment and buybacks. FFIV’s free cash flow per share stands at 15.7, nearly double WIX’s 8.6, supporting its robust buyback program. FFIV maintains a 0% payout ratio and zero dividend yield but generates strong operating cash flow coverage (4.1x) and capital expenditure coverage (22x), ensuring sustainable buybacks. Conversely, WIX’s high leverage and weaker operating cash flow coverage (0.5x) raise sustainability concerns despite its growth reinvestment. I conclude FFIV offers a superior total shareholder return profile in 2026, driven by disciplined capital allocation and sustainable buybacks.
Comparative Score Analysis: The Strategic Profile
The radar chart reveals the fundamental DNA and trade-offs of F5, Inc. and Wix.com Ltd., highlighting their financial strengths and vulnerabilities:
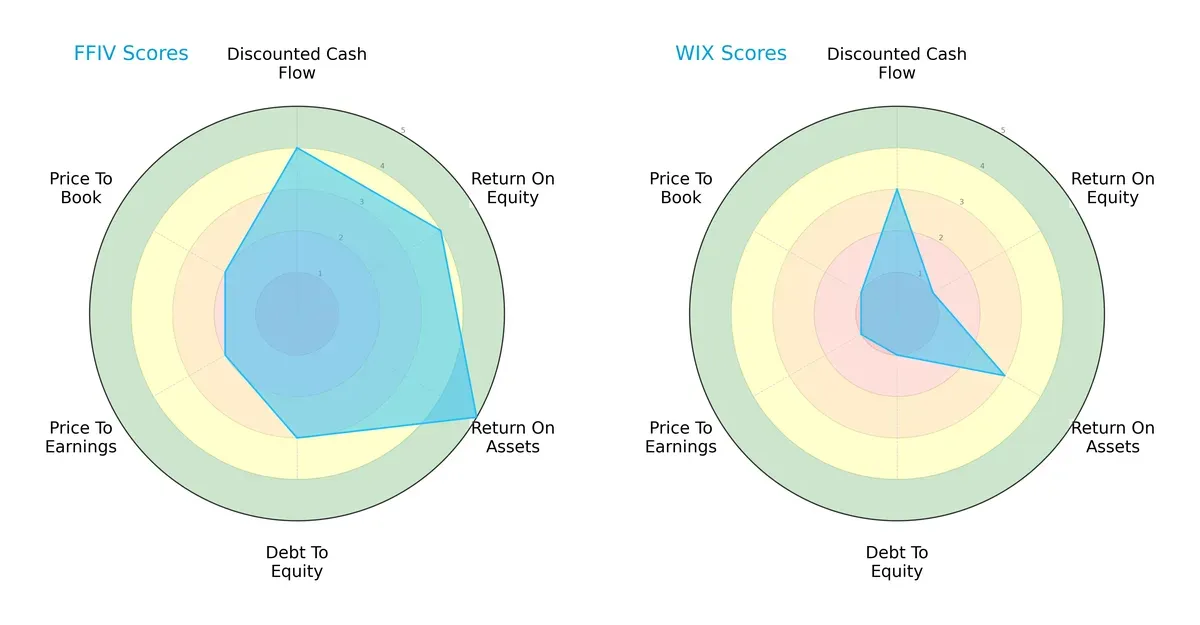
F5, Inc. presents a balanced profile with strong ROA (5) and ROE (4), along with a solid DCF score (4). However, its valuation scores (PE and PB at 2) suggest moderate market pricing. Wix.com Ltd. relies heavily on its discount cash flow (3) but shows weak profitability (ROE 1) and financial stability (debt-to-equity 1). F5’s diversified strengths contrast with Wix’s dependence on a single edge, making F5 a more resilient choice.
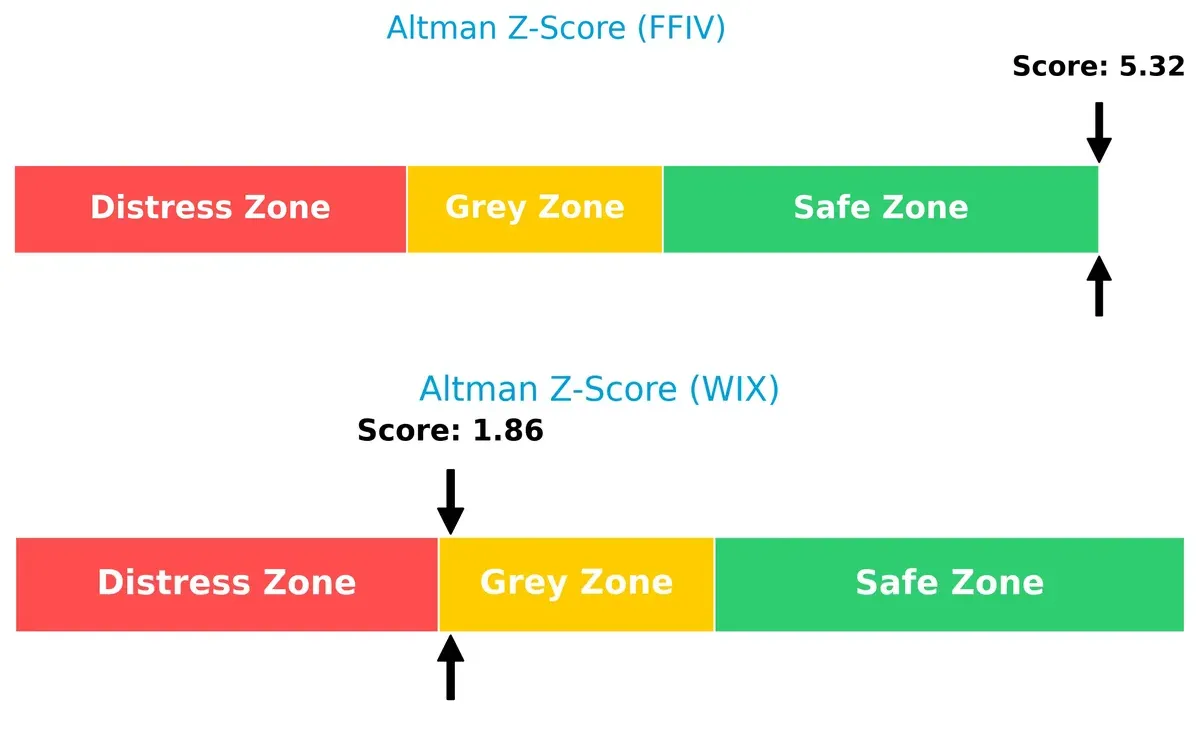
Bankruptcy Risk: Solvency Showdown
F5’s Altman Z-Score of 5.32 places it firmly in the safe zone, signaling robust long-term survival potential. Wix’s 1.86 score sits in the grey zone, implying moderate financial distress risk in this cycle:
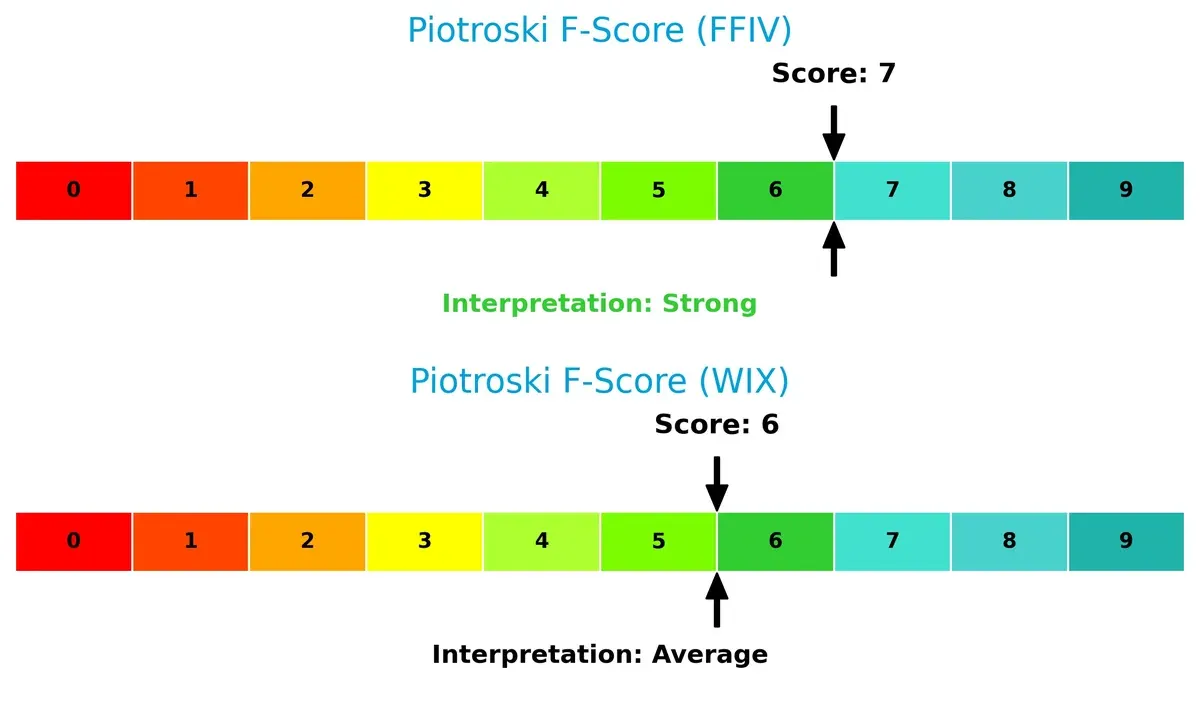
Financial Health: Quality of Operations
F5 leads with a Piotroski F-Score of 7, indicating strong operational quality and financial health. Wix, scoring 6, is average but shows some red flags compared to F5’s more solid internal metrics:
How are the two companies positioned?
This section dissects the operational DNA of F5 and Wix by comparing revenue distribution and internal dynamics. The goal is to confront their economic moats to reveal which model offers the most resilient competitive advantage today.
Revenue Segmentation: The Strategic Mix
The following visual comparison dissects how F5, Inc. and Wix.com Ltd. diversify their income streams and where their primary sector bets lie:
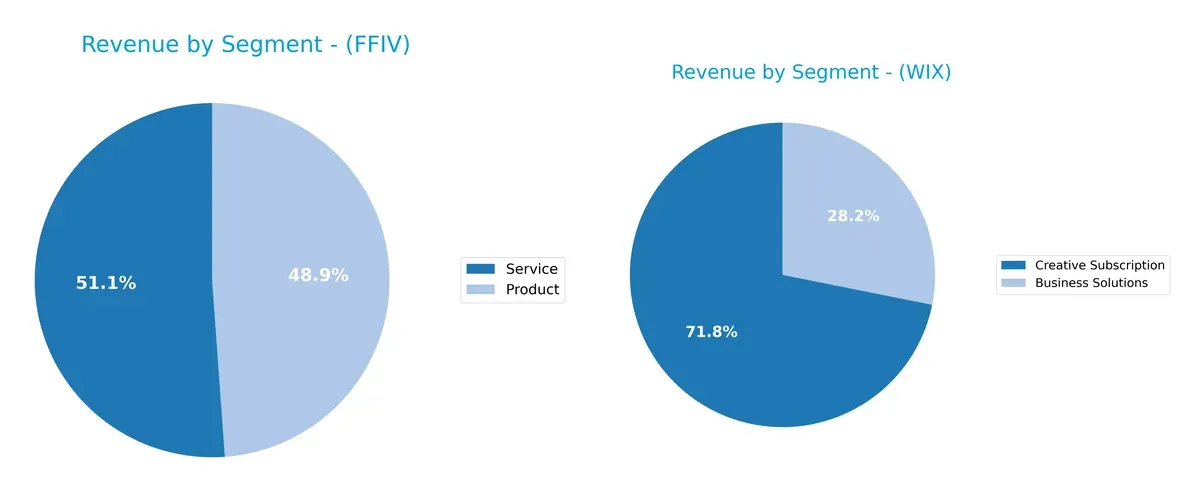
F5, Inc. balances revenue between Product ($1.51B) and Service ($1.58B), showing a near-even split that anchors its ecosystem lock-in. Wix.com leans heavily on Creative Subscription ($1.26B), which dwarfs its Business Solutions ($496M). Wix’s concentration suggests reliance on recurring subscriptions, exposing it to subscription risk. F5’s diversified mix signals resilience through combined product and service innovation, while Wix pivots on subscription growth for infrastructure dominance.
Strengths and Weaknesses Comparison
This table compares the strengths and weaknesses of F5, Inc. and Wix.com Ltd. based on diversification, profitability, financials, innovation, global presence, and market share:
F5, Inc. Strengths
- Balanced revenue from products (1.51B) and services (1.58B)
- Strong profitability with 22.42% net margin and 19.28% ROE
- Low debt levels with 3.65% debt-to-assets
- High fixed asset turnover (9.02) indicates efficient asset use
- Solid global presence with significant Americas (1.82B), EMEA (827M), and Asia Pacific (537M) sales
Wix.com Ltd. Strengths
- Growing subscription revenue (1.26B) with rising business solutions segment (496M)
- Favorable book value (PB negative) suggesting undervaluation
- Strong interest coverage (40.14)
- Moderate asset turnover (0.92) supports operational efficiency
- Global reach including North America (1.06B), Europe (441M), Asia Pacific (196M), and Latin America (67M)
F5, Inc. Weaknesses
- Elevated price multiples with PE at 26.91 and PB at 5.19
- No dividend yield limits income-focused investors
- Asset turnover low at 0.49 suggesting underutilized assets
Wix.com Ltd. Weaknesses
- Negative ROE (-175.57%) signals poor profitability
- Current ratio below 1 (0.84) indicates liquidity risk
- High debt-to-assets at 50.7% raises solvency concerns
- High PE multiple (86.21) implies overvaluation
- Zero dividend yield limits shareholder returns
F5, Inc. demonstrates a robust financial foundation with balanced revenue streams and low leverage but faces valuation concerns and asset utilization challenges. Wix.com Ltd. shows strong revenue growth and global reach but suffers from profitability issues and financial risks, impacting its overall stability.
The Moat Duel: Analyzing Competitive Defensibility
A structural moat is the only barrier protecting long-term profits from relentless competitive erosion. Let’s dissect the moats of two software infrastructure players:
F5, Inc.: Hardware-Software Integration Moat
F5’s moat stems from a unique hardware-software architecture blending multi-cloud security and delivery. This drives a high ROIC, stable 26% EBIT margin, and durable value creation. In 2026, further cloud partnerships could deepen this moat or face disruption from software-only rivals.
Wix.com Ltd.: Platform Ecosystem Moat
Wix builds a platform ecosystem with drag-and-drop tools and complementary services. Its moat relies on network effects and user lock-in, but ROIC trails WACC, signaling value erosion despite growing profitability. Expansion into vertical-specific applications may improve defenses but competitive pressures loom.
Verdict: Hardware-Software Integration vs. Platform Ecosystem
F5 possesses the deeper moat, creating consistent economic value with a ROIC 5.7% above WACC and rising profitability. Wix shows promise but still sheds value overall. F5 stands better poised to defend and grow market share in 2026.
Which stock offers better returns?
The past year shows stark contrasts: F5, Inc. surged 43%, accelerating its bullish momentum, while Wix.com Ltd. declined 38%, deepening its bearish trend.
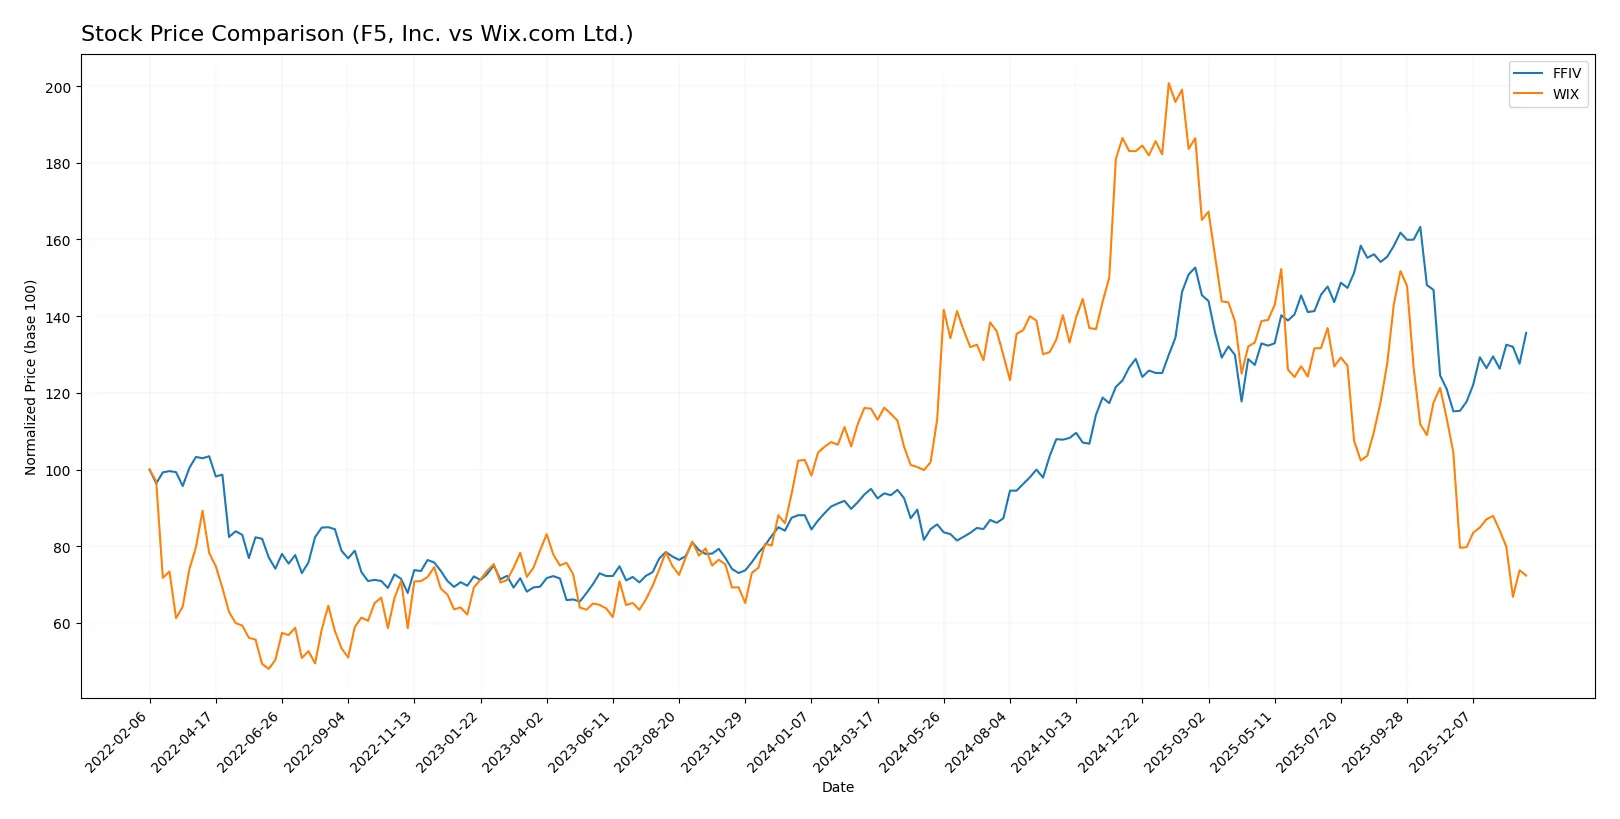
Trend Comparison
F5, Inc. posted a 42.85% gain over 12 months, marking a bullish trend with accelerating price momentum and a volatility (std deviation) of 48.51. Its price ranged from 165.57 to 331.75.
Wix.com Ltd. fell 37.54% over the same period, confirming a bearish trend with decelerating losses and a volatility of 35.68. Its price fluctuated between 80.16 and 240.89.
F5, Inc. clearly outperformed Wix.com Ltd. by delivering strong bullish returns against Wix’s sustained bearish decline over the past year.
Target Prices
Analysts present a cautiously optimistic consensus on target prices for F5, Inc. and Wix.com Ltd.
| Company | Target Low | Target High | Consensus |
|---|---|---|---|
| F5, Inc. | 295 | 352 | 330.67 |
| Wix.com Ltd. | 70 | 210 | 159.82 |
F5, Inc.’s target consensus sits about 20% above its current price of 275.61, reflecting confidence in its infrastructure software moat. Wix.com Ltd.’s wider target range signals higher volatility, but the consensus implies nearly double the current 86.84 price, suggesting strong growth expectations despite elevated beta risk.

Don’t Let Luck Decide Your Entry Point
Optimize your entry points with our advanced ProRealTime indicators. You’ll get efficient buy signals with precise price targets for maximum performance. Start outperforming now!
How do institutions grade them?
F5, Inc. Grades
The following table summarizes recent institutional grades for F5, Inc.:
| Grading Company | Action | New Grade | Date |
|---|---|---|---|
| Needham | maintain | Hold | 2026-01-28 |
| Piper Sandler | maintain | Overweight | 2026-01-28 |
| Goldman Sachs | maintain | Neutral | 2026-01-28 |
| Barclays | maintain | Equal Weight | 2026-01-28 |
| RBC Capital | maintain | Outperform | 2026-01-28 |
| JP Morgan | upgrade | Overweight | 2026-01-15 |
| Piper Sandler | upgrade | Overweight | 2026-01-05 |
| RBC Capital | upgrade | Outperform | 2026-01-05 |
| Morgan Stanley | maintain | Equal Weight | 2025-12-17 |
| Morgan Stanley | maintain | Equal Weight | 2025-10-28 |
Wix.com Ltd. Grades
Below is a summary of recent institutional grades for Wix.com Ltd.:
| Grading Company | Action | New Grade | Date |
|---|---|---|---|
| Citizens | maintain | Market Outperform | 2026-01-22 |
| Barclays | maintain | Overweight | 2026-01-21 |
| Morgan Stanley | maintain | Overweight | 2026-01-15 |
| Wells Fargo | maintain | Overweight | 2025-12-19 |
| Cantor Fitzgerald | maintain | Overweight | 2025-12-11 |
| Cantor Fitzgerald | maintain | Overweight | 2025-11-20 |
| RBC Capital | maintain | Outperform | 2025-11-20 |
| Wells Fargo | maintain | Overweight | 2025-11-20 |
| Benchmark | maintain | Buy | 2025-11-20 |
| Barclays | maintain | Overweight | 2025-11-20 |
Which company has the best grades?
Wix.com Ltd. holds generally higher and more consistent positive grades, including multiple “Overweight,” “Outperform,” and a “Buy” rating. F5, Inc.’s grades show more mixed signals with several “Hold” and “Equal Weight” ratings despite some upgrades. Investors might interpret Wix.com’s stronger institutional support as a more confident outlook.
Risks specific to each company
In the 2026 market environment, the following categories identify critical pressure points and systemic threats facing both F5, Inc. and Wix.com Ltd.:
1. Market & Competition
F5, Inc.
- Operates in multi-cloud app security with strong enterprise focus; faces intense competition from cloud giants.
Wix.com Ltd.
- Serves broad SMB and individual markets with drag-and-drop platforms; high competitive pressure from larger SaaS providers.
2. Capital Structure & Debt
F5, Inc.
- Very low debt-to-equity ratio (0.06), strong balance sheet, minimal financial risk.
Wix.com Ltd.
- High debt-to-assets (50.7%), negative debt-to-equity ratio signals complex leverage and risk.
3. Stock Volatility
F5, Inc.
- Beta near 1 (0.975), indicating market-like volatility.
Wix.com Ltd.
- Higher beta (1.418) suggests greater stock price swings and risk.
4. Regulatory & Legal
F5, Inc.
- Subject to global data security and privacy regulations; compliance critical amid evolving standards.
Wix.com Ltd.
- Faces regulatory scrutiny in multiple jurisdictions; challenges from data privacy laws and payment processing rules.
5. Supply Chain & Operations
F5, Inc.
- Relies on hardware-software integration; supply chain disruptions can impact hardware delivery.
Wix.com Ltd.
- Cloud-based platform less exposed to physical supply chain but dependent on third-party cloud providers.
6. ESG & Climate Transition
F5, Inc.
- Moderate ESG exposure; pressure to reduce data center energy use and improve sustainability.
Wix.com Ltd.
- Faces increasing demand for ESG compliance from investors and customers; potential operational costs.
7. Geopolitical Exposure
F5, Inc.
- US-based with global sales; geopolitical tensions could affect international contracts.
Wix.com Ltd.
- Israeli-headquartered with significant international user base; geopolitical risk in Middle East and global data policies.
Which company shows a better risk-adjusted profile?
F5, Inc. faces its largest risk in market competition against cloud giants but maintains a strong balance sheet and stable financials. Wix.com’s biggest risk is its leveraged capital structure paired with elevated stock volatility and weaker profitability metrics. Given F5’s safe-zone Altman Z-score (5.3) and strong Piotroski score (7), it offers a superior risk-adjusted profile. Recent data highlight Wix’s precarious debt level and negative ROE, underscoring financial vulnerability amid market volatility.
Final Verdict: Which stock to choose?
F5, Inc. (FFIV) excels as a cash-generative powerhouse with a durable competitive advantage, consistently earning returns well above its cost of capital. Its disciplined capital allocation and robust profitability underpin growth. A point of vigilance is its premium valuation, which demands justified growth to sustain investor confidence. FFIV suits portfolios targeting aggressive growth with a margin of safety.
Wix.com Ltd. (WIX) boasts a strategic moat rooted in its recurring revenue model and platform stickiness, providing steady customer engagement. Relative to FFIV, Wix carries more financial risk and valuation uncertainty but offers exposure to growth via innovation in cloud services. This stock fits Growth at a Reasonable Price (GARP) investors willing to tolerate volatility for upside potential.
If you prioritize proven value creation and financial resilience, FFIV outshines due to its stable margins and strong economic moat. However, if you seek higher growth potential with acceptance of elevated risk and valuation swings, WIX offers a compelling scenario through its innovative platform expansion. Each appeals to distinct investor profiles balancing growth ambitions and risk tolerance.
Disclaimer: Investment carries a risk of loss of initial capital. The past performance is not a reliable indicator of future results. Be sure to understand risks before making an investment decision.
Go Further
I encourage you to read the complete analyses of F5, Inc. and Wix.com Ltd. to enhance your investment decisions: