Home > Comparison > Technology > FFIV vs VERI
The strategic rivalry between F5, Inc. and Veritone, Inc. shapes key dynamics in the technology sector’s software infrastructure industry. F5, a capital-intensive provider of multi-cloud application security and delivery solutions, contrasts with Veritone’s AI-driven, high-growth software platform specializing in machine learning and data analytics. This analysis explores their divergent operational models and competitive positioning to identify which company offers a superior risk-adjusted investment opportunity for diversified portfolios.
Table of contents
Companies Overview
F5, Inc. and Veritone, Inc. stand as key players in the evolving software infrastructure sector, each commanding unique market niches.
F5, Inc.: Multi-Cloud Application Security Leader
F5, Inc. dominates the multi-cloud application security and delivery market. Its core revenue stems from high-performance hardware and software solutions like BIG-IP appliances and NGINX products. In 2026, F5 sharpens its strategic focus on integrating cloud-native security with on-premises environments, reinforcing its competitive advantage in securing complex application architectures worldwide.
Veritone, Inc.: AI-Powered Insight Provider
Veritone, Inc. specializes in AI computing solutions, powering its revenue through the aiWARE platform that analyzes structured and unstructured data via machine learning models. Its 2026 strategy centers on expanding AI-driven media analytics and enterprise applications, enhancing its market position in delivering cognitive insights across diverse industries including media and government.
Strategic Collision: Similarities & Divergences
Both companies operate in software infrastructure but diverge sharply in philosophy: F5 embraces a hybrid cloud security model, while Veritone pushes AI as an open cognitive platform. Their primary battleground is the enterprise technology stack, from application delivery to data intelligence. This contrast shapes distinct investment profiles—F5 offers stability with mature cloud-security moats; Veritone presents higher risk with AI innovation growth potential.
Income Statement Comparison
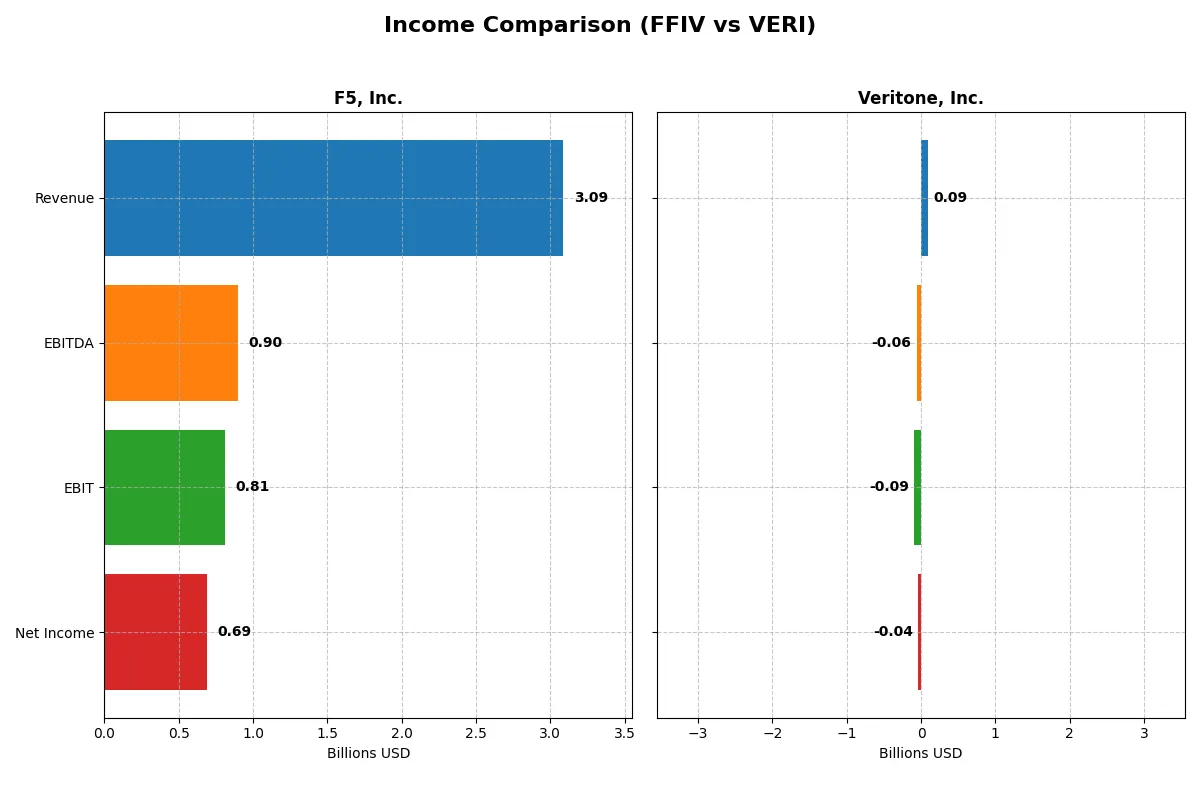
This data dissects the core profitability and scalability of both corporate engines to reveal who dominates the bottom line:
| Metric | F5, Inc. (FFIV) | Veritone, Inc. (VERI) |
|---|---|---|
| Revenue | 3.09B | 92.6M |
| Cost of Revenue | 564M | 27.3M |
| Operating Expenses | 1.76B | 154M |
| Gross Profit | 2.52B | 65.4M |
| EBITDA | 901M | -58.8M |
| EBIT | 808M | -88.1M |
| Interest Expense | 0 | 12.1M |
| Net Income | 692M | -37.4M |
| EPS | 11.95 | -0.98 |
| Fiscal Year | 2025 | 2024 |
Income Statement Analysis: The Bottom-Line Duel
This income statement comparison reveals which company drives superior profitability and operational efficiency in their respective markets.
F5, Inc. Analysis
F5, Inc. steadily grows revenue from 2.6B in 2021 to 3.1B in 2025, with net income surging from 331M to 692M. Gross margin remains robust above 81%, and net margin improves to 22.4%, reflecting tight cost control. In 2025, F5’s operating efficiency accelerates, with EBIT growing 21%, signaling strong momentum and disciplined capital allocation.
Veritone, Inc. Analysis
Veritone’s revenue peaked at 150M in 2022 but declined to 93M by 2024. Despite a gross margin near 71%, it suffers heavy operating losses with EBIT margin at -95%. Net income remains negative, though improving from -65M in 2023 to -37M in 2024. The company faces high interest costs (13%) and struggles to convert revenue into profits, showing operational challenges.
Verdict: Profitability Strength vs. Growth Struggles
F5, Inc. outperforms Veritone with consistent revenue growth, expanding margins, and strong net income gains. Veritone, while growing overall since 2020, battles large losses and negative margins, undermining financial stability. For investors prioritizing reliable profitability and operational discipline, F5’s profile offers a clearer path to sustainable value creation.
Financial Ratios Comparison
These vital ratios act as a diagnostic tool to expose the underlying fiscal health, valuation premiums, and capital efficiency of the companies compared below:
| Ratios | F5, Inc. (FFIV) | Veritone, Inc. (VERI) |
|---|---|---|
| ROE | 19.3% | -277.9% |
| ROIC | 14.0% | -58.3% |
| P/E | 26.9 | -3.3 |
| P/B | 5.19 | 9.27 |
| Current Ratio | 1.56 | 0.97 |
| Quick Ratio | 1.51 | 0.97 |
| D/E | 0.06 | 8.91 |
| Debt-to-Assets | 3.7% | 60.5% |
| Interest Coverage | 0 | -7.3 |
| Asset Turnover | 0.49 | 0.47 |
| Fixed Asset Turnover | 9.02 | 8.51 |
| Payout ratio | 0 | 0 |
| Dividend yield | 0 | 0 |
| Fiscal Year | 2025 | 2024 |
Efficiency & Valuation Duel: The Vital Signs
Financial ratios act as the company’s DNA, revealing hidden risks and operational excellence crucial for investment insight.
F5, Inc.
F5, Inc. delivers strong profitability with a 19.3% ROE and a 22.4% net margin, signaling efficient operations. Despite a stretched P/E of 26.9 and a high P/B of 5.2, its balance sheet remains solid. The company does not pay dividends but reallocates cash towards R&D, fueling sustainable growth.
Veritone, Inc.
Veritone struggles with deeply negative returns: ROE at -278% and net margin at -40.4%, reflecting severe operational challenges. Its valuation is mixed with a negative P/E but an elevated P/B of 9.3, indicating market skepticism. The company shows no dividend and faces liquidity concerns, with a current ratio below 1.
Premium Valuation vs. Operational Safety
F5, Inc. offers a superior balance of profitability and financial health despite premium valuation multiples. Veritone’s metrics reveal high risk and operational instability. Investors favoring operational safety and consistent returns will find F5’s profile more suitable, while Veritone fits speculative risk-tolerant profiles.
Which one offers the Superior Shareholder Reward?
F5, Inc. (FFIV) pays no dividends but returns capital aggressively through buybacks, supported by a strong free cash flow of 15.7/share in 2025 and a payout ratio of zero, ensuring sustainability. Veritone, Inc. (VERI) pays no dividend and burns cash, with negative margins and high debt leverage undermining buybacks. I find FFIV’s disciplined capital allocation and robust cash generation deliver superior long-term shareholder rewards in 2026.
Comparative Score Analysis: The Strategic Profile
The radar chart reveals the fundamental DNA and trade-offs of F5, Inc. and Veritone, Inc., highlighting their financial strengths and valuation nuances:
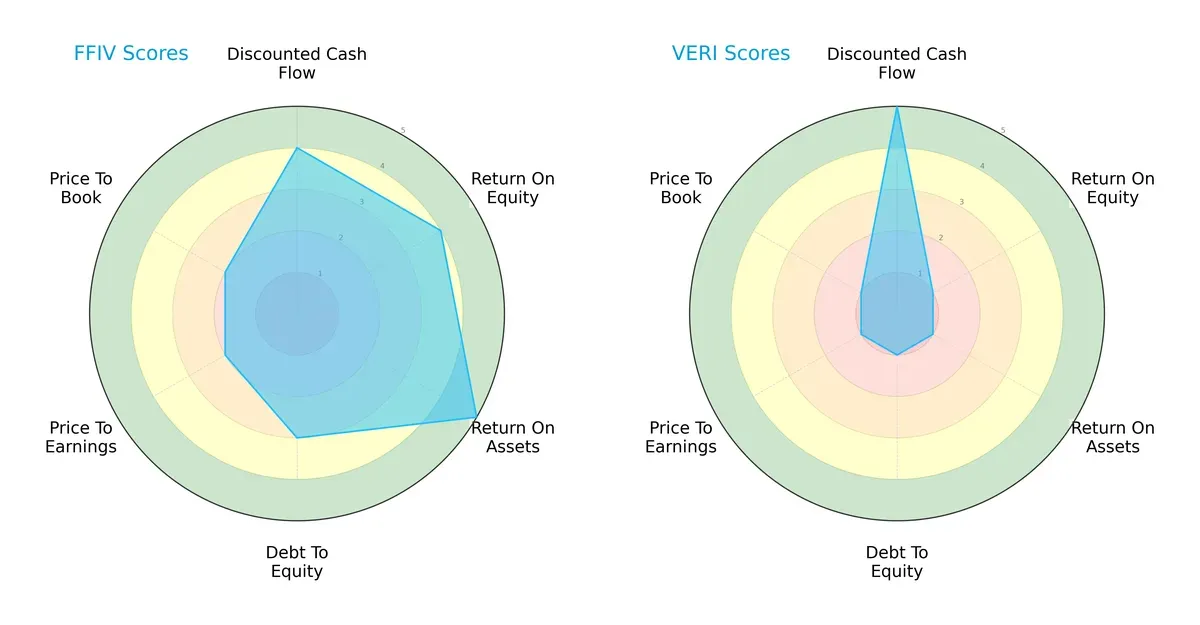
F5, Inc. presents a well-rounded profile with favorable DCF, ROE, and ROA scores, demonstrating efficient asset use and profitability. Its moderate debt-to-equity and valuation scores suggest some leverage and pricing caution. Veritone, Inc. relies heavily on a strong DCF score but scores very low on profitability and leverage metrics, indicating financial strain and high valuation risk. Overall, F5, Inc. offers a more balanced and stable investment proposition.
Bankruptcy Risk: Solvency Showdown
The Altman Z-Score gap sharply contrasts the firms’ long-term viability:
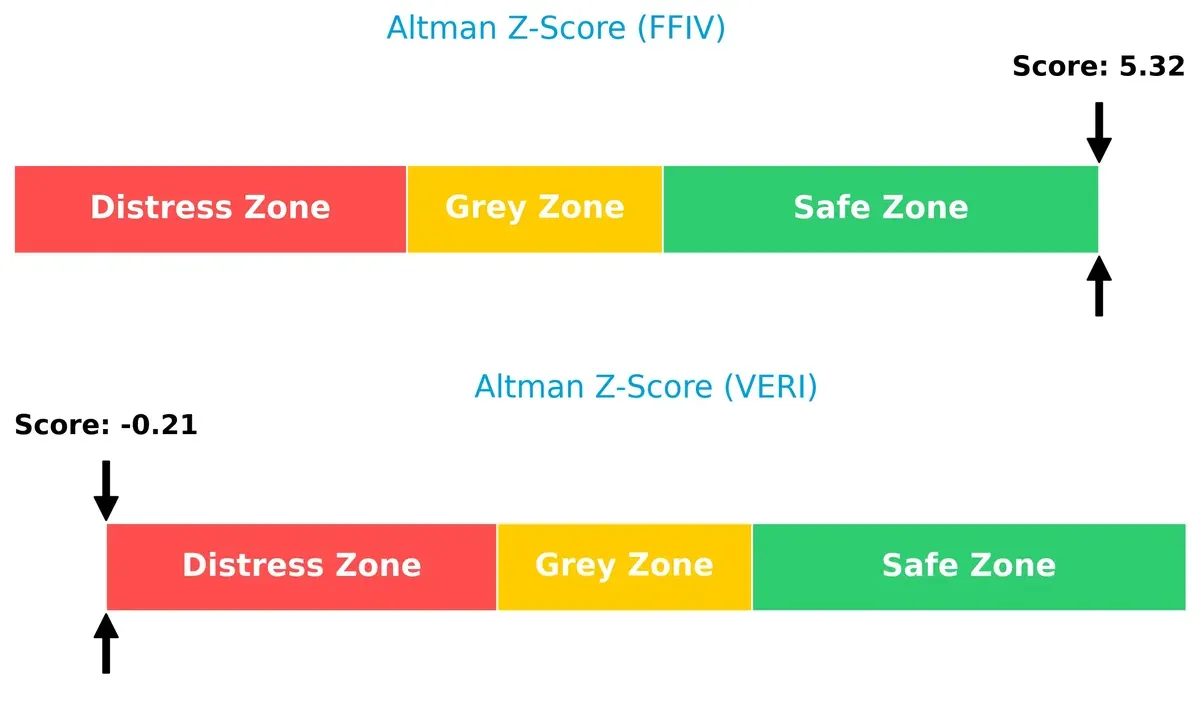
F5, Inc. scores 5.3, firmly in the safe zone, signaling robust financial health and low bankruptcy risk. Veritone, Inc.’s score of -0.2 places it in the distress zone, warning of significant solvency challenges and a high likelihood of financial distress in the current cycle.
Financial Health: Quality of Operations
Piotroski F-Scores spotlight operational quality and internal financial strength:
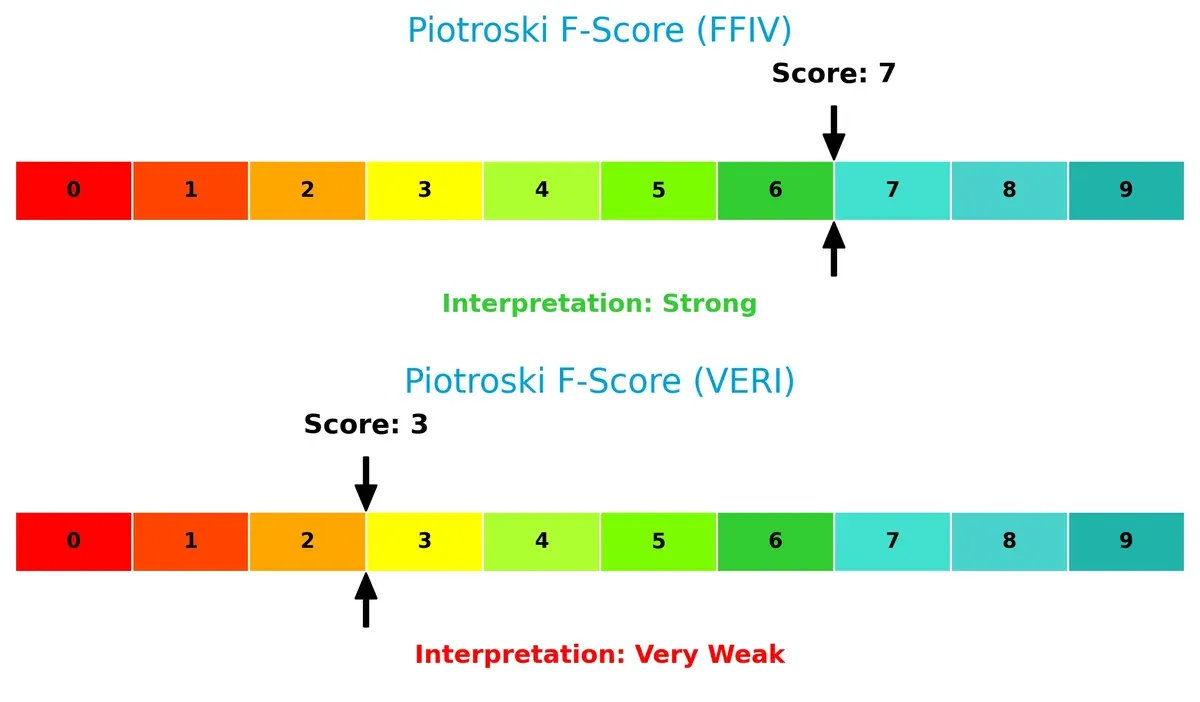
F5, Inc. scores a strong 7, indicating solid profitability, efficient asset management, and prudent leverage. Veritone, Inc. scores only 3, reflecting weak internal financial controls and potential red flags for investors focused on stability and value. This disparity confirms F5’s superior operational health.
How are the two companies positioned?
This section dissects the operational DNA of F5 and Veritone by comparing their revenue distribution and internal dynamics. The goal is to confront their economic moats to identify which model offers the most resilient and sustainable advantage.
Revenue Segmentation: The Strategic Mix
This comparison dissects how F5, Inc. and Veritone, Inc. diversify income streams and reveals where their primary sector bets lie:
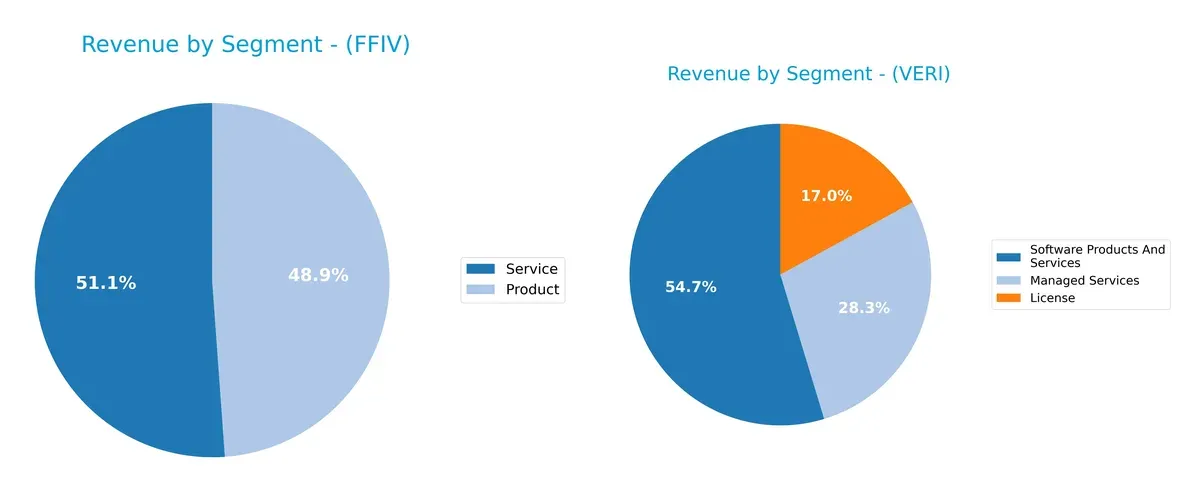
F5, Inc. anchors revenue almost evenly between Product ($1.51B) and Service ($1.58B) segments in 2025, showing a balanced ecosystem approach. In contrast, Veritone, Inc. leans heavily on Software Products and Services ($61M) while smaller segments like License ($19M) and Managed Services ($32M) add modest diversity. F5’s mix reduces concentration risk and supports infrastructure dominance, whereas Veritone’s reliance on software pivots on innovation but faces higher segmentation vulnerability.
Strengths and Weaknesses Comparison
This table compares the strengths and weaknesses of F5, Inc. and Veritone, Inc.:
F5 Strengths
- Favorable net margin, ROE, and ROIC indicating strong profitability
- Low debt-to-equity and debt-to-assets ratios reflect conservative leverage
- High fixed asset turnover suggests efficient asset use
- Favorable current and quick ratios ensure liquidity
- Diverse revenue streams from product and service segments
- Global presence across Americas, Asia Pacific, and EMEA
Veritone Strengths
- Favorable fixed asset turnover shows efficient asset use
- Positive PE ratio status possibly indicates growth potential in market valuation
F5 Weaknesses
- Unfavorable P/E and P/B ratios indicate high valuation risk
- Asset turnover is lower than ideal, suggesting less efficient revenue generation
- Zero dividend yield may deter income-focused investors
Veritone Weaknesses
- Negative net margin, ROE, and ROIC reveal deep unprofitability
- High debt-to-equity and debt-to-assets ratios indicate significant leverage risk
- Unfavorable current ratio signals liquidity concerns
- Negative interest coverage ratio risks solvency
- Unfavorable P/B ratio and zero dividend yield reduce attractiveness
F5’s strengths lie in profitability, financial health, and global diversification, though valuation concerns exist. Veritone faces significant financial challenges and liquidity risks that could impact its strategic flexibility.
The Moat Duel: Analyzing Competitive Defensibility
A structural moat is the only true shield protecting long-term profits from relentless competition erosion. Here’s how F5, Inc. and Veritone, Inc. stack up:
F5, Inc.: Durable Value Creator with High ROIC
F5’s moat is its cost advantage and intangible assets, shown by a strong 26% EBIT margin and 5.7% ROIC above WACC. Its multi-cloud security platform sustains margin stability. Expanding cloud partnerships in 2026 could deepen this advantage.
Veritone, Inc.: Struggling Innovator with Weak Capital Efficiency
Veritone relies on AI platform innovation but lacks a durable moat. Negative 95% EBIT margin and ROIC well below WACC show value destruction. Its shrinking revenue and declining ROIC threaten competitive positioning despite AI growth potential.
Moat Strength: Cost Advantage vs. Innovation Risk
F5 boasts a wider, more durable moat through consistent value creation and margin resilience. Veritone’s innovation is promising but financially fragile. F5 is better equipped to defend and expand market share in 2026.
Which stock offers better returns?
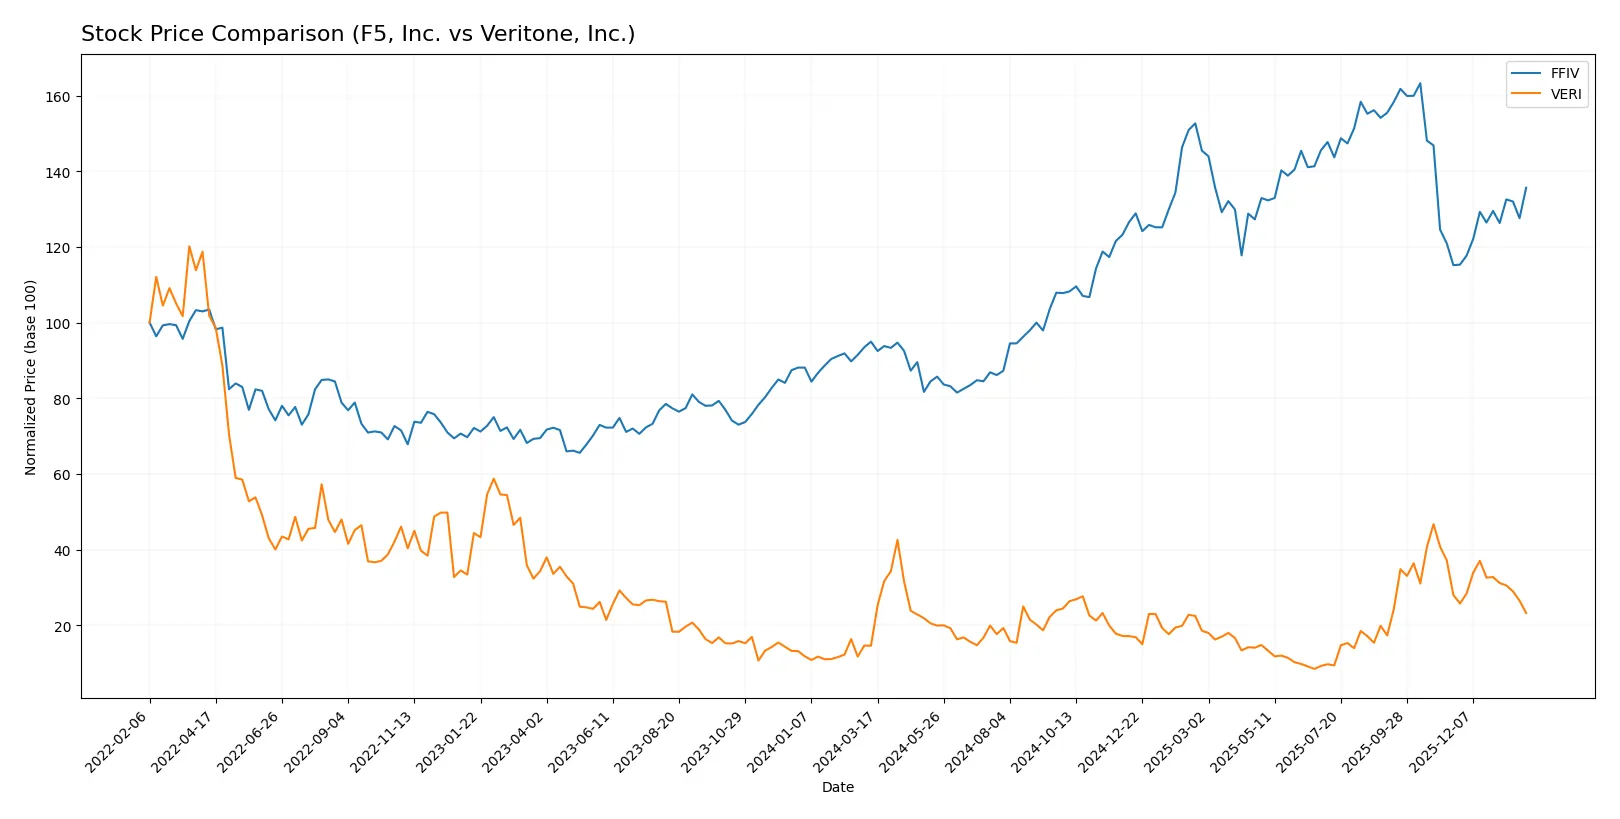
The past year reveals contrasting dynamics: F5, Inc. (FFIV) posts strong price acceleration with a 42.85% gain, while Veritone, Inc. (VERI) shows a higher overall rise but recent weakness.
Trend Comparison
F5, Inc. stock gained 42.85% over the last 12 months, exhibiting a bullish trend with accelerating momentum and high volatility. The price ranged from 165.57 to 331.75, confirming strong upward movement.
Veritone, Inc. stock increased 59.37% in the same period, marking a bullish but decelerating trend. Volatility remained low, with a recent 16.98% drop signaling short-term weakness.
Comparing both, Veritone delivered the highest overall market return, despite recent losses, while F5 showed more consistent acceleration and stronger buyer dominance.
Target Prices
Analysts present a clear target consensus for both F5, Inc. and Veritone, Inc.
| Company | Target Low | Target High | Consensus |
|---|---|---|---|
| F5, Inc. | 295 | 352 | 330.67 |
| Veritone, Inc. | 9 | 10 | 9.5 |
F5, Inc.’s target consensus sits about 20% above its current price of 275.61, signaling moderate upside potential. Veritone, Inc.’s consensus target is significantly higher than its current price of 3.57, implying strong bullish expectations despite elevated volatility risks.

Don’t Let Luck Decide Your Entry Point
Optimize your entry points with our advanced ProRealTime indicators. You’ll get efficient buy signals with precise price targets for maximum performance. Start outperforming now!
How do institutions grade them?
The following tables summarize recent institutional grades for F5, Inc. and Veritone, Inc.:
F5, Inc. Grades
This table lists the latest grades from reputable financial institutions for F5, Inc.
| Grading Company | Action | New Grade | Date |
|---|---|---|---|
| Needham | maintain | Hold | 2026-01-28 |
| Piper Sandler | maintain | Overweight | 2026-01-28 |
| Goldman Sachs | maintain | Neutral | 2026-01-28 |
| Barclays | maintain | Equal Weight | 2026-01-28 |
| RBC Capital | maintain | Outperform | 2026-01-28 |
| JP Morgan | upgrade | Overweight | 2026-01-15 |
| Piper Sandler | upgrade | Overweight | 2026-01-05 |
| RBC Capital | upgrade | Outperform | 2026-01-05 |
| Morgan Stanley | maintain | Equal Weight | 2025-12-17 |
| Morgan Stanley | maintain | Equal Weight | 2025-10-28 |
Veritone, Inc. Grades
Below are the recent grades from verified grading companies for Veritone, Inc.
| Grading Company | Action | New Grade | Date |
|---|---|---|---|
| D. Boral Capital | maintain | Buy | 2026-01-30 |
| D. Boral Capital | maintain | Buy | 2025-12-09 |
| D. Boral Capital | maintain | Buy | 2025-12-04 |
| D. Boral Capital | maintain | Buy | 2025-12-02 |
| Needham | maintain | Buy | 2025-12-02 |
| D. Boral Capital | maintain | Buy | 2025-11-07 |
| D. Boral Capital | maintain | Buy | 2025-10-28 |
| HC Wainwright & Co. | maintain | Buy | 2025-10-20 |
| D. Boral Capital | maintain | Buy | 2025-10-15 |
| D. Boral Capital | maintain | Buy | 2025-09-24 |
Which company has the best grades?
Veritone, Inc. consistently receives “Buy” ratings from multiple institutions, indicating strong market confidence. F5, Inc. shows more mixed grades ranging from Hold to Outperform, with several recent upgrades. Investors may view Veritone’s uniform Buy grades as a sign of higher consensus enthusiasm.
Risks specific to each company
The following categories identify the critical pressure points and systemic threats facing both firms in the 2026 market environment:
1. Market & Competition
F5, Inc.
- Strong market position in multi-cloud application security with established enterprise clients.
Veritone, Inc.
- Smaller market cap and niche AI platform face intense competition and scalability challenges.
2. Capital Structure & Debt
F5, Inc.
- Very low debt-to-equity ratio (0.06) signals prudent leverage and financial stability.
Veritone, Inc.
- High debt-to-equity (8.91) and debt-to-assets (60.54%) pose significant solvency risks.
3. Stock Volatility
F5, Inc.
- Beta near 1 (0.975) indicates moderate market risk aligned with NASDAQ tech sector.
Veritone, Inc.
- Elevated beta (2.052) reflects higher price swings and investor uncertainty.
4. Regulatory & Legal
F5, Inc.
- Operating globally with compliance in multiple jurisdictions; standard cybersecurity regulations apply.
Veritone, Inc.
- AI sector regulation evolving; potential legal risks around data privacy and AI ethics.
5. Supply Chain & Operations
F5, Inc.
- Established partnerships with AWS, Azure, and Google Cloud mitigate supply chain risks.
Veritone, Inc.
- Smaller scale and reliance on AI model development increase operational complexity and risk.
6. ESG & Climate Transition
F5, Inc.
- Larger firm with more resources to invest in ESG compliance but limited disclosure on climate initiatives.
Veritone, Inc.
- Emerging company under pressure to integrate ESG into AI solutions amid growing investor scrutiny.
7. Geopolitical Exposure
F5, Inc.
- Global presence exposes it to geopolitical risks across Americas, EMEA, and APAC markets.
Veritone, Inc.
- Primarily US and UK-focused, limiting but not eliminating geopolitical risk.
Which company shows a better risk-adjusted profile?
F5, Inc. stands out with a far stronger risk-adjusted profile. Its low leverage, stable market position, and solid financial metrics reduce exposure to systemic shocks. Conversely, Veritone’s high debt and negative profitability metrics elevate its risk substantially. The stark contrast in Altman Z-Scores—safe zone for F5 and distress zone for Veritone—underscores this gap. Recent data show Veritone’s debt load and weak liquidity are critical red flags, while F5’s conservative capital structure and stable beta make it far more resilient.
Final Verdict: Which stock to choose?
F5, Inc. (FFIV) stands out as a cash-generating machine with a durable competitive moat. Its ability to consistently deliver returns well above its cost of capital highlights strong capital allocation and operational excellence. The main point of vigilance remains its premium valuation, which might limit near-term upside. FFIV suits portfolios targeting aggressive growth with a focus on quality.
Veritone, Inc. (VERI) offers a strategic moat rooted in innovative AI capabilities, giving it a foothold in a high-growth niche. However, its financial instability and value destruction signal a higher risk profile compared to FFIV. VERI fits investors seeking speculative growth with tolerance for volatility and turnaround potential.
If you prioritize consistent value creation and operational strength, FFIV is the compelling choice due to its robust profitability and low financial risk. However, if you seek high-reward speculative exposure and can withstand financial uncertainty, VERI offers the potential for outsized gains despite its current challenges. Each presents distinct profiles that align with different risk appetites and investment horizons.
Disclaimer: Investment carries a risk of loss of initial capital. The past performance is not a reliable indicator of future results. Be sure to understand risks before making an investment decision.
Go Further
I encourage you to read the complete analyses of F5, Inc. and Veritone, Inc. to enhance your investment decisions: