Home > Comparison > Technology > VRSN vs FFIV
The strategic rivalry between VeriSign, Inc. and F5, Inc. shapes the evolution of the technology sector’s software infrastructure landscape. VeriSign operates as a domain name registry titan, anchoring internet security and stability. F5, by contrast, delivers multi-cloud application security and delivery solutions with a broad enterprise focus. This analysis contrasts their differing growth vectors to identify which offers a superior risk-adjusted profile for a diversified portfolio in 2026.
Table of contents
Companies Overview
VeriSign and F5 stand as pivotal players in the software infrastructure sector, shaping internet security and application delivery globally.
VeriSign, Inc.: Guardian of Internet Navigation
VeriSign dominates the domain name registry market, providing critical internet infrastructure services. Its core revenue stems from managing the authoritative databases for .com and .net domains, enabling global e-commerce. In 2026, VeriSign’s strategic focus centers on maintaining internet security, stability, and resiliency through root server operations and expanded registry services.
F5, Inc.: Architect of Multi-Cloud Application Security
F5 leads in multi-cloud application delivery and security, generating revenue via hardware appliances, software modules, and cloud-native solutions. Its portfolio spans advanced firewalls, DDoS protection, and web gateways. The company’s 2026 strategy emphasizes enabling customers to securely deploy and govern applications across on-premises and public cloud architectures.
Strategic Collision: Similarities & Divergences
Both firms anchor critical internet infrastructure but diverge sharply in approach—VeriSign focuses on a closed ecosystem of domain management, while F5 champions open, multi-cloud security frameworks. They compete primarily on securing digital assets and ensuring application availability. VeriSign offers a stable, niche moat, whereas F5 presents a dynamic growth profile shaped by evolving cloud architectures.
Income Statement Comparison
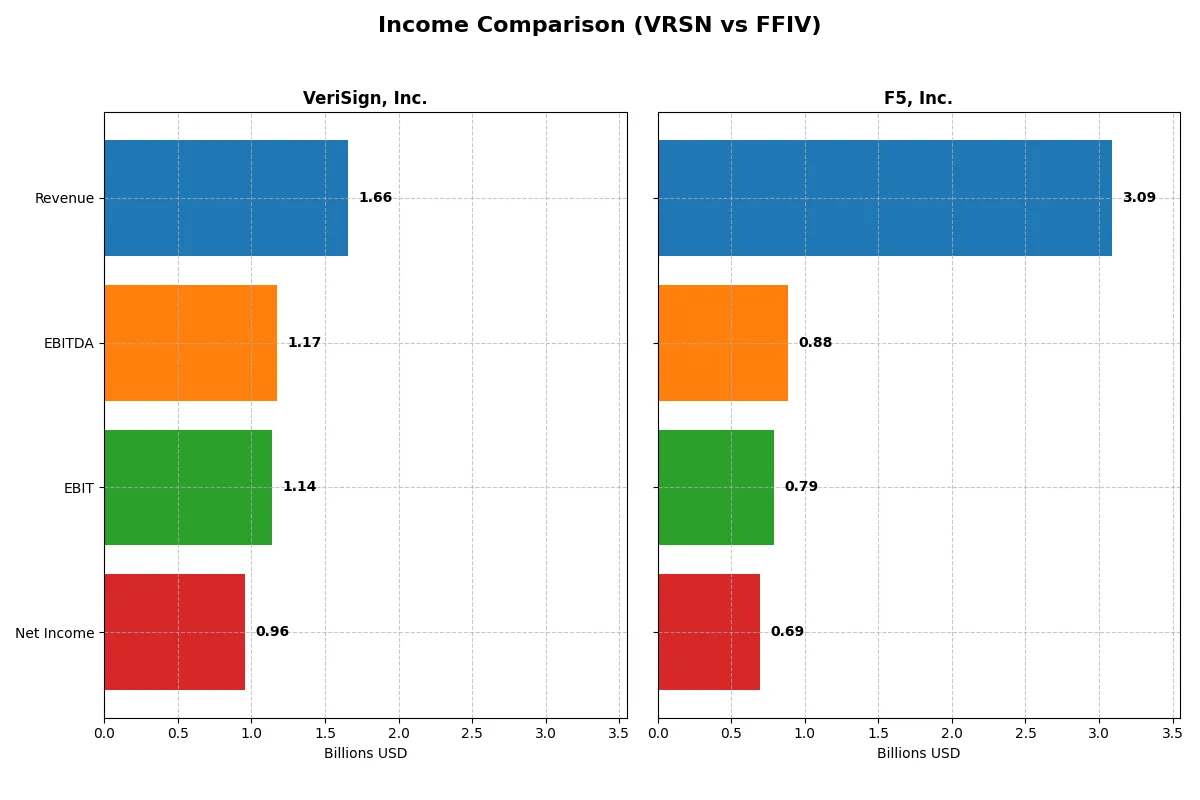
This data dissects the core profitability and scalability of both corporate engines to reveal who dominates the bottom line:
| Metric | VeriSign, Inc. (VRSN) | F5, Inc. (FFIV) |
|---|---|---|
| Revenue | 1.66B | 3.09B |
| Cost of Revenue | 196.3M | 574M |
| Operating Expenses | 339.3M | 1.75B |
| Gross Profit | 1.46B | 2.51B |
| EBITDA | 1.17B | 884M |
| EBIT | 1.14B | 791M |
| Interest Expense | 77M | 0 |
| Net Income | 955.5M | 692.4M |
| EPS | 8.83 | 11.96 |
| Fiscal Year | 2025 | 2025 |
Income Statement Analysis: The Bottom-Line Duel
This income statement comparison unveils which company operates with superior efficiency and profitability in their core business engines.
VeriSign, Inc. Analysis
VeriSign’s revenue climbed steadily from 1.33B in 2021 to 1.66B in 2025, with net income rising from 785M to 955M in the same period. The company maintains an exceptionally strong gross margin near 88%, and a net margin around 58%, signaling robust profitability. In 2025, despite a modest 6.4% revenue growth, VeriSign’s net margin expanded by 14.3%, reflecting improved bottom-line efficiency.
F5, Inc. Analysis
F5’s revenue grew from 2.6B in 2021 to 3.1B in 2025, with net income surging from 331M to 692M. Its gross margin holds at a healthy 81%, but net margin is considerably lower at 22%. The latest year showed 9.7% revenue growth and an 11.4% net margin increase, indicating solid momentum and effective expense control amid rapid expansion.
Margin Dominance vs. Growth Momentum
VeriSign commands superior margins, delivering nearly triple F5’s net margin, reflecting a high-moat, capital-light model. Conversely, F5 posts faster revenue and net income growth, signaling aggressive market capture. For investors, VeriSign appeals as a steady profit generator, while F5 offers a growth-oriented profile with expanding scale but thinner margins.
Financial Ratios Comparison
These vital ratios act as a diagnostic tool to expose the underlying fiscal health, valuation premiums, and capital efficiency of the companies compared below:
| Ratios | VeriSign, Inc. (VRSN) | F5, Inc. (FFIV) |
|---|---|---|
| ROE | -64.8% | 19.3% |
| ROIC | -1.52% | 13.8% |
| P/E | 23.5 | 26.9 |
| P/B | -15.2 | 5.19 |
| Current Ratio | 0.49 | 1.56 |
| Quick Ratio | 0.49 | 1.51 |
| D/E | -1.21 | 0.07 |
| Debt-to-Assets | 2.66 | 0.04 |
| Interest Coverage | 14.6 | 0 (not reported) |
| Asset Turnover | 2.46 | 0.49 |
| Fixed Asset Turnover | 7.75 | 9.02 |
| Payout ratio | 22.5% | 0% |
| Dividend yield | 0.96% | 0% |
| Fiscal Year | 2025 | 2025 |
Efficiency & Valuation Duel: The Vital Signs
Financial ratios act as a company’s DNA, revealing hidden risks and operational excellence to guide investor decisions with clarity.
VeriSign, Inc.
VeriSign shows a high net margin of 57.68%, indicating strong profitability, but suffers from a deeply negative ROE of -64.84%, signaling shareholder value erosion. Its P/E at 23.49 is neutral, not overly stretched. Dividend yield is low at 0.96%, suggesting limited direct shareholder returns, with capital likely reinvested in R&D.
F5, Inc.
F5 posts a solid ROE of 19.28% and a net margin of 22.42%, reflecting efficient operations. However, its P/E of 26.91 appears expensive compared to the sector. The company pays no dividends, focusing instead on growth and reinvestment, supported by favorable liquidity with a current ratio of 1.56, signaling financial stability.
Operational Strength vs. Valuation Stretch
F5 offers a more balanced profile with positive returns and sound liquidity, despite a premium valuation. VeriSign’s high profitability contrasts sharply with its negative equity returns and weak liquidity, posing risks. Investors seeking operational safety may prefer F5, while those tolerating risk might consider VeriSign’s margin strength.
Which one offers the Superior Shareholder Reward?
I observe that VeriSign (VRSN) pays a modest dividend yield of 0.96% with a sustainable payout ratio near 22.5% and a strong free cash flow coverage of 4.58x in 2025. Its buyback intensity is not explicitly stated but implied by high free cash flow per share of $11.56. F5 (FFIV), by contrast, pays no dividend but aggressively reinvests free cash flow ($15.72 per share in 2025) into growth, supported by a robust buyback program reflected in consistent free cash flow ratios near 95%. I find F5’s distribution model more sustainable, balancing reinvestment and buybacks with a conservative debt profile and improving margins. In 2026, F5 offers a superior total return profile based on stronger capital allocation discipline and growth potential, while VeriSign’s dividend adds stability but limits upside.
Comparative Score Analysis: The Strategic Profile
The radar chart reveals the fundamental DNA and trade-offs of VeriSign, Inc. and F5, Inc., highlighting their core strengths and vulnerabilities:
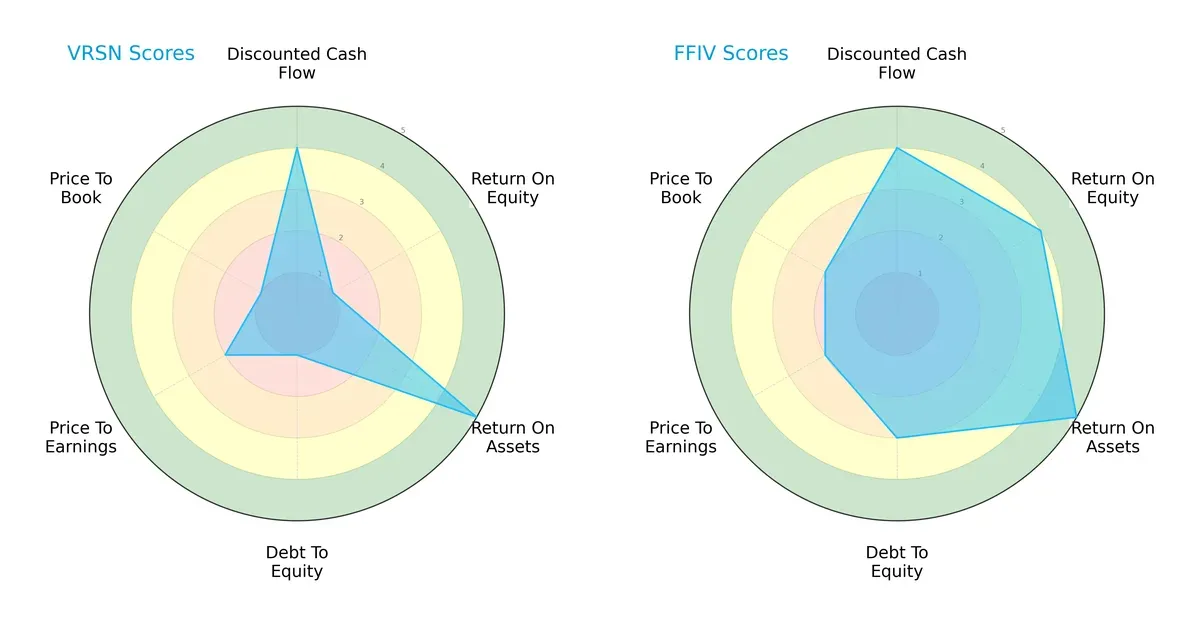
F5, Inc. exhibits a more balanced profile with strong scores in ROE (4) and moderate debt-to-equity (3), reflecting prudent capital allocation and financial stability. VeriSign, Inc. relies heavily on asset efficiency (ROA score 5) but struggles with leverage (debt-to-equity score 1) and profitability (ROE score 1). F5’s diversified strengths position it better against market cyclicality, while VeriSign’s concentrated edges signal higher risk in downturns.
Bankruptcy Risk: Solvency Showdown
The Altman Z-Score gap signals a stark contrast in long-term survival odds:
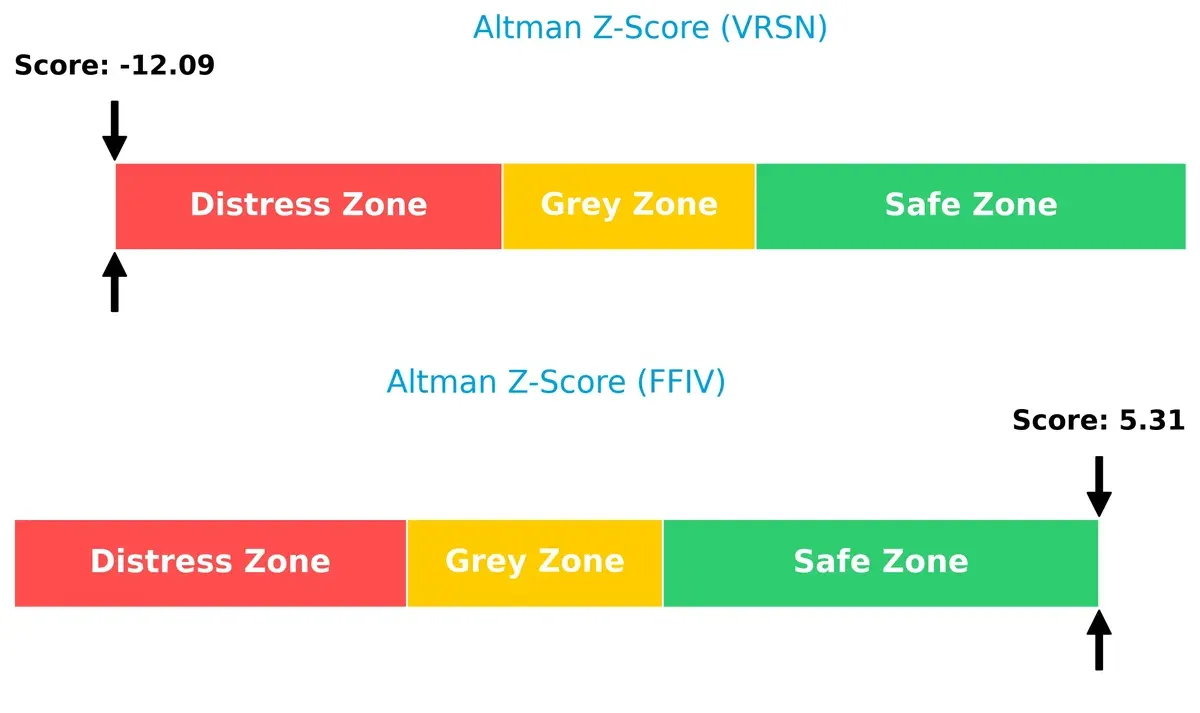
F5, Inc.’s strong score of 5.3 places it securely in the safe zone, indicating robust solvency and low bankruptcy risk. VeriSign, Inc. faces distress with a deeply negative score of -12.1, warning of critical financial instability and heightened risk amid economic headwinds.
Financial Health: Quality of Operations
Piotroski F-Scores highlight operational quality and internal financial health:
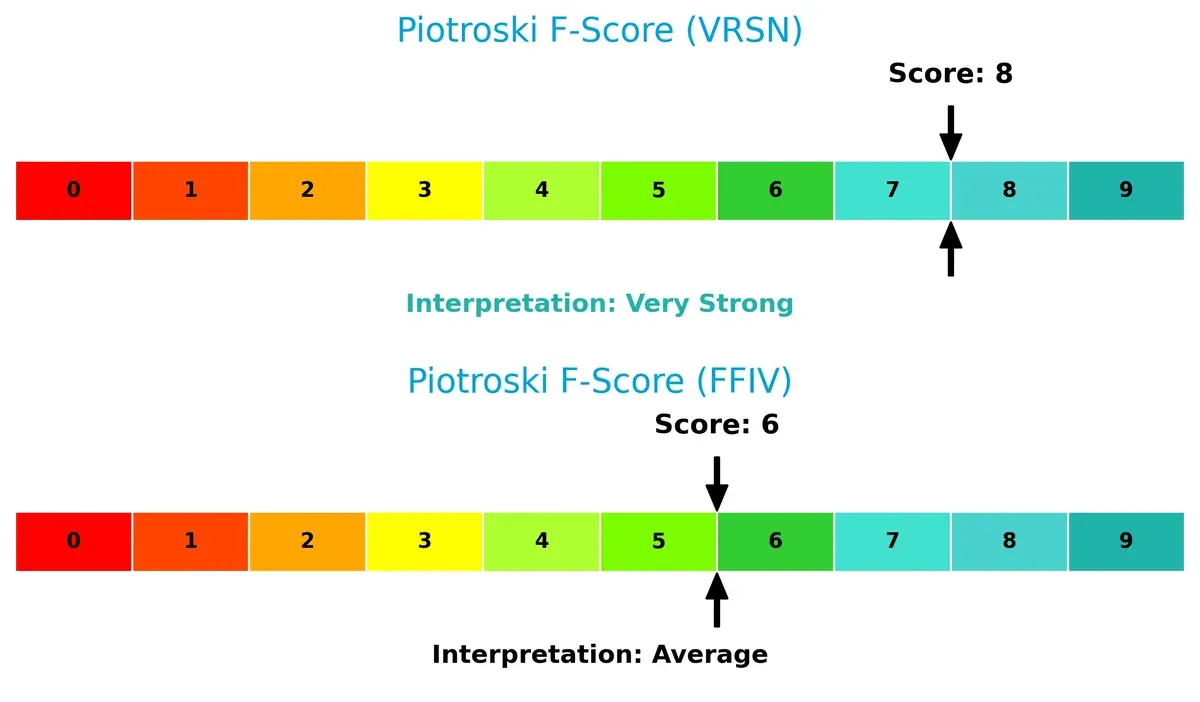
VeriSign scores an impressive 8, signaling very strong financial health and effective management of profitability, liquidity, and leverage. F5’s score of 6 is average, suggesting room for improvement in operational efficiencies. VeriSign’s high score contrasts with its solvency risk, indicating nuanced financial dynamics investors must monitor closely.
How are the two companies positioned?
This section dissects VeriSign and F5’s operational DNA by comparing their revenue distribution and internal strengths and weaknesses. The goal: confront their economic moats to reveal which model offers the most resilient, sustainable competitive advantage today.
Revenue Segmentation: The Strategic Mix
This visual comparison dissects how VeriSign, Inc. and F5, Inc. diversify their income streams and where their primary sector bets lie:
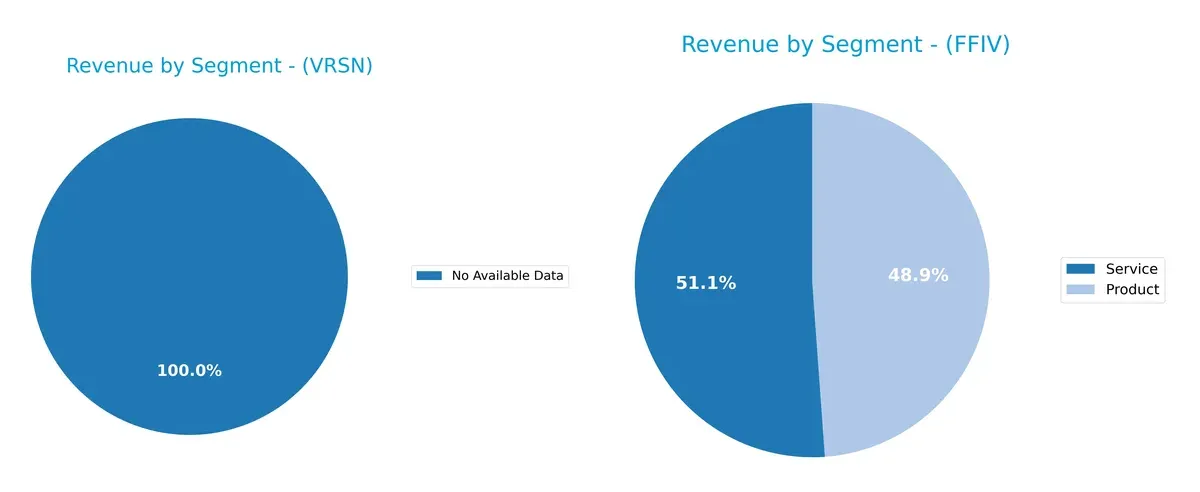
VeriSign lacks available segment data, making analysis impossible. F5, Inc. balances revenue between Products (~1.5B) and Services (~1.6B) in 2025. This near-equal split diversifies risk and supports ecosystem lock-in through recurring service contracts and hardware sales. F5’s mix contrasts sharply with VeriSign’s unknown profile, highlighting F5’s strategic pivot towards steady service growth alongside product sales.
Strengths and Weaknesses Comparison
This table compares the Strengths and Weaknesses of VeriSign, Inc. and F5, Inc.:
VeriSign Strengths
- Very high net margin at 57.68%
- Favorable asset and fixed asset turnover rates
- Strong interest coverage ratio
- Favorable debt-to-equity ratio
F5 Strengths
- Favorable net margin of 22.42%
- Positive ROE and ROIC indicating profitability
- Healthy current and quick ratios above 1.5
- Low debt-to-assets ratio of 4.14%
- Strong fixed asset turnover
VeriSign Weaknesses
- Negative ROE and ROIC imply poor capital efficiency
- Current and quick ratios below 1 indicate liquidity concerns
- Extremely high debt-to-assets ratio at 265.55%
- Negative price-to-book ratio is unusual
- Dividend yield under 1% is low
F5 Weaknesses
- Higher PE ratio at 26.91 indicates expensive valuation
- Price-to-book ratio above 5 is elevated
- Asset turnover is low at 0.49
- Dividend yield is zero, offering no income
VeriSign excels in profitability margins and asset efficiency but struggles with leverage and liquidity. F5 shows balanced profitability and liquidity but faces valuation and asset utilization challenges. These contrasts highlight differing strategic focuses for each company.
The Moat Duel: Analyzing Competitive Defensibility
A structural moat is the only reliable shield protecting long-term profits from relentless competitive erosion. Let’s dissect the core moats of these two tech infrastructure firms:
VeriSign, Inc.: Domain Registry’s Intangible Asset Moat
VeriSign’s moat stems from exclusive control over .com and .net domains, an intangible asset generating stable, high margins (~69% EBIT). However, its declining ROIC signals value erosion, threatening long-term defensibility.
F5, Inc.: Multi-Cloud Security’s Growing Operational Moat
F5 leverages complex application security and delivery solutions, driving strong revenue growth and expanding margins. Its improving ROIC confirms value creation and a moat deepening through cloud partnerships and innovation.
Exclusive Registry Control vs. Expanding Cloud Security Edge
F5 possesses the wider and more sustainable moat with rising ROIC and robust growth. VeriSign’s dominance is challenged by declining profitability, leaving F5 better positioned to defend and expand market share.
Which stock offers better returns?
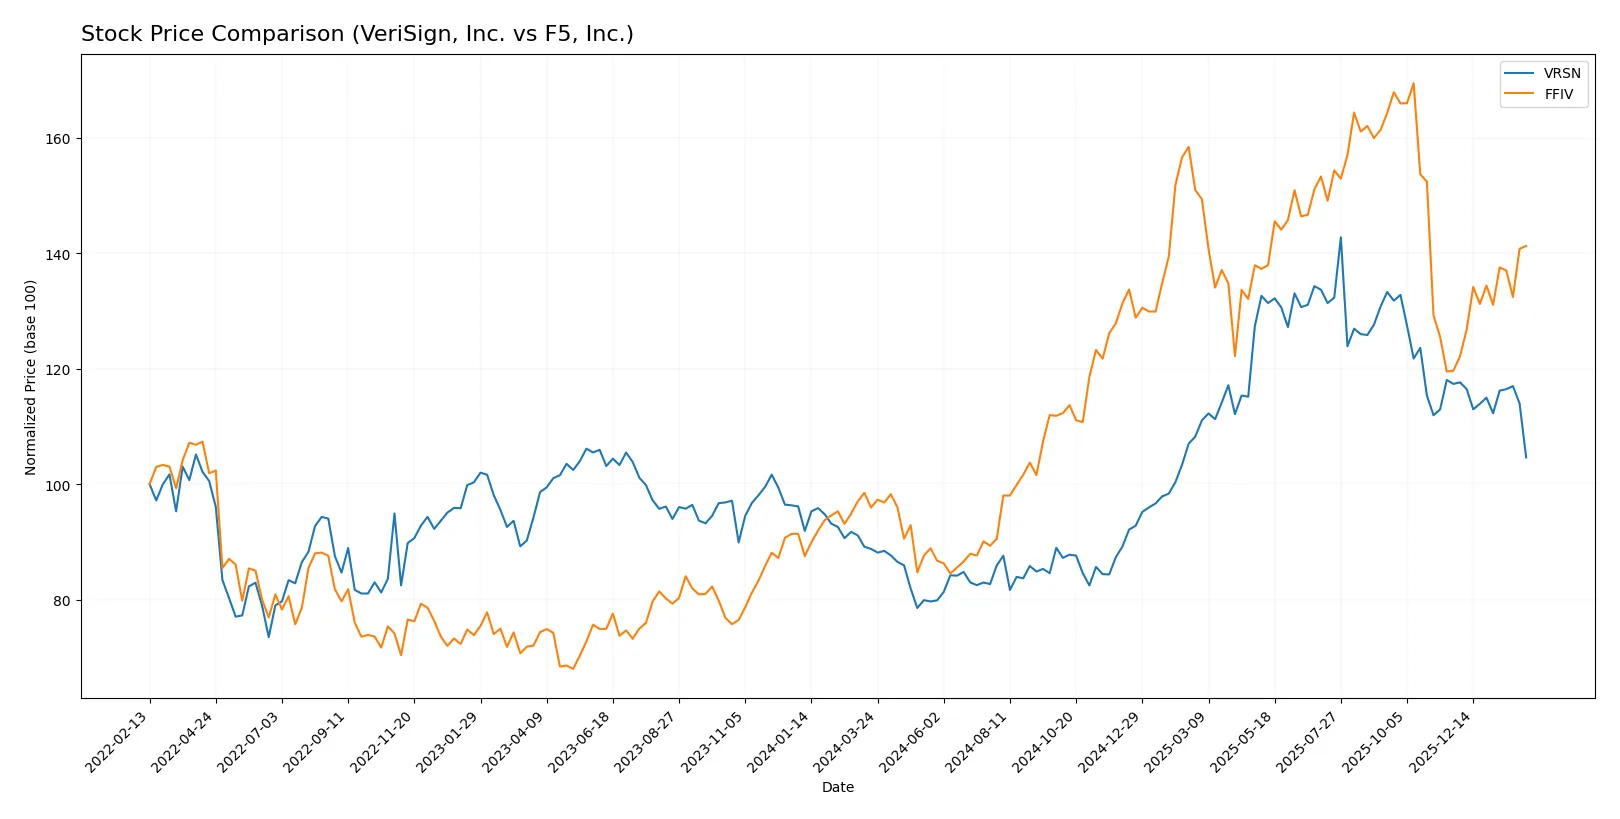
The past year reveals distinct price dynamics: VeriSign, Inc. shows a bullish trend with deceleration, while F5, Inc. accelerates sharply, reflecting contrasting momentum and volume patterns.
Trend Comparison
VeriSign, Inc. posts a 17.83% price gain over 12 months, signaling a bullish trend with deceleration and high volatility. Recent months show a -10.84% decline, indicating short-term weakness.
F5, Inc. delivers a 47.19% gain over the same period, evidencing a strong bullish trend with acceleration and higher volatility. Its recent 18.05% rally confirms sustained positive momentum.
F5, Inc. outperforms VeriSign, Inc. over 12 months with stronger gains and accelerating momentum, making it the superior market performer in this comparison.
Target Prices
Analysts present a bullish consensus for VeriSign, Inc. and F5, Inc., signaling upside potential from current prices.
| Company | Target Low | Target High | Consensus |
|---|---|---|---|
| VeriSign, Inc. | 325 | 325 | 325 |
| F5, Inc. | 295 | 352 | 331 |
VeriSign’s target price of $325 sits nearly 45% above its $224 current price, reflecting strong confidence. F5’s consensus target around $331 implies a 20% upside from its $277 price, indicating room for growth.

Don’t Let Luck Decide Your Entry Point
Optimize your entry points with our advanced ProRealTime indicators. You’ll get efficient buy signals with precise price targets for maximum performance. Start outperforming now!
How do institutions grade them?
The following tables summarize recent institutional grades for VeriSign, Inc. and F5, Inc.:
VeriSign, Inc. Grades
This table compiles recent grades and actions from major grading companies for VeriSign, Inc.
| Grading Company | Action | New Grade | Date |
|---|---|---|---|
| JP Morgan | maintain | Neutral | 2026-01-06 |
| Baird | maintain | Outperform | 2025-07-01 |
| Baird | maintain | Outperform | 2025-04-25 |
| Baird | maintain | Outperform | 2025-04-01 |
| Citigroup | maintain | Buy | 2025-02-04 |
| Citigroup | maintain | Buy | 2025-01-03 |
| Baird | upgrade | Outperform | 2024-12-09 |
| Baird | maintain | Neutral | 2024-06-27 |
| Baird | maintain | Neutral | 2024-04-26 |
| Citigroup | maintain | Buy | 2024-04-02 |
F5, Inc. Grades
This table shows recent grades and actions from recognized grading firms for F5, Inc.
| Grading Company | Action | New Grade | Date |
|---|---|---|---|
| Needham | maintain | Hold | 2026-01-28 |
| RBC Capital | maintain | Outperform | 2026-01-28 |
| Piper Sandler | maintain | Overweight | 2026-01-28 |
| Barclays | maintain | Equal Weight | 2026-01-28 |
| Goldman Sachs | maintain | Neutral | 2026-01-28 |
| JP Morgan | upgrade | Overweight | 2026-01-15 |
| Piper Sandler | upgrade | Overweight | 2026-01-05 |
| RBC Capital | upgrade | Outperform | 2026-01-05 |
| Morgan Stanley | maintain | Equal Weight | 2025-12-17 |
| RBC Capital | maintain | Sector Perform | 2025-10-28 |
Which company has the best grades?
F5, Inc. generally receives stronger and more consistent “Outperform” and “Overweight” ratings than VeriSign, Inc. This pattern may influence investors seeking growth potential.
Risks specific to each company
The following categories identify the critical pressure points and systemic threats facing both firms in the 2026 market environment:
1. Market & Competition
VeriSign, Inc.
- Holds dominant domain registry positions but faces pressure from evolving internet protocols and alternative DNS services.
F5, Inc.
- Competes in a crowded multi-cloud security market with agile rivals and must continuously innovate to maintain market share.
2. Capital Structure & Debt
VeriSign, Inc.
- Exhibits unstable leverage with a high debt-to-assets ratio (265.55%) and weak debt-to-equity metrics, signaling financial distress.
F5, Inc.
- Maintains a conservative debt profile with low debt-to-assets (4.14%) and manageable leverage, supporting financial flexibility.
3. Stock Volatility
VeriSign, Inc.
- Beta of 0.75 indicates lower volatility than the market, offering relative stability amid sector fluctuations.
F5, Inc.
- Beta near 1.0 reveals stock moves closely with the market, implying moderate volatility and sensitivity to economic cycles.
4. Regulatory & Legal
VeriSign, Inc.
- Faces regulatory scrutiny due to critical internet infrastructure role and potential antitrust concerns.
F5, Inc.
- Subject to complex global cybersecurity regulations and compliance risks affecting product deployment and revenue.
5. Supply Chain & Operations
VeriSign, Inc.
- Operates a lean workforce with 929 employees but relies on robust, uninterrupted infrastructure for DNS services.
F5, Inc.
- Larger workforce (6,114) and diverse supply chain increase operational complexity and potential disruption risks.
6. ESG & Climate Transition
VeriSign, Inc.
- Limited disclosures on ESG initiatives may challenge stakeholder trust amid rising sustainability demands.
F5, Inc.
- Increased focus on cloud security aligns with ESG trends, but environmental impact of hardware remains a concern.
7. Geopolitical Exposure
VeriSign, Inc.
- Global internet governance ties expose it to geopolitical tensions affecting domain name system stability.
F5, Inc.
- Extensive international sales and partnerships increase exposure to trade restrictions and regional political risks.
Which company shows a better risk-adjusted profile?
F5, Inc. demonstrates a stronger risk-adjusted profile, chiefly due to superior capital structure and financial stability. VeriSign’s dominant market position is undermined by alarming leverage and distress-zone Altman Z-score, raising bankruptcy concerns. Meanwhile, F5’s safe-zone Z-score and balanced debt metrics provide resilience. The critical risk for VeriSign is its precarious capital structure; for F5, the intense competitive landscape in multi-cloud security remains key. Recent financial data reveal VeriSign’s debt-to-assets ratio exceeds 265%, a glaring red flag, while F5 sustains manageable leverage, justifying my cautious preference for F5.
Final Verdict: Which stock to choose?
VeriSign’s superpower lies in its exceptional gross and net margins, reflecting its ability to operate as a high-margin cash generator in the domain name services industry. However, its deteriorating return on invested capital signals a point of vigilance, especially regarding value creation. It fits portfolios that can tolerate operational and capital efficiency risks for aggressive growth potential.
F5’s strategic moat centers on its growing ROIC, signaling a sustainable competitive advantage with disciplined capital allocation. Its stronger balance sheet and stable liquidity position offer a safer profile compared to VeriSign. F5 suits investors seeking GARP—growth at a reasonable price—with a bias toward steady profitability and risk mitigation.
If you prioritize high-margin dominance and are comfortable with value destruction risks, VeriSign might be compelling due to its cash flow generation. However, if you seek durable competitive advantage and better financial stability, F5 outshines as the more prudent choice with improving profitability and balance sheet strength. Each scenario aligns with distinct investor risk appetites and portfolio strategies.
Disclaimer: Investment carries a risk of loss of initial capital. The past performance is not a reliable indicator of future results. Be sure to understand risks before making an investment decision.
Go Further
I encourage you to read the complete analyses of VeriSign, Inc. and F5, Inc. to enhance your investment decisions: