Home > Comparison > Technology > FFIV vs PATH
The strategic rivalry between F5, Inc. and UiPath Inc. shapes the future of the software infrastructure sector. F5, a capital-intensive leader in multi-cloud application security and delivery, contrasts sharply with UiPath, a high-growth automation platform provider emphasizing robotic process automation. This head-to-head reflects a broader clash between established enterprise resilience and innovative operational efficiency. This analysis aims to reveal which corporate trajectory offers a superior risk-adjusted return for diversified portfolios in 2026.
Table of contents
Companies Overview
F5, Inc. and UiPath Inc. stand as pivotal players in the software infrastructure landscape, shaping enterprise technology adoption.
F5, Inc.: Multi-Cloud Security and Delivery Leader
F5, Inc. dominates as a multi-cloud application security and delivery provider. It generates revenue by selling advanced hardware and software solutions that secure and optimize network applications across cloud and on-premises environments. In 2026, its strategic focus sharpened on integrating cloud-native technologies with legacy systems to enhance application performance and security for global enterprises.
UiPath Inc.: Robotic Process Automation Innovator
UiPath Inc. leads in robotic process automation (RPA) software, offering a comprehensive end-to-end platform that automates complex business processes. Its revenue stems from software licenses, support, and professional services targeting sectors like banking and healthcare. UiPath’s 2026 strategy centers on expanding AI-driven automation capabilities and simplifying user adoption through low-code development tools.
Strategic Collision: Similarities & Divergences
Both companies operate in software infrastructure but pursue distinct philosophies: F5 embraces a hardware-software hybrid model focusing on application security, while UiPath prioritizes software-only, AI-powered automation. Their competition converges on enterprise digital transformation, battling to be the backbone of modern IT operations. Investors will find F5 offers stability through established multi-cloud solutions, while UiPath presents growth potential in the evolving automation space.
Income Statement Comparison
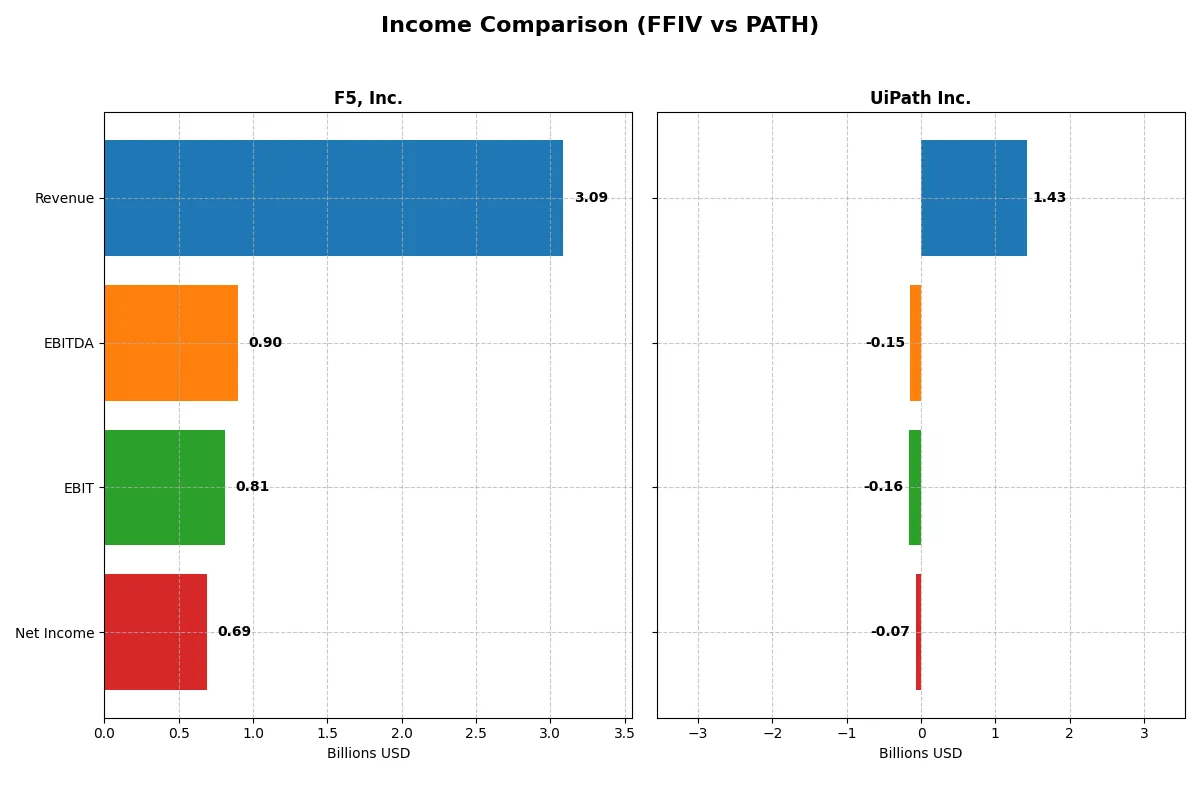
This data dissects the core profitability and scalability of both corporate engines to reveal who dominates the bottom line:
| Metric | F5, Inc. (FFIV) | UiPath Inc. (PATH) |
|---|---|---|
| Revenue | 3.09B | 1.43B |
| Cost of Revenue | 564M | 247M |
| Operating Expenses | 1.76B | 1.35B |
| Gross Profit | 2.52B | 1.18B |
| EBITDA | 901M | -145M |
| EBIT | 808M | -163M |
| Interest Expense | 0 | 0 |
| Net Income | 692M | -74M |
| EPS | 11.95 | -0.13 |
| Fiscal Year | 2025 | 2025 |
Income Statement Analysis: The Bottom-Line Duel
This income statement comparison reveals the true efficiency and profitability dynamics powering each corporate engine through recent fiscal years.
F5, Inc. Analysis
F5’s revenue climbed steadily from 2.6B in 2021 to 3.1B in 2025, with net income more than doubling to 692M. The company maintains robust gross margins above 81% and net margins exceeding 22%, signaling strong cost control and operational efficiency. In 2025, F5 accelerated net income growth by 22%, confirming sustained momentum and margin expansion.
UiPath Inc. Analysis
UiPath’s revenue surged from 607M in 2021 to 1.43B in 2025, reflecting rapid top-line expansion. However, net losses persisted, though improving from -92M in 2021 to -74M in 2025. The firm boasts a healthy gross margin near 83%, but negative EBIT and net margins indicate ongoing investment pressures. Recent years show modest profit margin improvement amid scaling operations.
Profitability Reigns vs. Growth Investment
F5 dominates with consistent profitability, expanding net margins and strong EPS growth, showcasing operational discipline. UiPath leads in revenue growth but remains unprofitable, reflecting a high-growth, high-burn profile. For investors prioritizing earnings stability, F5’s profile appears more attractive, while UiPath suits those focused on scaling potential despite current losses.
Financial Ratios Comparison
These vital ratios act as a diagnostic tool to expose the underlying fiscal health, valuation premiums, and capital efficiency of the companies analyzed:
| Ratios | F5, Inc. (FFIV) | UiPath Inc. (PATH) |
|---|---|---|
| ROE | 19.3% | -4.0% |
| ROIC | 14.0% | -7.4% |
| P/E | 26.9 | -108.0 |
| P/B | 5.19 | 4.31 |
| Current Ratio | 1.56 | 2.93 |
| Quick Ratio | 1.51 | 2.93 |
| D/E | 0.06 | 0.04 |
| Debt-to-Assets | 3.7% | 2.7% |
| Interest Coverage | N/A | N/A |
| Asset Turnover | 0.49 | 0.50 |
| Fixed Asset Turnover | 9.02 | 14.41 |
| Payout Ratio | 0% | 0% |
| Dividend Yield | 0% | 0% |
| Fiscal Year | 2025 | 2025 |
Efficiency & Valuation Duel: The Vital Signs
Ratios act as the company’s DNA, revealing hidden risks and operational excellence that underpin sustainable shareholder value creation.
F5, Inc.
F5 shows strong profitability with a 19.3% ROE and a robust 22.4% net margin, signaling operational efficiency. However, its P/E ratio of 26.9 suggests a stretched valuation compared to sector norms. The company does not pay dividends but reinvests heavily in R&D, supporting long-term growth and shareholder returns through innovation.
UiPath Inc.
UiPath suffers from negative profitability metrics, including a -4.0% ROE and -5.1% net margin, indicating ongoing operational challenges. Despite a negative P/E, the stock trades at a high P/B of 4.3, reflecting market doubts. The firm retains earnings for aggressive R&D investment, aiming to reverse losses rather than offer immediate returns.
Premium Valuation vs. Operational Safety
F5 offers a superior balance of profitability and manageable valuation risk, backed by strong operational metrics. UiPath’s profile suits investors tolerant of higher risk, banking on growth from reinvestment despite current losses. Risk-averse investors will likely prefer F5’s stable efficiency over UiPath’s growth-at-all-costs approach.
Which one offers the Superior Shareholder Reward?
I observe that F5, Inc. (FFIV) does not pay dividends but maintains a robust buyback program, supported by strong free cash flow of 15.7/share in 2025. UiPath Inc. (PATH) also pays no dividends and focuses on reinvestment, evident from negative net margins but steady free cash flow of 0.55/share. FFIV’s buyback intensity, supported by high operating margins (~26%), contrasts with PATH’s growth-heavy model and negative profitability. I judge FFIV’s distribution model more sustainable, offering superior total shareholder reward through consistent cash returns and capital discipline. PATH’s reinvestment bets are riskier and less proven in 2026. The verdict: FFIV leads for total return investors seeking durability and shareholder value.
Comparative Score Analysis: The Strategic Profile
The radar chart reveals the fundamental DNA and trade-offs of F5, Inc. and UiPath Inc., highlighting their financial strengths and vulnerabilities across key dimensions:
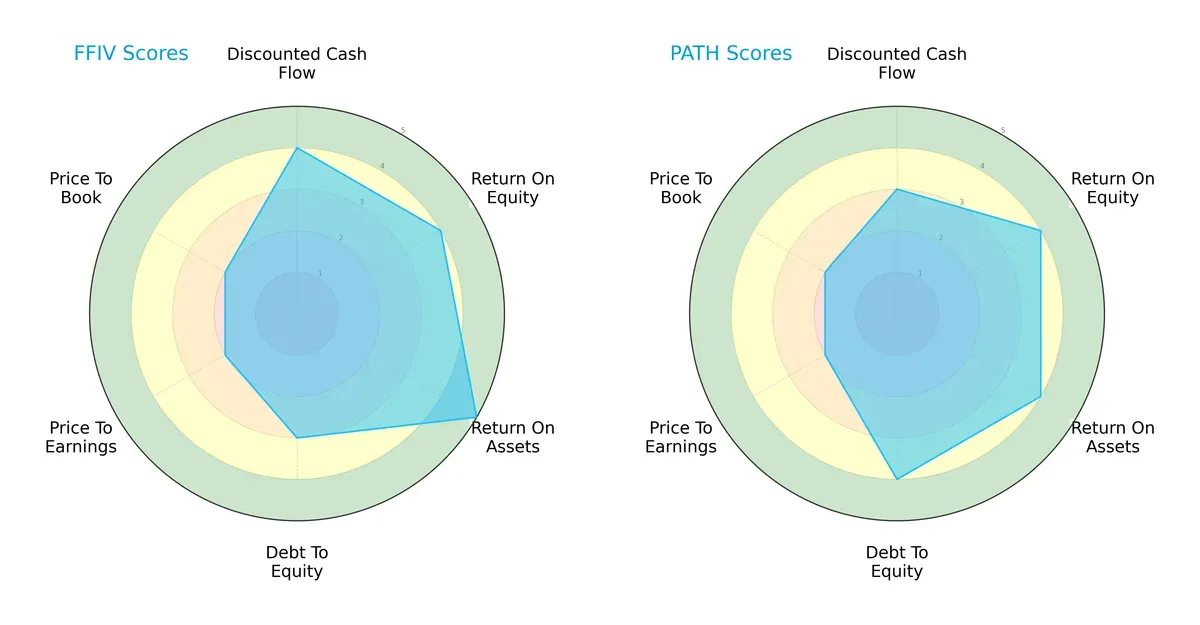
F5, Inc. excels in asset utilization (ROA score 5) and discounted cash flow (score 4), but carries moderate leverage risk (debt/equity score 3). UiPath Inc. shows a more balanced financial risk profile with better debt management (score 4) yet slightly lower cash flow strength (DCF score 3). F5’s profile leans on operational efficiency, while UiPath balances profitability with financial stability.
Bankruptcy Risk: Solvency Showdown
The Altman Z-Scores place both companies comfortably in the safe zone, indicating strong solvency and low bankruptcy risk in this economic cycle:
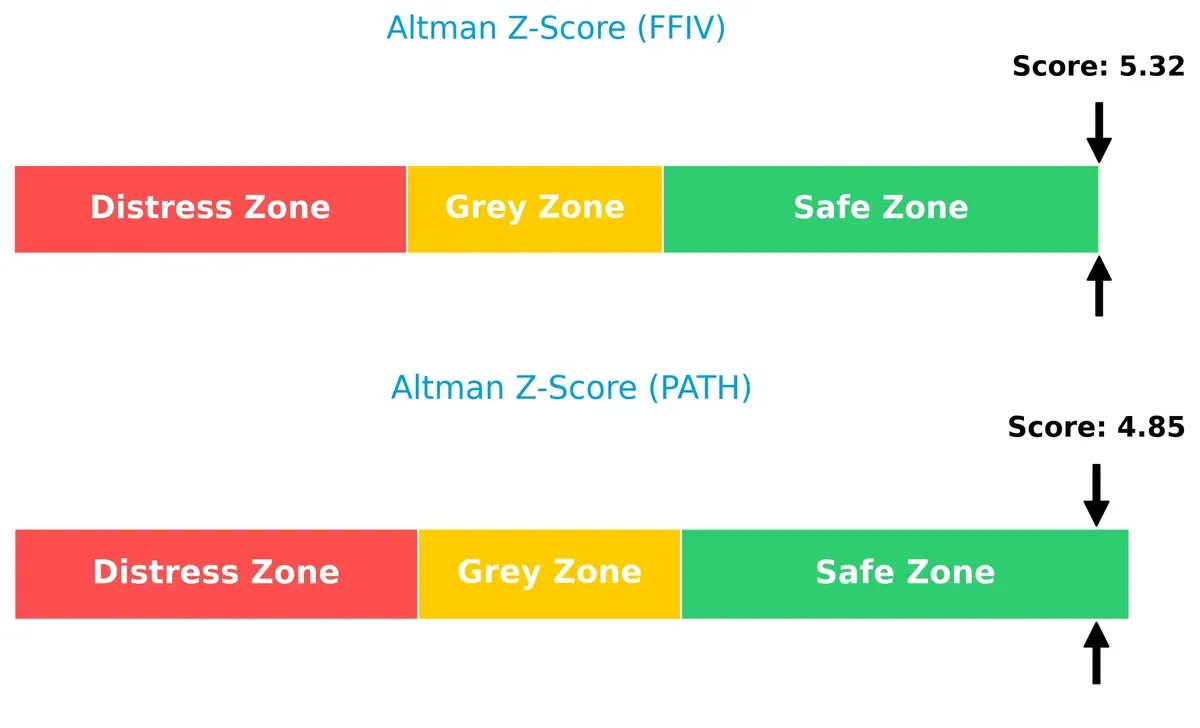
F5, Inc. scores 5.32, slightly outperforming UiPath’s 4.85, underscoring its marginally stronger buffer against financial distress.
Financial Health: Quality of Operations
Both firms earn a Piotroski F-Score of 7, signaling strong internal financial health and operational quality:
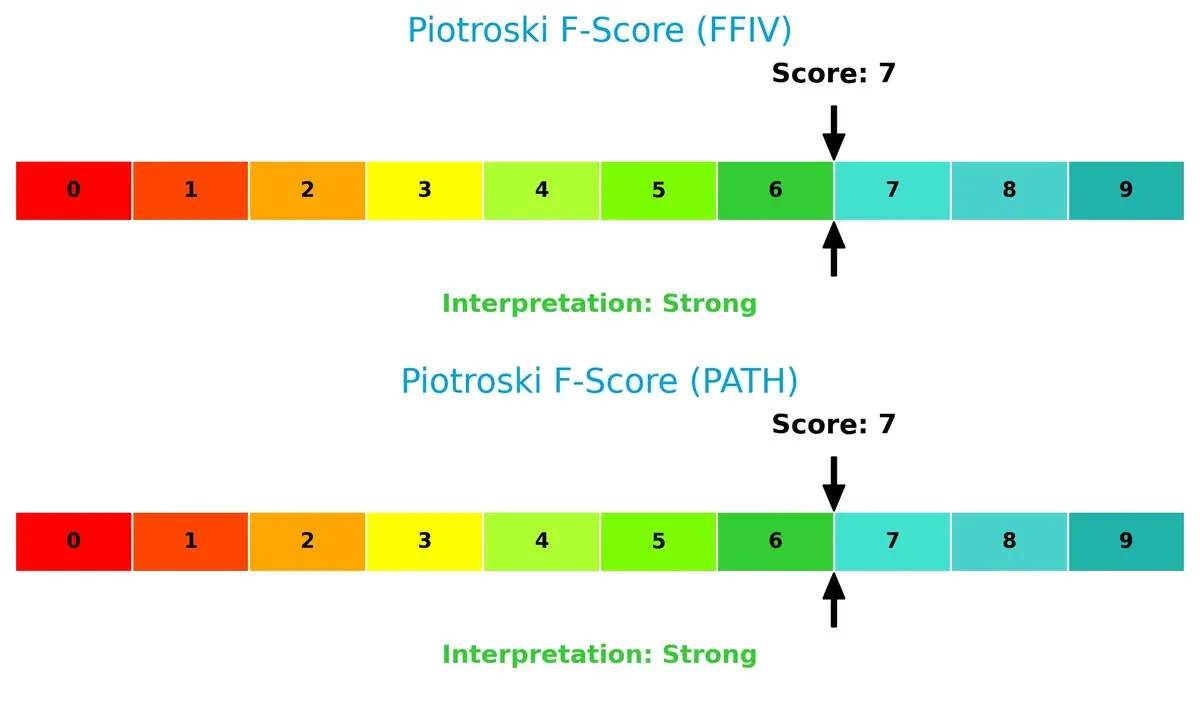
Neither company shows red flags in profitability, leverage, or liquidity metrics, suggesting robust fundamentals to support sustainable growth.
How are the two companies positioned?
This section dissects F5 and UiPath’s operational DNA by comparing their revenue distribution and internal dynamics. The goal is to confront their economic moats to identify which model delivers the most resilient competitive advantage today.
Revenue Segmentation: The Strategic Mix
This visual comparison dissects how F5, Inc. and UiPath Inc. diversify their income streams and where their primary sector bets lie:
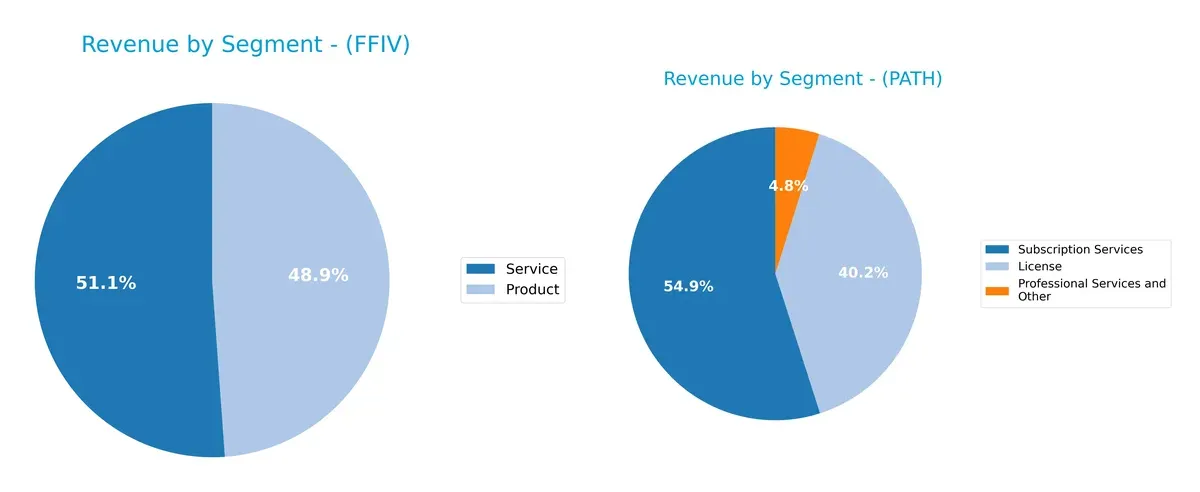
F5 anchors its revenue in a balanced mix between Product ($1.51B) and Service ($1.58B) segments, reflecting steady ecosystem lock-in. UiPath pivots revenue around Subscription Services ($802M) and License ($587M), with smaller Professional Services ($71M). UiPath’s heavier reliance on recurring subscriptions signals infrastructure dominance but exposes it to subscription churn risks. F5’s split lessens concentration risk, offering a robust buffer amid market shifts.
Strengths and Weaknesses Comparison
This table compares the Strengths and Weaknesses of F5, Inc. and UiPath Inc.:
F5, Inc. Strengths
- Balanced revenue from products (1.51B) and services (1.58B)
- Strong profitability with 22.42% net margin and 19.28% ROE
- Low debt levels with 3.65% debt-to-assets
- High current (1.56) and quick ratios (1.51) support liquidity
- Global presence with diversified sales across Americas, EMEA, Asia Pacific
UiPath Inc. Strengths
- Healthy liquidity ratios: current and quick ratio at 2.93
- Low debt-to-assets at 2.72% and low debt-to-equity (0.04)
- Growing subscription revenue (802M) complements license income (587M)
- Strong fixed asset turnover (14.41) reflects efficient asset usage
- Expanding global footprint across Americas, EMEA, Asia Pacific
F5, Inc. Weaknesses
- High P/E ratio (26.91) and price-to-book (5.19) may indicate valuation risk
- Asset turnover is low (0.49), suggesting inefficiency in asset use
- No dividend yield limits income for yield-focused investors
- Neutral WACC (8.31%) weighs on capital efficiency
UiPath Inc. Weaknesses
- Negative profitability: net margin (-5.15%), ROE (-3.99%), ROIC (-7.41%)
- Unfavorable interest coverage (0), raising solvency concerns
- Price-to-book ratio (4.31) is elevated despite losses
- Negative P/E (-108.04) reflects losses and valuation uncertainty
- Asset turnover weak (0.5), indicating inefficient asset utilization
- Zero dividend yield reduces income appeal
F5, Inc. demonstrates strong profitability and solid balance sheet metrics, supporting stable operations. UiPath shows robust liquidity and growth in subscription services but struggles with consistent profitability and solvency. Each company’s financial profile signals distinct strategic challenges and opportunities.
The Moat Duel: Analyzing Competitive Defensibility
A structural moat is the only reliable shield preserving long-term profits from relentless competitive erosion. Let’s dissect how these two firms defend their turf:
F5, Inc.: Hardware-Accelerated Application Security Moat
F5’s moat stems from its cost advantage embedded in proprietary hardware-software integration. Its 26% EBIT margin and 5.7% ROIC premium over WACC confirm strong value creation. Expansion into multi-cloud markets in 2026 should deepen this moat.
UiPath Inc.: Software Platform Network Effects Moat
UiPath’s moat relies on network effects from its RPA ecosystem, contrasting F5’s hardware edge. Despite value destruction (ROIC below WACC), improving margins and 65% ROIC growth signal a maturing moat. Scaling AI-driven automation could disrupt markets further.
Moat Battle: Cost Leadership vs. Network Effects
F5 commands a deeper, more durable moat with robust profitability and value creation. UiPath shows promise but still struggles to monetize growth efficiently. F5 is better positioned to defend and expand its market share in 2026.
Which stock offers better returns?
Over the past year, F5, Inc. surged sharply with accelerating gains, while UiPath Inc. faced a steady decline, reflecting contrasting momentum and investor sentiment.
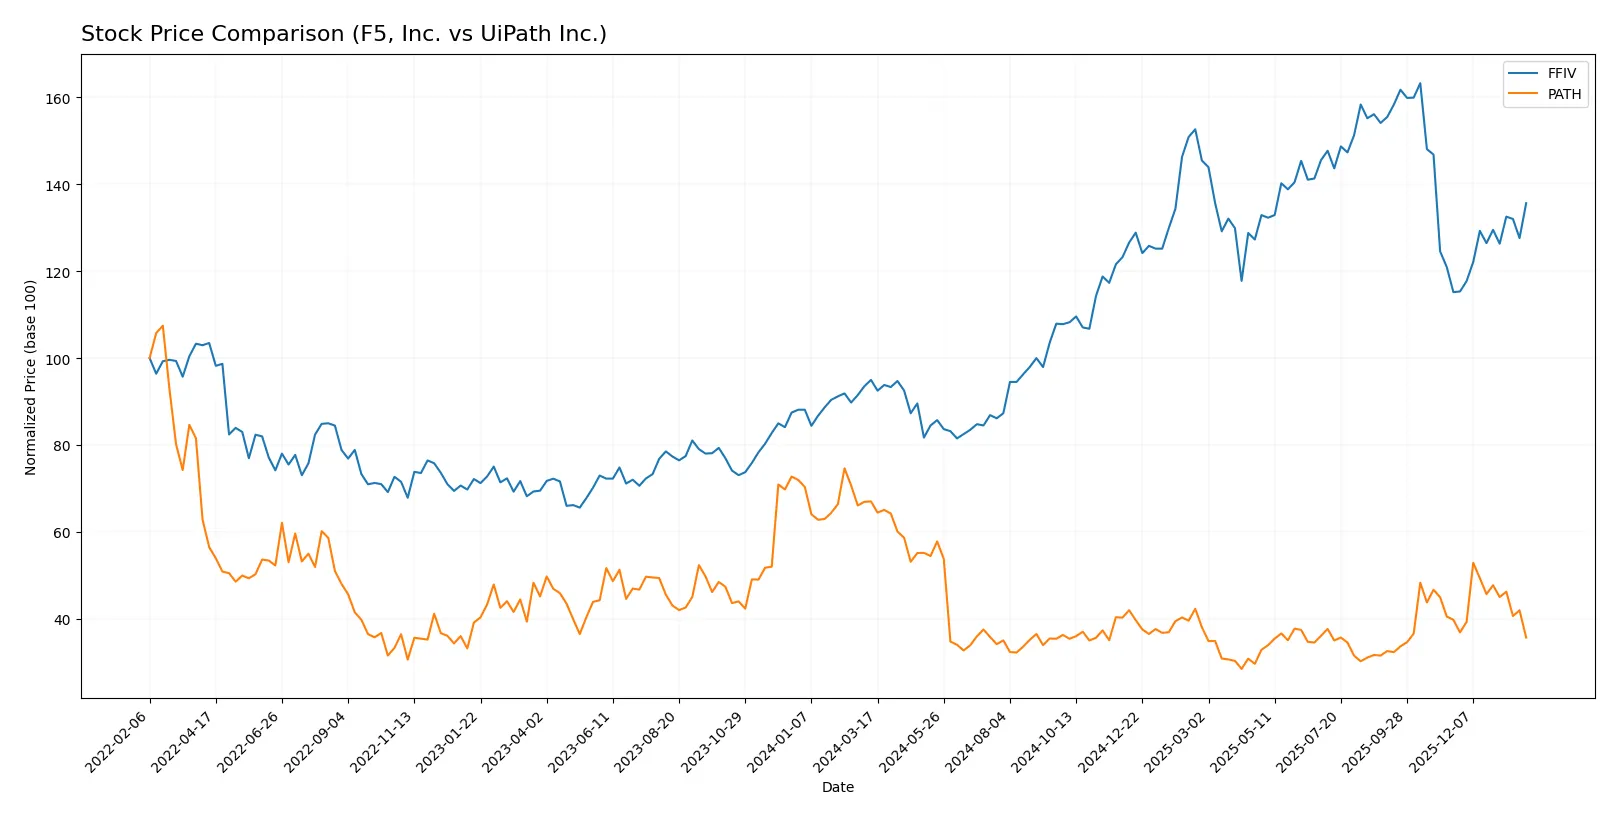
Trend Comparison
F5, Inc. shows a strong bullish trend with a 42.85% rise in price over 12 months, marked by accelerating growth and notable volatility with a 48.51 std deviation.
UiPath Inc. exhibits a bearish trend, dropping 46.79% in price over the same period, with decelerating losses and low volatility at a 3.05 std deviation.
F5 outperformed UiPath decisively, delivering the highest market returns with a positive trend compared to UiPath’s sustained decline.
Target Prices
Analysts present a clear target consensus for both F5, Inc. and UiPath Inc.
| Company | Target Low | Target High | Consensus |
|---|---|---|---|
| F5, Inc. | 295 | 352 | 330.67 |
| UiPath Inc. | 14 | 19 | 16.6 |
The consensus targets suggest upside potential for F5, Inc., currently trading at 275.61, and for UiPath Inc., trading at 12.59, indicating analyst expectations of growth beyond current prices.

Don’t Let Luck Decide Your Entry Point
Optimize your entry points with our advanced ProRealTime indicators. You’ll get efficient buy signals with precise price targets for maximum performance. Start outperforming now!
How do institutions grade them?
F5, Inc. Grades
Here are the recent grades from key financial institutions for F5, Inc.:
| Grading Company | Action | New Grade | Date |
|---|---|---|---|
| Needham | Maintain | Hold | 2026-01-28 |
| Piper Sandler | Maintain | Overweight | 2026-01-28 |
| Goldman Sachs | Maintain | Neutral | 2026-01-28 |
| Barclays | Maintain | Equal Weight | 2026-01-28 |
| RBC Capital | Maintain | Outperform | 2026-01-28 |
| JP Morgan | Upgrade | Overweight | 2026-01-15 |
| Piper Sandler | Upgrade | Overweight | 2026-01-05 |
| RBC Capital | Upgrade | Outperform | 2026-01-05 |
| Morgan Stanley | Maintain | Equal Weight | 2025-12-17 |
| Morgan Stanley | Maintain | Equal Weight | 2025-10-28 |
UiPath Inc. Grades
The following table shows recent institutional grades for UiPath Inc.:
| Grading Company | Action | New Grade | Date |
|---|---|---|---|
| Barclays | Maintain | Equal Weight | 2026-01-12 |
| RBC Capital | Maintain | Sector Perform | 2026-01-05 |
| RBC Capital | Maintain | Sector Perform | 2025-12-10 |
| Morgan Stanley | Maintain | Equal Weight | 2025-12-09 |
| DA Davidson | Maintain | Neutral | 2025-12-05 |
| Mizuho | Maintain | Neutral | 2025-12-04 |
| Evercore ISI Group | Maintain | In Line | 2025-12-04 |
| Wells Fargo | Maintain | Equal Weight | 2025-12-04 |
| Needham | Maintain | Hold | 2025-12-04 |
| BMO Capital | Maintain | Market Perform | 2025-12-04 |
Which company has the best grades?
F5, Inc. received more upgrades and higher ratings such as Outperform and Overweight, indicating stronger institutional confidence. UiPath’s grades remain mostly Neutral or Equal Weight, suggesting a more cautious outlook. This contrast may influence investor sentiment and portfolio positioning.
Risks specific to each company
The following risk categories identify critical pressure points and systemic threats facing F5, Inc. and UiPath Inc. in the evolving 2026 market environment:
1. Market & Competition
F5, Inc.
- Established player in multi-cloud security with strong enterprise ties but faces intense competition from cloud-native rivals.
UiPath Inc.
- Rapidly growing in RPA but challenged by larger software firms entering automation and AI-enhanced workflows.
2. Capital Structure & Debt
F5, Inc.
- Low debt-to-equity (0.06) and strong interest coverage indicate conservative leverage and financial stability.
UiPath Inc.
- Similar low leverage (0.04) but zero interest coverage signals potential issues servicing debt if earnings falter.
3. Stock Volatility
F5, Inc.
- Beta near 1 (0.975) suggests stock moves with the market, implying moderate volatility.
UiPath Inc.
- Slightly higher beta (1.079) indicates greater sensitivity to market swings and higher volatility risk.
4. Regulatory & Legal
F5, Inc.
- Operates globally with exposure to data privacy and cybersecurity regulations; compliance is critical but well-managed.
UiPath Inc.
- Faces regulatory scrutiny in automation deployment and data handling across multiple jurisdictions, increasing compliance complexity.
5. Supply Chain & Operations
F5, Inc.
- Hardware component reliance entails supply chain risks, particularly for specialized appliances.
UiPath Inc.
- Software-focused model reduces physical supply chain risks but depends on cloud infrastructure stability.
6. ESG & Climate Transition
F5, Inc.
- Growing investor pressure to improve ESG disclosures and reduce carbon footprint in data centers and hardware production.
UiPath Inc.
- Faces rising expectations for ethical AI use and sustainable software development practices.
7. Geopolitical Exposure
F5, Inc.
- Global footprint risks disruptions from US-China tensions and regional conflicts affecting supply chains.
UiPath Inc.
- Exposure to US, Romania, and Japan markets subjects it to diverse geopolitical risks and regulatory environments.
Which company shows a better risk-adjusted profile?
F5’s most impactful risk lies in hardware supply chain vulnerabilities amid global geopolitical tensions. UiPath’s primary risk is its negative profitability paired with concerns over debt servicing capability. F5’s robust balance sheet and stable financial metrics provide a better risk-adjusted profile. Notably, UiPath’s negative net margin (-5.15%) and zero interest coverage highlight earnings pressure, confirming my caution on profitability risks.
Final Verdict: Which stock to choose?
F5, Inc. (FFIV) impresses with its superpower of durable value creation, driven by a strong ROIC well above its cost of capital. Its efficiency in capital allocation supports sustainable profitability. The main point of vigilance remains its relatively high valuation multiples, which could temper near-term upside. FFIV suits portfolios seeking steady, aggressive growth backed by proven fundamentals.
UiPath Inc. (PATH) offers a strategic moat anchored in innovative automation technology and rapid revenue expansion. Its solid liquidity profile adds a safety cushion compared to FFIV’s leaner balance sheet. However, PATH’s ongoing value destruction and negative margins require cautious optimism. It aligns better with investors targeting GARP—growth at a reasonable price—with patience for operational turnarounds.
If you prioritize durable profitability and efficient capital deployment, FFIV outshines as the compelling choice due to its strong economic moat and consistent earnings growth. However, if you seek high-growth potential with a focus on technological innovation and are comfortable with elevated risk, PATH offers better stability in liquidity and growth prospects despite current profitability challenges. Both scenarios demand vigilant risk management.
Disclaimer: Investment carries a risk of loss of initial capital. The past performance is not a reliable indicator of future results. Be sure to understand risks before making an investment decision.
Go Further
I encourage you to read the complete analyses of F5, Inc. and UiPath Inc. to enhance your investment decisions: