Home > Comparison > Technology > FFIV vs TDC
The strategic rivalry between F5, Inc. and Teradata Corporation shapes the evolution of the technology infrastructure sector. F5 operates as a multi-cloud application security and delivery leader, emphasizing performance and availability. Teradata specializes in connected multi-cloud data platforms, focusing on enterprise analytics and ecosystem simplification. This analysis pits F5’s security-driven model against Teradata’s data-centric approach to identify which offers superior risk-adjusted returns for diversified portfolios.
Table of contents
Companies Overview
F5, Inc. and Teradata Corporation are pivotal players in the software infrastructure sector, shaping enterprise technology landscapes.
F5, Inc.: Multi-Cloud Application Security Specialist
F5, Inc. dominates the multi-cloud application security and delivery market. Its core revenue driver is a suite of application security products and services, including BIG-IP appliances and NGINX software. In 2026, F5 focuses on enhancing multi-cloud capabilities and expanding partnerships with leading cloud providers like AWS and Azure to secure and optimize network applications globally.
Teradata Corporation: Enterprise Analytics Platform Leader
Teradata Corporation leads in connected multi-cloud data platforms tailored for enterprise analytics. Its revenue engine centers on the Teradata Vantage platform, which integrates diverse data sources to streamline analytics and cloud migration. Teradata’s 2026 strategy emphasizes ecosystem simplification and driving value through data-driven business consulting and multi-cloud support services.
Strategic Collision: Similarities & Divergences
Both companies operate in multi-cloud environments but pursue contrasting philosophies. F5 emphasizes a security-first, application delivery ecosystem, while Teradata focuses on data integration and analytics across platforms. Their primary battleground lies in providing scalable cloud solutions to large enterprises. Investors see F5 as a security infrastructure play, whereas Teradata offers exposure to enterprise data analytics transformation.
Income Statement Comparison
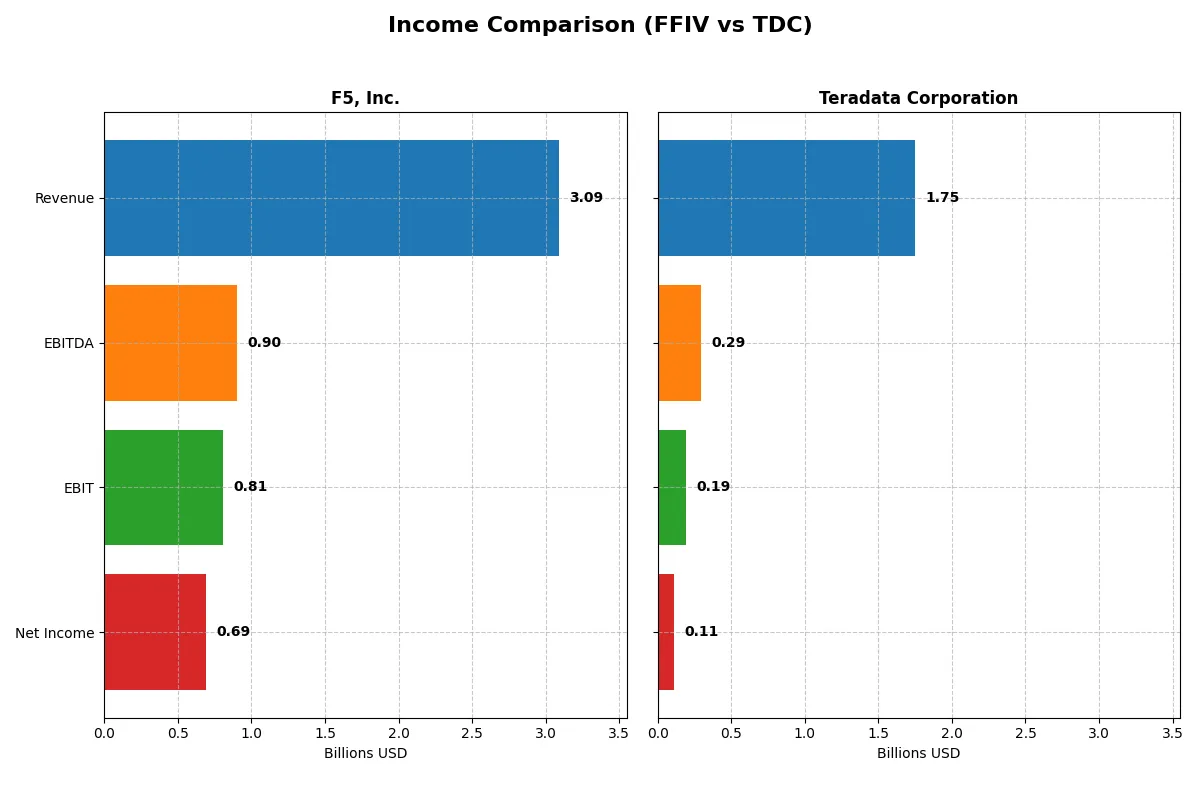
This data dissects the core profitability and scalability of both corporate engines to reveal who dominates the bottom line:
| Metric | F5, Inc. (FFIV) | Teradata Corporation (TDC) |
|---|---|---|
| Revenue | 3.09B | 1.75B |
| Cost of Revenue | 564M | 692M |
| Operating Expenses | 1.76B | 849M |
| Gross Profit | 2.52B | 1.06B |
| EBITDA | 901M | 293M |
| EBIT | 808M | 193M |
| Interest Expense | 0 | 29M |
| Net Income | 692M | 114M |
| EPS | 11.95 | 1.18 |
| Fiscal Year | 2025 | 2024 |
Income Statement Analysis: The Bottom-Line Duel
This income statement comparison reveals which company operates its business most efficiently through revenue growth and margin control.
F5, Inc. Analysis
F5 delivers a robust revenue climb from 2.6B in 2021 to 3.1B in 2025, driving net income growth from 331M to 692M. Gross margins stay strong above 81%, while net margins expand to 22.4%, signaling excellent cost management. In 2025, F5’s efficiency accelerates with 21% EBIT growth, reflecting solid operational momentum.
Teradata Corporation Analysis
Teradata’s revenue declines from 1.9B in 2021 to 1.75B in 2024, dragging net income down from 147M to 114M. Gross margin holds at a moderate 60%, but net margin remains slim at 6.5%. Despite revenue pressure, Teradata improved EBIT by 31% in 2024, showing some cost control, yet overall growth remains challenged.
Margin Leadership vs. Revenue Expansion
F5 outperforms Teradata with higher revenue growth and superior margins, doubling net income over five years. Teradata’s shrinking top line and thin net margin limit its fundamental appeal. Investors seeking sustained income growth and margin durability would find F5’s profile more attractive.
Financial Ratios Comparison
These vital ratios act as a diagnostic tool to expose the underlying fiscal health, valuation premiums, and capital efficiency of the companies analyzed below:
| Ratios | F5, Inc. (FFIV) | Teradata Corporation (TDC) |
|---|---|---|
| ROE | 19.3% | 85.7% |
| ROIC | 13.9% | 16.9% |
| P/E | 26.9 | 26.3 |
| P/B | 5.19 | 22.6 |
| Current Ratio | 1.56 | 0.81 |
| Quick Ratio | 1.51 | 0.79 |
| D/E | 0.06 | 4.33 |
| Debt-to-Assets | 3.7% | 33.8% |
| Interest Coverage | 0 | 7.21 |
| Asset Turnover | 0.49 | 1.03 |
| Fixed Asset Turnover | 9.02 | 9.07 |
| Payout ratio | 0 | 0 |
| Dividend yield | 0 | 0 |
| Fiscal Year | 2025 | 2024 |
Efficiency & Valuation Duel: The Vital Signs
Financial ratios form the company’s DNA, exposing hidden risks and operational strengths critical for investment decisions.
F5, Inc.
F5, Inc. delivers strong profitability with a 19.28% ROE and robust 22.42% net margin, signaling operational efficiency. The stock trades at a stretched 26.91 P/E and 5.19 P/B, indicating premium valuation. It offers no dividend, instead reinvesting heavily in R&D (17.48% of revenue) to fuel growth and innovation.
Teradata Corporation
Teradata posts an exceptional 85.71% ROE but a modest 6.51% net margin, reflecting high leverage and operational challenges. Valuation metrics are stretched with a 26.34 P/E and a very high 22.58 P/B ratio. The company pays no dividend, focusing capital on improving returns and managing debt, though liquidity ratios remain weak.
Premium Valuation vs. Operational Safety
F5 balances strong profitability with a favorable liquidity profile despite premium valuation. Teradata shows extraordinary ROE but risks elevated by weak current ratios and high leverage. Investors seeking operational safety may prefer F5, while those targeting aggressive capital returns might consider Teradata’s high ROE profile.
Which one offers the Superior Shareholder Reward?
F5, Inc. (FFIV) and Teradata Corporation (TDC) both skip dividends, focusing on reinvestment and buybacks. FFIV boasts zero dividend payout but maintains a robust free cash flow per share of 15.7, with buybacks intensifying total returns sustainably. TDC’s free cash flow per share is lower, around 2.9, with heavier debt and weaker cash coverage. FFIV’s capital allocation emphasizes buybacks over dividends, supporting a stronger valuation multiple (~20 EV/FCF) and operational cash flow margins. TDC’s high leverage and volatile margins impair distribution sustainability. I conclude FFIV offers superior total shareholder reward in 2026 due to healthier cash flows, disciplined buybacks, and sustainable capital structure.
Comparative Score Analysis: The Strategic Profile
The radar chart reveals the fundamental DNA and trade-offs of both firms’ financial strengths and valuation metrics:
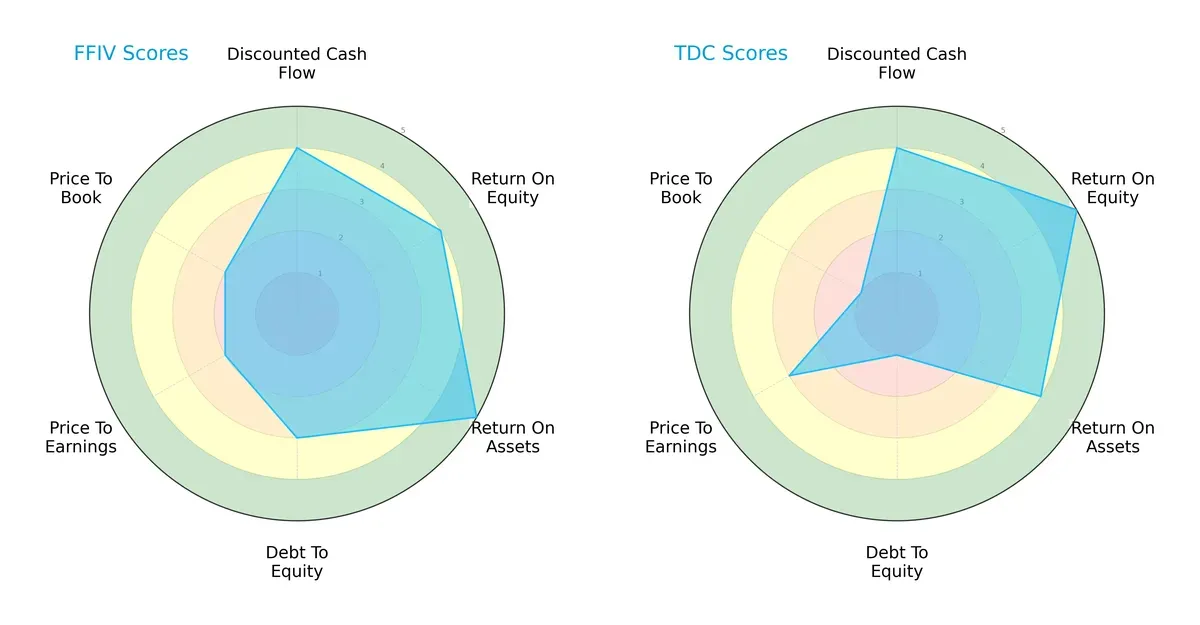
F5, Inc. (FFIV) shows a balanced profile with strong ROA (5) and moderate leverage (3), but weaker valuation scores (PE and PB at 2). Teradata Corporation (TDC) leans on superior ROE (5) and a favorable DCF score (4) but suffers severe financial risk with a very low debt-to-equity score (1) and poor price-to-book (1). FFIV’s profile is more stable, while TDC relies heavily on operational efficiency despite its riskier balance sheet.
Bankruptcy Risk: Solvency Showdown
The Altman Z-Score gap highlights diverging solvency risks in this cycle:
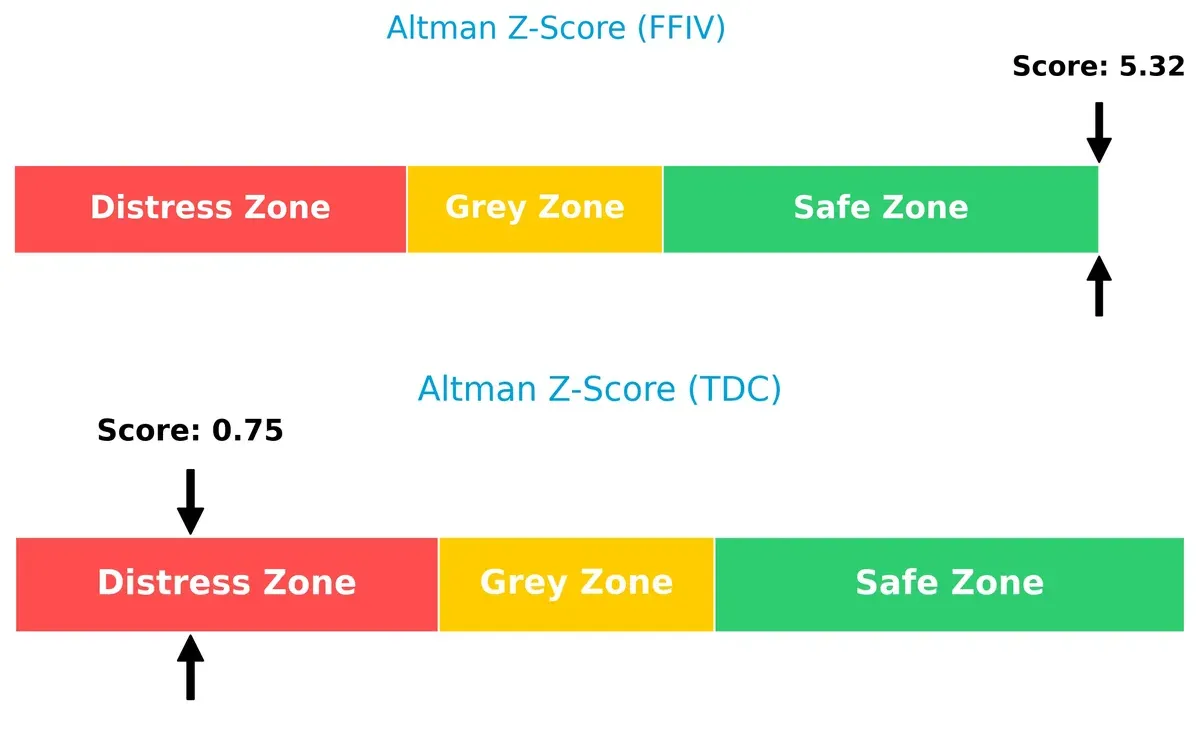
F5, Inc. scores 5.32, firmly in the safe zone, signaling strong financial health and minimal bankruptcy risk. Teradata’s 0.75 places it deep in the distress zone, warning investors of a significant default risk if market conditions worsen.
Financial Health: Quality of Operations
Piotroski F-Scores expose operational quality and internal financial discipline:
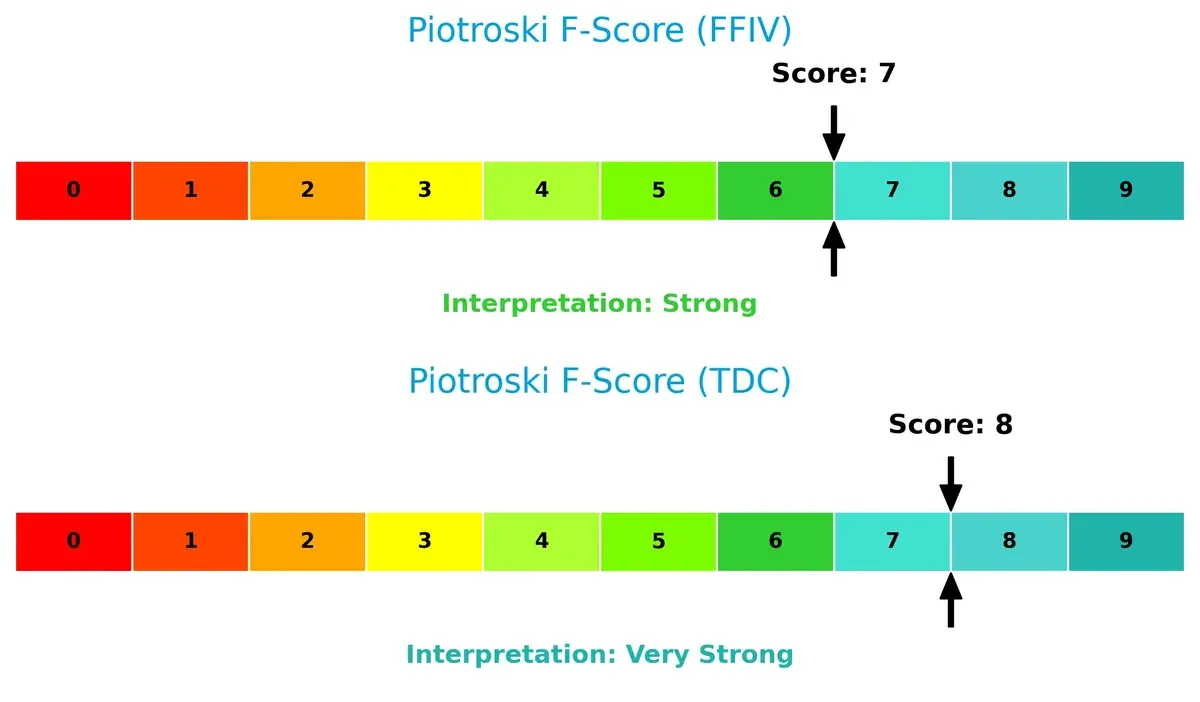
Teradata achieves a very strong 8, indicating excellent financial health and robust internal metrics. F5, Inc. scores a solid 7, still strong but slightly behind TDC. No immediate red flags appear, but FFIV’s marginally lower score suggests room to improve operational efficiency.
How are the two companies positioned?
This section dissects the operational DNA of F5 and Teradata by comparing their revenue distribution and internal dynamics. The goal is to confront their economic moats and identify which model offers the most resilient competitive advantage today.
Revenue Segmentation: The Strategic Mix
This visual comparison dissects how F5, Inc. and Teradata Corporation diversify their income streams and where their primary sector bets lie:
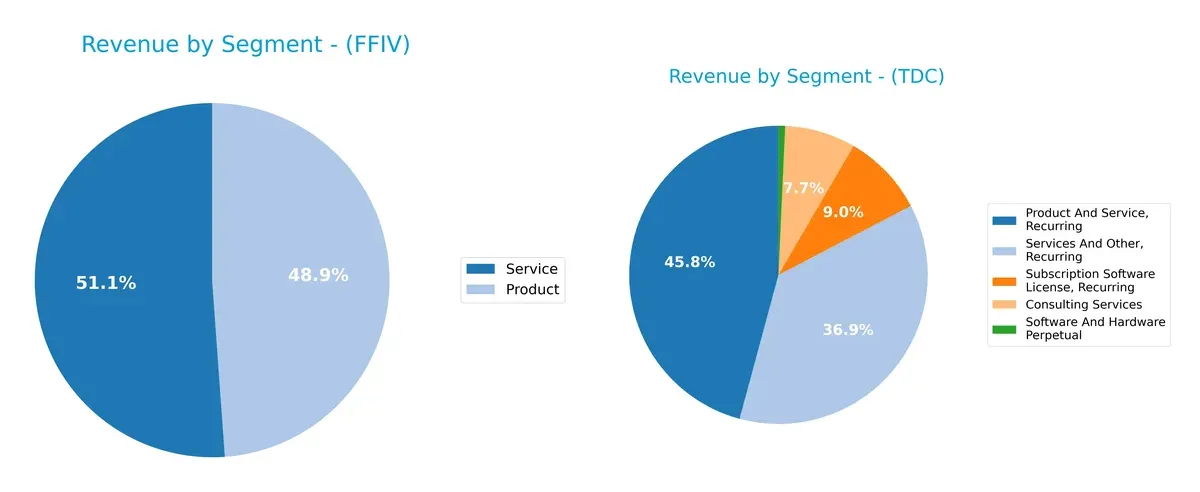
F5, Inc. balances revenue between Product ($1.51B) and Service ($1.58B), reflecting a near-equal split that anchors resilience and recurring customer engagement. Teradata leans heavily on recurring revenue streams: Product and Service Recurring ($1.48B) and Services and Other Recurring ($1.19B), while Consulting Services ($248M) adds diversification. F5’s model pivots on ecosystem lock-in via services, whereas Teradata’s mix signals infrastructure dominance but carries moderate concentration risk in recurring segments.
Strengths and Weaknesses Comparison
This table compares the Strengths and Weaknesses of F5, Inc. and Teradata Corporation:
F5, Inc. Strengths
- Strong profitability with 22.42% net margin and 19.28% ROE
- Low debt levels with 0.06 D/E and 3.65% debt to assets
- Favorable liquidity ratios: current ratio 1.56 and quick ratio 1.51
- High fixed asset turnover of 9.02 indicates efficient use of fixed assets
- Balanced revenue from products and services totaling $3.1B
- Diversified global presence with $1.82B Americas, $827M EMEA, $537M Asia Pacific
Teradata Corporation Strengths
- Very high ROE at 85.71% and solid ROIC of 16.89%
- Favorable WACC of 5.8%, supporting capital efficiency
- Strong asset turnover at 1.03 and fixed asset turnover at 9.07
- Recurring revenue streams above $2.6B enhance stability
- Global footprint with $1.01B Americas, $484M EMEA, $255M Asia Pacific
- Solid interest coverage at 6.66 supports debt servicing
F5, Inc. Weaknesses
- Elevated valuation multiples: P/E 26.91 and P/B 5.19 may pressure returns
- Asset turnover low at 0.49 suggests room for operational improvement
- Zero dividend yield limits income appeal
- Total unfavorable ratios at 28.57% indicate some financial stress points
Teradata Corporation Weaknesses
- Lower net margin at 6.51% reduces profitability cushion
- Weak liquidity with current ratio 0.81 and quick ratio 0.79 raises risk
- High debt-to-equity of 4.33 suggests leverage concerns
- Very high P/B at 22.58 implies overvaluation risk
- Dividend yield also zero limits investor income options
Both companies exhibit strengths in capital efficiency and global reach, but F5, Inc. shows stronger profitability and liquidity. Teradata’s extraordinary ROE contrasts with weaker margins and liquidity, reflecting a riskier capital structure. These dynamics shape their strategic priorities differently.
The Moat Duel: Analyzing Competitive Defensibility
A structural moat alone shields long-term profits from competition’s relentless erosion. Let’s dissect the core moats of two industry players:
F5, Inc.: Switching Costs and Integrated Security Leadership
F5’s moat stems from high switching costs tied to its multi-cloud application security suite. Its 26% EBIT margin and 22% net margin confirm durable profitability. Expansion into cloud-native markets in 2026 could deepen this advantage.
Teradata Corporation: Data Platform Ecosystem with Growing ROIC
Teradata leverages a strong multi-cloud data platform moat, distinct from F5’s product focus. Its ROIC growth of 370% signals efficient capital use. Despite recent revenue decline, Teradata’s analytics ecosystem offers expansion potential in enterprise cloud adoption.
Moat Strength Showdown: Switching Costs vs. Ecosystem Scale
Both firms boast very favorable moats with growing ROICs. Teradata’s superior ROIC spread and trend suggest a deeper moat. However, F5’s stable margins and switching costs provide a robust, immediate defense. Teradata edges ahead in long-term capital efficiency, but F5 remains well-armed to protect current market share.
Which stock offers better returns?
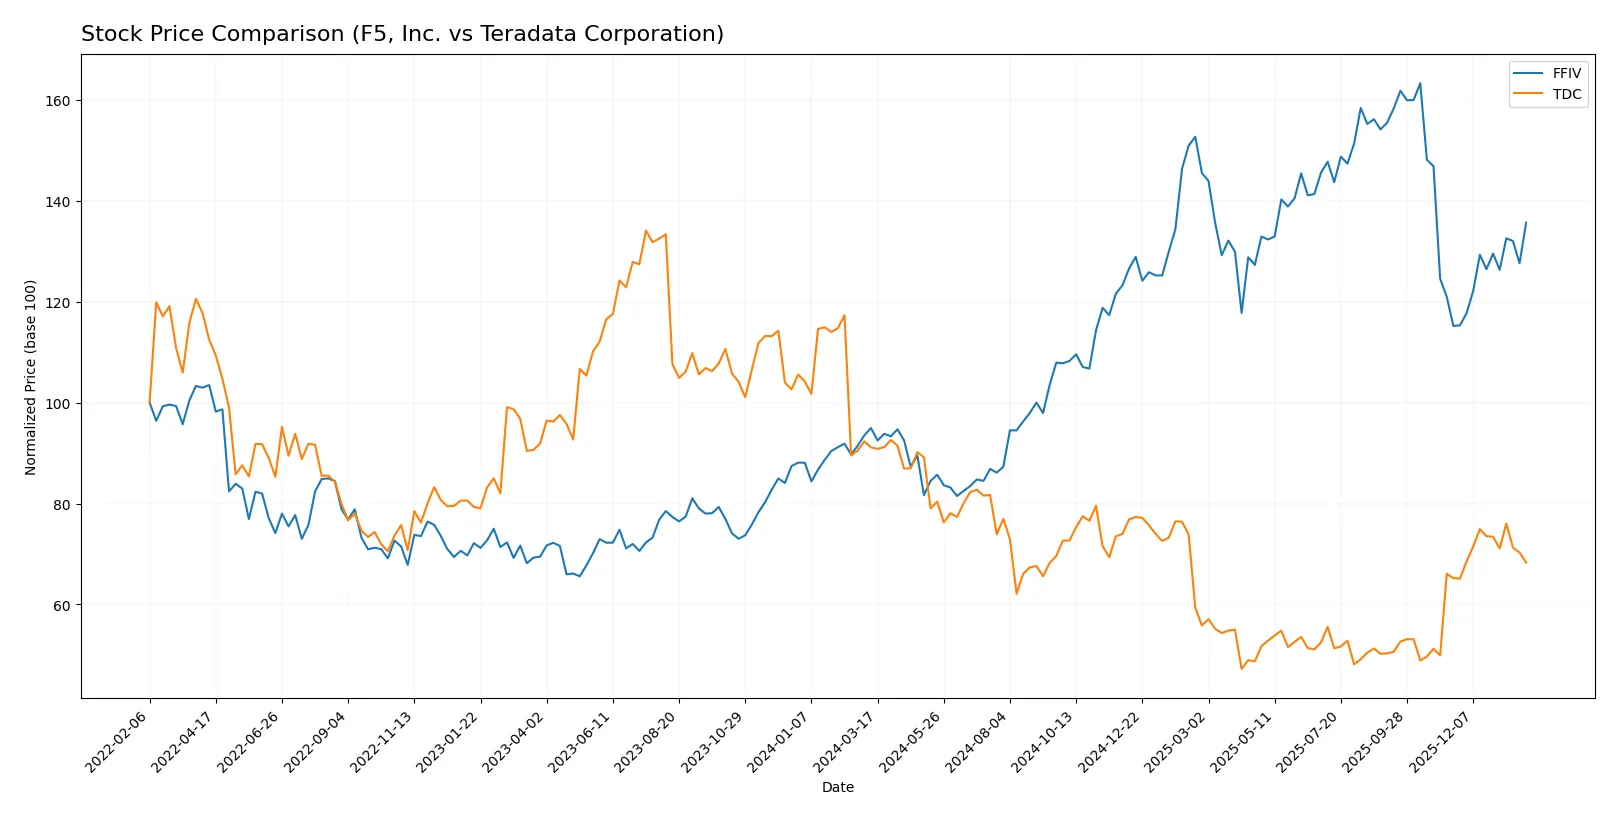
Over the past year, F5, Inc. surged sharply with accelerating gains, while Teradata Corporation faced a sustained decline despite a modest recent rebound.
Trend Comparison
F5, Inc. shows a strong bullish trend with a 42.85% price increase over 12 months and accelerating momentum. The stock peaked at 331.75 and maintained high volatility (48.51 std. dev.).
Teradata Corporation exhibits a bearish trend with a 25.07% decline over the same period, despite recent slight gains of 4.7%. The trend accelerates downward with lower volatility (5.45 std. dev.).
F5, Inc. clearly outperformed Teradata Corporation, delivering the highest market returns and stronger positive momentum during the year.
Target Prices
Analysts show a positive consensus on F5, Inc. and Teradata Corporation, suggesting upside potential from current prices.
| Company | Target Low | Target High | Consensus |
|---|---|---|---|
| F5, Inc. | 295 | 352 | 330.67 |
| Teradata Corporation | 27 | 35 | 31 |
F5, Inc.’s target consensus at 331 significantly exceeds its current price of 276, indicating strong growth expectations. Teradata’s consensus target of 31 also suggests moderate upside from the current 28.52 price.

Don’t Let Luck Decide Your Entry Point
Optimize your entry points with our advanced ProRealTime indicators. You’ll get efficient buy signals with precise price targets for maximum performance. Start outperforming now!
How do institutions grade them?
F5, Inc. Grades
Here are the latest institutional grades for F5, Inc. from major analysts:
| Grading Company | Action | New Grade | Date |
|---|---|---|---|
| Needham | Maintain | Hold | 2026-01-28 |
| Piper Sandler | Maintain | Overweight | 2026-01-28 |
| Goldman Sachs | Maintain | Neutral | 2026-01-28 |
| Barclays | Maintain | Equal Weight | 2026-01-28 |
| RBC Capital | Maintain | Outperform | 2026-01-28 |
| JP Morgan | Upgrade | Overweight | 2026-01-15 |
| Piper Sandler | Upgrade | Overweight | 2026-01-05 |
| RBC Capital | Upgrade | Outperform | 2026-01-05 |
| Morgan Stanley | Maintain | Equal Weight | 2025-12-17 |
| Morgan Stanley | Maintain | Equal Weight | 2025-10-28 |
Teradata Corporation Grades
Below is the summary of recent institutional grades for Teradata Corporation:
| Grading Company | Action | New Grade | Date |
|---|---|---|---|
| Barclays | Maintain | Underweight | 2026-01-12 |
| RBC Capital | Maintain | Sector Perform | 2026-01-05 |
| Morgan Stanley | Maintain | Overweight | 2025-12-17 |
| Citizens | Upgrade | Market Outperform | 2025-11-10 |
| Barclays | Maintain | Underweight | 2025-11-05 |
| Evercore ISI Group | Maintain | Outperform | 2025-11-05 |
| TD Cowen | Maintain | Hold | 2025-11-05 |
| UBS | Maintain | Neutral | 2025-08-06 |
| Guggenheim | Maintain | Buy | 2025-05-07 |
| Barclays | Maintain | Underweight | 2025-04-21 |
Which company has the best grades?
F5, Inc. consistently earns overweight and outperform ratings from top firms, reflecting moderate bullish sentiment. Teradata’s grades show more caution with multiple underweight and hold ratings. Investors might view F5’s stronger grades as signaling better near-term confidence.
Risks specific to each company
The following categories identify the critical pressure points and systemic threats facing both firms in the 2026 market environment:
1. Market & Competition
F5, Inc.
- Faces intense competition in multi-cloud application security with high innovation demands.
Teradata Corporation
- Competes in enterprise analytics with pressure to differentiate in a crowded multi-cloud data platform market.
2. Capital Structure & Debt
F5, Inc.
- Maintains a very conservative debt profile with a low debt-to-equity of 0.06, minimizing financial risk.
Teradata Corporation
- Exhibits high leverage with debt-to-equity at 4.33, raising concerns about balance sheet vulnerability.
3. Stock Volatility
F5, Inc.
- Beta near 1 (0.975) indicates stock moves roughly in line with market, moderate volatility.
Teradata Corporation
- Lower beta of 0.57 suggests less sensitivity to market swings, lower volatility but also potentially weaker momentum.
4. Regulatory & Legal
F5, Inc.
- Operates globally, exposed to evolving cybersecurity regulations that could increase compliance costs.
Teradata Corporation
- Faces data privacy and cloud governance regulations across diverse sectors, which may affect operational flexibility.
5. Supply Chain & Operations
F5, Inc.
- Relies on hardware and software suppliers; potential risks in component shortages or delays.
Teradata Corporation
- Primarily software and consulting services; operational risks center on talent retention and service delivery.
6. ESG & Climate Transition
F5, Inc.
- Increasing pressure to enhance sustainability in data centers and reduce carbon footprint.
Teradata Corporation
- Must balance cloud migration with energy-efficient operations to meet ESG targets amid investor scrutiny.
7. Geopolitical Exposure
F5, Inc.
- Global presence subjects it to trade tensions and export controls impacting technology sales.
Teradata Corporation
- Exposure to multinational clients and regulations could disrupt revenue streams amid geopolitical instability.
Which company shows a better risk-adjusted profile?
F5, Inc. shows a superior risk-adjusted profile. Its strongest risk is competitive pressure in a fast-evolving cloud security market. Teradata’s most impactful risk is its high leverage, reflected in a distress-zone Altman Z-Score (0.75). Meanwhile, F5’s conservative debt and strong financial health (Altman Z-Score 5.32) justify confidence despite a higher market beta.
Final Verdict: Which stock to choose?
F5, Inc. (FFIV) stands out as a cash-generating machine with a robust and expanding economic moat. Its strength lies in efficient capital allocation and consistent value creation. The main point of vigilance is its relatively high valuation multiples, which could pressure returns. FFIV fits best in an aggressive growth portfolio.
Teradata Corporation (TDC) boasts a durable strategic moat driven by impressive return on equity and capital efficiency. Its recurring revenue model offers steady cash flow, though its weaker liquidity and higher leverage pose risks compared to FFIV. TDC suits investors seeking GARP—growth at a reasonable price—with a tolerance for operational challenges.
If you prioritize scalable profitability and durable competitive advantage, F5, Inc. outshines as the compelling choice due to its strong free cash flow and growing ROIC. However, if you seek a value-oriented growth strategy with superior capital returns but accept higher financial risk, Teradata offers better stability in earnings quality. Both demand careful risk assessment aligned with investor profiles.
Disclaimer: Investment carries a risk of loss of initial capital. The past performance is not a reliable indicator of future results. Be sure to understand risks before making an investment decision.
Go Further
I encourage you to read the complete analyses of F5, Inc. and Teradata Corporation to enhance your investment decisions: