Home > Comparison > Technology > SNPS vs FFIV
The strategic rivalry between Synopsys, Inc. and F5, Inc. shapes the technology sector’s software infrastructure landscape. Synopsys operates as a capital-intensive leader in electronic design automation, while F5 focuses on high-margin multi-cloud application security and delivery. This analysis pits Synopsys’s engineering depth against F5’s cloud agility to identify which trajectory offers superior risk-adjusted returns. Investors will gain clarity on the best fit for a diversified portfolio navigating evolving digital demands.
Table of contents
Companies Overview
Synopsys and F5 command pivotal roles in the software infrastructure landscape, shaping technology’s backbone globally.
Synopsys, Inc.: Premier Electronic Design Automation Leader
Synopsys dominates the electronic design automation market, generating revenue by selling software tools for integrated circuit design and testing. Its Fusion Design Platform and Verification Continuum Platform drive innovation in chip design. In 2026, the company sharpens its focus on advancing system-on-chip (SoC) infrastructure IP and security testing solutions, reinforcing its critical role in semiconductor development.
F5, Inc.: Multi-Cloud Application Security Specialist
F5 leads in multi-cloud application security and delivery, monetizing through hardware appliances and software modules that safeguard network applications. Its portfolio includes BIG-IP and NGINX products, ensuring application performance from on-premises to cloud environments. The strategic emphasis in 2026 lies in expanding cloud-native security offerings and strengthening partnerships with major public cloud providers.
Strategic Collision: Similarities & Divergences
Both firms operate in software infrastructure but diverge in focus—Synopsys targets chip design ecosystems, while F5 secures multi-cloud application environments. Their battleground centers on enabling innovation—hardware design versus application security. This contrast creates distinct investment profiles: Synopsys invests heavily in R&D for semiconductor IP, whereas F5 prioritizes cloud integration and security scalability.
Income Statement Comparison
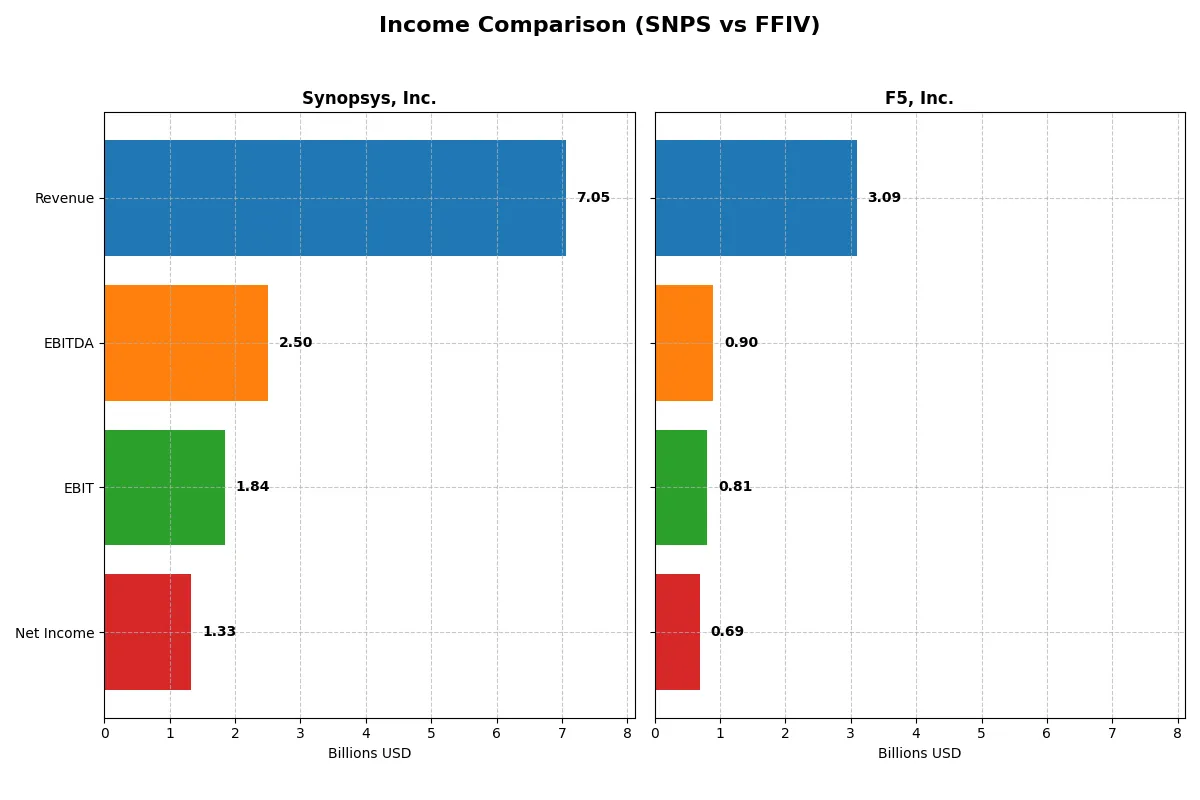
This data dissects the core profitability and scalability of both corporate engines to reveal who dominates the bottom line:
| Metric | Synopsys, Inc. (SNPS) | F5, Inc. (FFIV) |
|---|---|---|
| Revenue | 7.05B | 3.09B |
| Cost of Revenue | 1.62B | 564M |
| Operating Expenses | 4.52B | 1.76B |
| Gross Profit | 5.43B | 2.52B |
| EBITDA | 2.50B | 901M |
| EBIT | 1.84B | 808M |
| Interest Expense | 447M | 0 |
| Net Income | 1.33B | 692M |
| EPS | 8.13 | 11.95 |
| Fiscal Year | 2025 | 2025 |
Income Statement Analysis: The Bottom-Line Duel
The upcoming income statement comparison reveals which company operates its financial engine with greater efficiency and growth momentum.
Synopsys, Inc. Analysis
Synopsys grew revenue by 15% in 2025 to $7.05B, with net income at $1.33B, though down nearly 49% in margin year-over-year. Gross margin remains robust at 77%, but operating expenses grew in step with revenue, pressuring net margin to 19%. Despite a healthy EBIT margin of 26%, recent margin contraction signals caution.
F5, Inc. Analysis
F5’s revenue climbed 9.7% to $3.09B in 2025, with net income rising 22% to $692M. The firm boasts a superior gross margin of 81.7% and net margin of 22.4%, both expanding notably over the year. EBIT margin stands at 26.2%, supported by zero interest expense, reflecting disciplined cost control and strong profitability momentum.
Margin Discipline vs. Revenue Expansion
F5 outperforms Synopsys in margin expansion and net income growth despite a smaller revenue base. Synopsys delivers faster revenue growth but faces margin pressure from rising expenses. For investors, F5’s stronger margin profile and earnings momentum offer a more attractive risk-reward balance than Synopsys’s top-line expansion challenged by profitability dips.
Financial Ratios Comparison
These vital ratios act as a diagnostic tool to expose the underlying fiscal health, valuation premiums, and capital efficiency of the companies compared below:
| Ratios | Synopsys, Inc. (SNPS) | F5, Inc. (FFIV) |
|---|---|---|
| ROE | 25.17% (2024) | 19.28% (2025) |
| ROIC | 12.04% (2024) | 13.99% (2025) |
| P/E | 34.75 (2024) | 26.91 (2025) |
| P/B | 8.75 (2024) | 5.19 (2025) |
| Current Ratio | 2.44 (2024) | 1.56 (2025) |
| Quick Ratio | 2.30 (2024) | 1.51 (2025) |
| D/E | 0.08 (2024) | 0.06 (2025) |
| Debt-to-Assets | 5.24% (2024) | 3.65% (2025) |
| Interest Coverage | 36.81 (2024) | N/A |
| Asset Turnover | 0.47 (2024) | 0.49 (2025) |
| Fixed Asset Turnover | 5.43 (2024) | 9.02 (2025) |
| Payout ratio | 0% (2024) | 0% (2025) |
| Dividend yield | 0% (2024) | 0% (2025) |
| Fiscal Year | 2024 | 2025 |
Efficiency & Valuation Duel: The Vital Signs
Ratios act as a company’s DNA, uncovering hidden risks and operational strengths that numbers alone cannot reveal.
Synopsys, Inc.
Synopsys posts a mixed profitability picture with a low ROE at 4.7% despite a solid net margin of 18.9%. Its P/E ratio of 54.6 signals an expensive stock, stretched beyond typical valuations. The company avoids dividends, channeling funds aggressively into R&D, reflecting a growth-focused reinvestment strategy.
F5, Inc.
F5 shows robust profitability, boasting a 19.3% ROE and a superior 22.4% net margin, delivering operational efficiency. Its P/E of 26.9, though lower than Synopsys, still appears elevated relative to the sector. F5 does not pay dividends, indicating a reinvestment approach likely aimed at sustaining growth and innovation.
Valuation Stretch vs. Operational Strength
F5 offers a more favorable profitability and balance sheet profile, with a healthier mix of favorable ratios. Synopsys’s high valuation and weak ROE raise caution. Investors seeking operational strength may lean toward F5, while those betting on long-term innovation might study Synopsys’s growth investments more closely.
Which one offers the Superior Shareholder Reward?
I see both Synopsys (SNPS) and F5 (FFIV) pay no dividends, channeling cash flow into growth and buybacks. Synopsys sports a stronger free cash flow per share (~8.4 vs. 15.7 for FFIV), but F5’s robust buyback program and lower valuation multiples (P/E ~27 vs. SNPS ~35) enhance shareholder returns. I favor F5’s balanced approach, combining aggressive buybacks with sustainable margins and a leaner capital structure. This makes F5, Inc. the superior total return candidate in 2026.
Comparative Score Analysis: The Strategic Profile
The radar chart reveals the fundamental DNA and trade-offs of Synopsys, Inc. and F5, Inc., highlighting their financial strengths and valuation nuances:
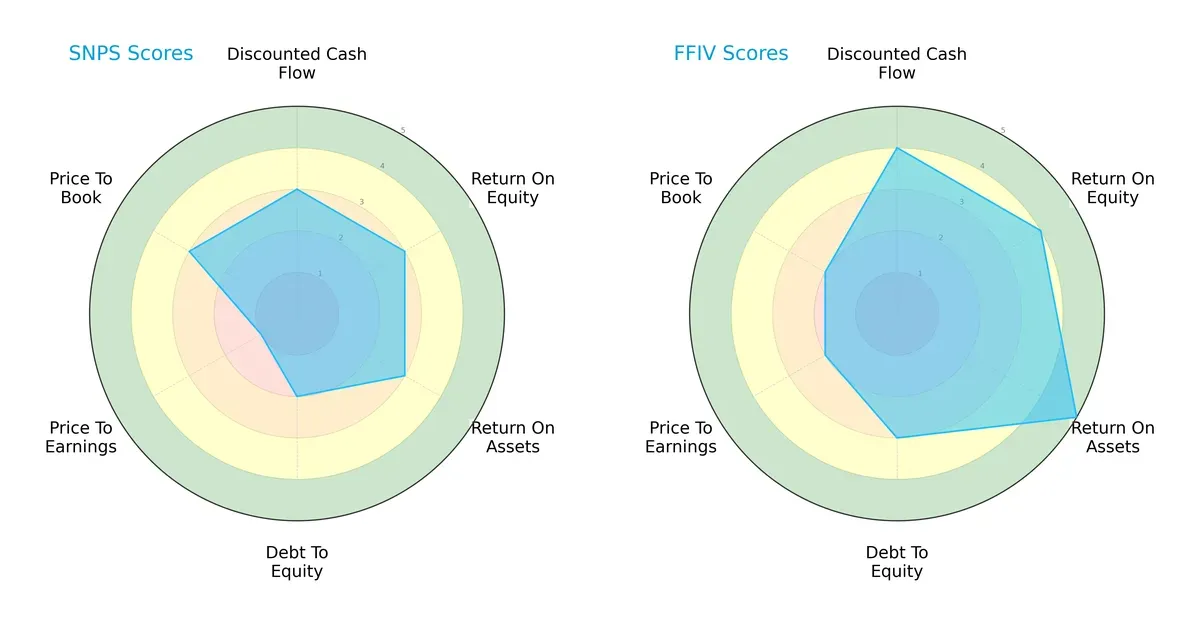
F5, Inc. demonstrates a more balanced profile with stronger scores in DCF (4 vs. 3), ROE (4 vs. 3), and ROA (5 vs. 3), indicating superior profitability and asset utilization. Synopsys shows weakness in valuation metrics, especially P/E (1 vs. 2), signaling potential overvaluation risks. F5’s moderate debt-to-equity score (3 vs. 2) suggests a healthier balance sheet. Overall, F5 relies on a broad operational advantage, while Synopsys leans on selective strengths but faces valuation challenges.
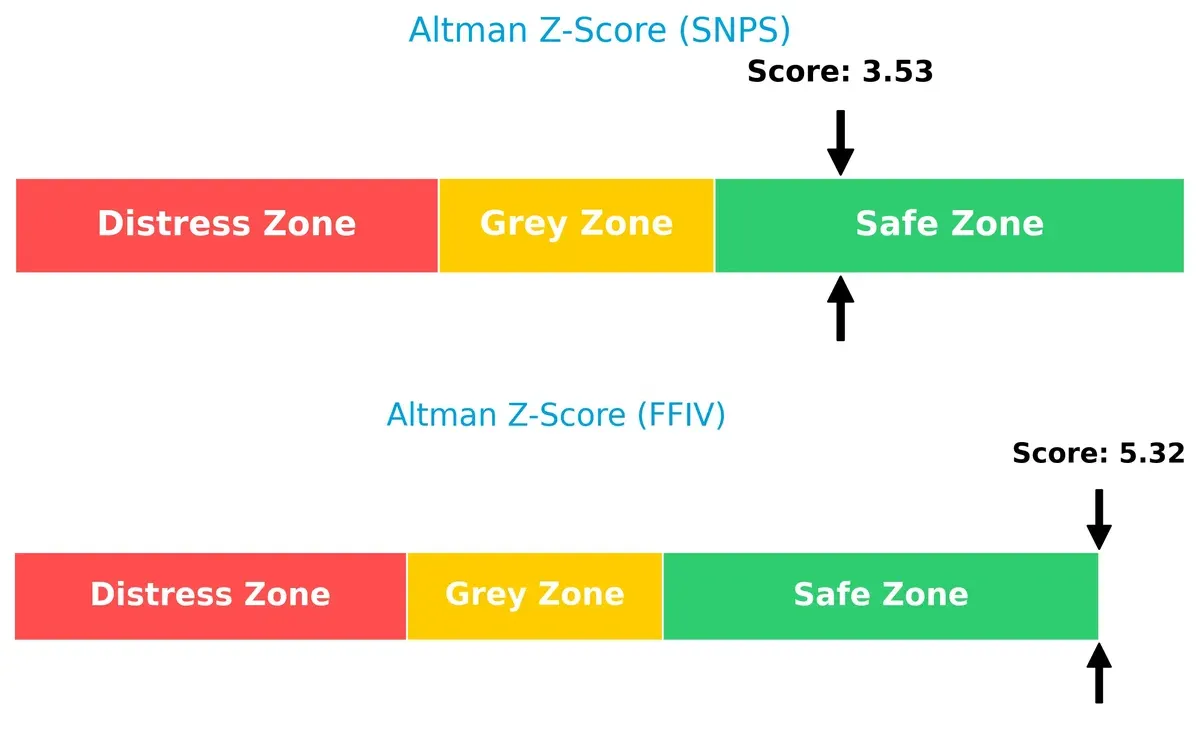
Bankruptcy Risk: Solvency Showdown
F5’s Altman Z-Score of 5.32 significantly exceeds Synopsys’s 3.53, placing both firms safely above distress thresholds but highlighting F5’s stronger solvency margin in this cycle:
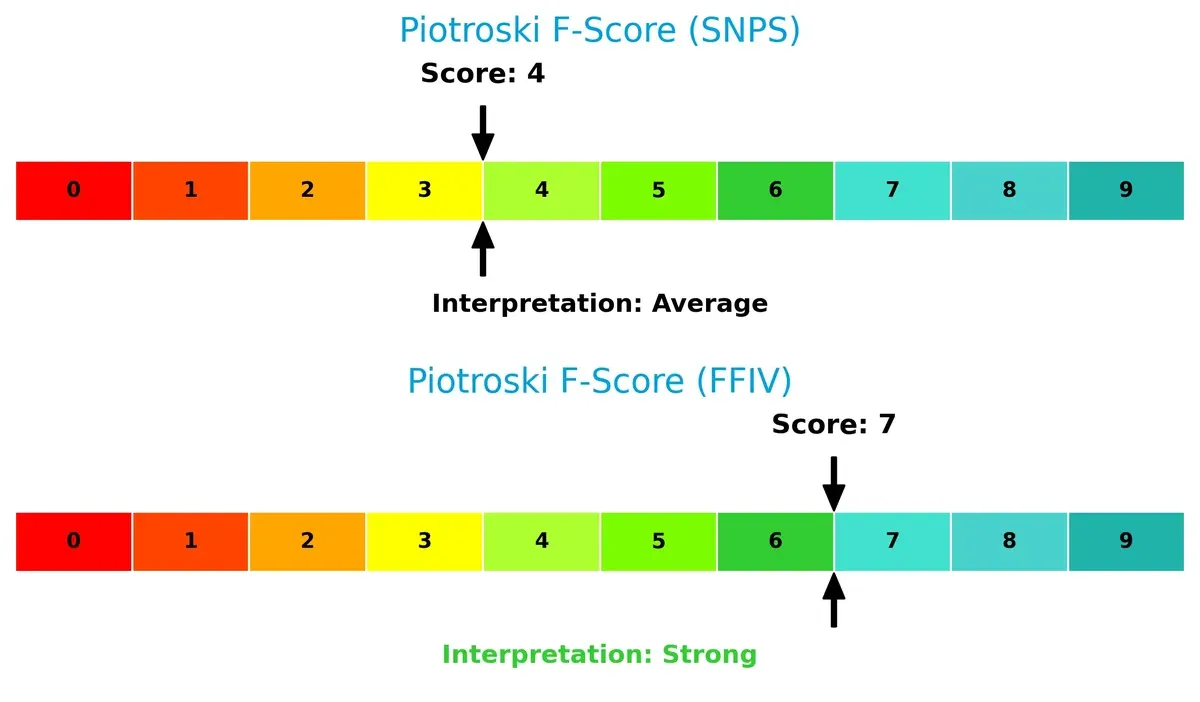
Financial Health: Quality of Operations
F5’s Piotroski F-Score of 7 indicates robust financial health, outperforming Synopsys’s average score of 4. This gap suggests Synopsys might face internal operational or liquidity weaknesses compared to F5’s more solid fundamentals:
How are the two companies positioned?
This section dissects the operational DNA of Synopsys and F5 by comparing their revenue distribution and internal strengths and weaknesses. The goal is to confront their economic moats to reveal which business model delivers the most resilient, sustainable competitive advantage today.
Revenue Segmentation: The Strategic Mix
The following visual comparison dissects how Synopsys, Inc. and F5, Inc. diversify their income streams and where their primary sector bets lie:
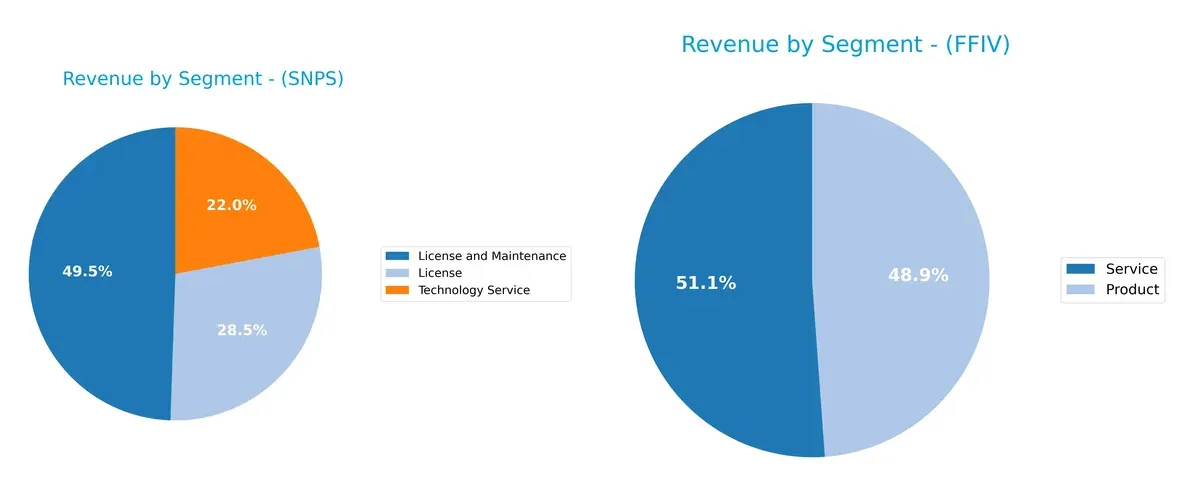
Synopsys leans heavily on “License and Maintenance” at $3.49B and “Technology Service” at $1.55B, showing moderate diversification. F5 balances between “Product” at $1.51B and “Service” at $1.58B, revealing a more even revenue split. Synopsys’s concentration suggests reliance on recurring license income, while F5’s dual focus reduces dependency risk and supports infrastructure service resilience.
Strengths and Weaknesses Comparison
This table compares the Strengths and Weaknesses of Synopsys, Inc. and F5, Inc.:
Synopsys Strengths
- Diverse revenue from license, maintenance, and technology services
- Strong current and quick ratios indicate solid liquidity
- Favorable debt to assets ratio supports financial stability
- Consistent revenue from the US and Asia markets
F5 Strengths
- Higher net margin, ROE, and ROIC show strong profitability
- Excellent debt metrics and infinite interest coverage reduce financial risk
- Balanced product and service revenue streams
- Solid global presence in Americas, Asia Pacific, and EMEA
Synopsys Weaknesses
- Low ROE and ROIC below WACC suggest weak capital efficiency
- High P/E ratio may indicate overvaluation risk
- Unfavorable asset turnover points to low operational efficiency
- No dividend yield may deter income-focused investors
F5 Weaknesses
- Unfavorable P/B ratio hints at possible overvaluation
- Asset turnover remains below ideal levels
- Zero dividend yield limits income appeal
Both companies show solid liquidity and diversified revenues. F5’s profitability and capital efficiency metrics outperform Synopsys, but both face valuation and operational efficiency challenges. These strengths and weaknesses shape their strategic focus on improving returns and managing market expectations.
The Moat Duel: Analyzing Competitive Defensibility
A structural moat protects long-term profits from relentless competition erosion. Here’s how Synopsys and F5 defend their turf:
Synopsys, Inc.: Intangible Assets and IP Fortress
Synopsys relies on deep intangible assets, including proprietary electronic design automation software and IP blocks. This strength shows in high gross margins (~77%) but declining ROIC signals weakening moat durability in 2026.
F5, Inc.: Operational Excellence and Growing ROIC
F5’s moat stems from operational efficiency and multi-cloud security integration. Its growing ROIC (+52%) and superior net margin (22.4%) highlight a widening moat, outperforming Synopsys in value creation and resilience.
Value Creation vs. Value Destruction: Moat Quality Showdown
F5 possesses the deeper, more durable moat, demonstrated by sustained ROIC above WACC and expanding profitability. Synopsys faces value destruction with declining returns, leaving F5 better positioned to defend market share.
Which stock offers better returns?
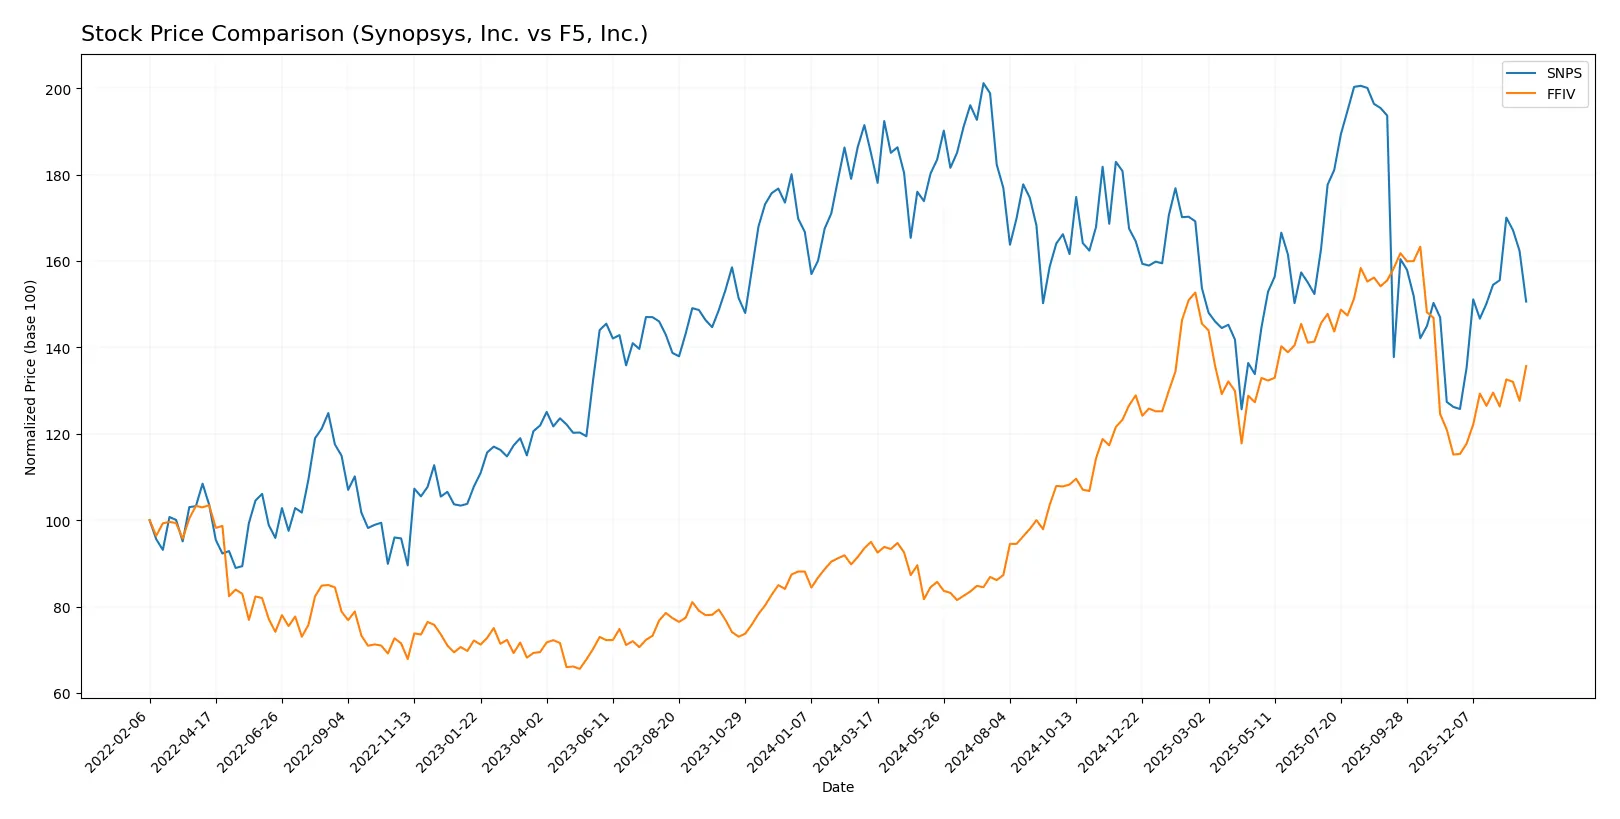
Over the past year, Synopsys, Inc. showed a significant price decline with recent recovery, while F5, Inc. sustained a strong upward trend marked by steady acceleration.
Trend Comparison
Synopsys, Inc. experienced an 18.58% price decline over the past year, reflecting a bearish trend with accelerating downward momentum and high volatility between $388 and $621.
F5, Inc. posted a 42.85% price increase over the same period, demonstrating a bullish trend with accelerating gains and a trading range from $165 to $331.
F5, Inc. outperformed Synopsys, Inc., delivering the highest market returns with consistent upward momentum and stronger buyer dominance.
Target Prices
Analysts project moderate upside for these technology infrastructure firms based on current valuations and growth prospects.
| Company | Target Low | Target High | Consensus |
|---|---|---|---|
| Synopsys, Inc. | 425 | 600 | 530 |
| F5, Inc. | 295 | 352 | 331 |
Synopsys’s consensus target of 530 suggests a 14% upside from the current 465 price, reflecting confidence in its innovation moat. F5’s target near 331 implies a 20% gain, signaling optimism despite near-term volatility risks.

Don’t Let Luck Decide Your Entry Point
Optimize your entry points with our advanced ProRealTime indicators. You’ll get efficient buy signals with precise price targets for maximum performance. Start outperforming now!
How do institutions grade them?
Institutional grades for Synopsys, Inc. and F5, Inc. have been compiled from recent analyst reports:
Synopsys, Inc. Grades
The following table summarizes recent analyst grades for Synopsys, Inc.:
| Grading Company | Action | New Grade | Date |
|---|---|---|---|
| Piper Sandler | Downgrade | Neutral | 2026-01-13 |
| Morgan Stanley | Maintain | Overweight | 2025-12-12 |
| B of A Securities | Upgrade | Buy | 2025-12-11 |
| Rosenblatt | Maintain | Buy | 2025-12-11 |
| Piper Sandler | Maintain | Overweight | 2025-12-11 |
| Keybanc | Maintain | Overweight | 2025-12-11 |
| JP Morgan | Maintain | Overweight | 2025-12-11 |
| Wells Fargo | Maintain | Equal Weight | 2025-12-11 |
| Needham | Maintain | Buy | 2025-12-11 |
| Rosenblatt | Upgrade | Buy | 2025-12-09 |
F5, Inc. Grades
The following table details recent analyst grades for F5, Inc.:
| Grading Company | Action | New Grade | Date |
|---|---|---|---|
| Needham | Maintain | Hold | 2026-01-28 |
| Piper Sandler | Maintain | Overweight | 2026-01-28 |
| Goldman Sachs | Maintain | Neutral | 2026-01-28 |
| Barclays | Maintain | Equal Weight | 2026-01-28 |
| RBC Capital | Maintain | Outperform | 2026-01-28 |
| JP Morgan | Upgrade | Overweight | 2026-01-15 |
| Piper Sandler | Upgrade | Overweight | 2026-01-05 |
| RBC Capital | Upgrade | Outperform | 2026-01-05 |
| Morgan Stanley | Maintain | Equal Weight | 2025-12-17 |
| Morgan Stanley | Maintain | Equal Weight | 2025-10-28 |
Which company has the best grades?
Synopsys, Inc. has predominantly Buy and Overweight ratings, indicating stronger analyst confidence. F5, Inc. shows a mix of Outperform and Overweight but also several Hold and Equal Weight grades. Investors might perceive Synopsys as having a slightly more favorable outlook based on recent analyst assessments.
Risks specific to each company
The following categories identify critical pressure points and systemic threats facing Synopsys, Inc. and F5, Inc. in the 2026 market environment:
1. Market & Competition
Synopsys, Inc.
- Faces intense competition in electronic design automation; innovation pace pressures market share.
F5, Inc.
- Operates in multi-cloud security with rising competition from cloud-native providers and open-source platforms.
2. Capital Structure & Debt
Synopsys, Inc.
- Moderate debt-to-equity ratio of 0.5 signals balanced leverage but interest coverage is only neutral at 4.12.
F5, Inc.
- Very low debt-to-equity of 0.06 and infinite interest coverage show a conservative and strong capital structure.
3. Stock Volatility
Synopsys, Inc.
- Beta at 1.119 indicates above-market volatility, increasing risk during downturns.
F5, Inc.
- Beta at 0.975 suggests slightly below-market volatility, offering relative stability.
4. Regulatory & Legal
Synopsys, Inc.
- Exposure to global IP and export regulations; software security regulations tightening.
F5, Inc.
- Subject to multi-jurisdictional compliance, especially in cybersecurity laws and cloud data governance.
5. Supply Chain & Operations
Synopsys, Inc.
- Relies on semiconductor ecosystem health; supply constraints can delay product delivery.
F5, Inc.
- Dependent on cloud infrastructure partners; operational risks tied to third-party cloud service disruptions.
6. ESG & Climate Transition
Synopsys, Inc.
- Increasing pressure to demonstrate sustainable practices in energy-intensive chip design tools.
F5, Inc.
- Faces rising expectations for ESG disclosures and reducing carbon footprint in data center operations.
7. Geopolitical Exposure
Synopsys, Inc.
- Sensitive to US-China tech tensions impacting semiconductor IP and sales.
F5, Inc.
- Global client base exposed to geopolitical risks in Europe, Asia-Pacific, and Middle East stability.
Which company shows a better risk-adjusted profile?
F5, Inc. presents a superior risk-adjusted profile. Its low leverage, strong interest coverage, and lower market volatility reduce financial and market risks. Synopsys’s primary concern is its higher debt and market volatility amid an intensifying competitive landscape. The contrast in capital structure and beta confirms F5’s more resilient positioning in 2026.
Final Verdict: Which stock to choose?
Synopsys, Inc. (SNPS) wields unmatched efficiency in R&D investment, fueling strong revenue growth and robust gross margins. Its point of vigilance lies in declining profitability and value destruction, signaling caution. SNPS might suit aggressive growth portfolios willing to navigate cyclical pressure for potential long-term gains.
F5, Inc. (FFIV) commands a durable moat through solid returns on invested capital exceeding its cost of capital, reflecting a sustainable competitive advantage. Its conservative balance sheet and consistent cash flow offer better safety than SNPS. FFIV fits well within GARP portfolios seeking growth backed by financial stability.
If you prioritize aggressive growth and can tolerate cyclical swings, Synopsys could be the compelling choice due to its innovation leverage. However, if you seek superior stability combined with growth, F5 outshines as a value creator with a durable moat and stronger financial footing. Both present distinct analytical scenarios aligned with different investor profiles.
Disclaimer: Investment carries a risk of loss of initial capital. The past performance is not a reliable indicator of future results. Be sure to understand risks before making an investment decision.
Go Further
I encourage you to read the complete analyses of Synopsys, Inc. and F5, Inc. to enhance your investment decisions: