Home > Comparison > Technology > FFIV vs STNE
The strategic rivalry between F5, Inc. and StoneCo Ltd. shapes the infrastructure software sector’s evolution. F5 operates as a capital-intensive provider of multi-cloud application security and delivery solutions, while StoneCo focuses on fintech software for electronic commerce in Brazil. This analysis pits F5’s global enterprise scale against StoneCo’s regional growth model. I will determine which trajectory offers superior risk-adjusted returns for a diversified portfolio amid technological integration and market expansion dynamics.
Table of contents
Companies Overview
F5, Inc. and StoneCo Ltd. play pivotal roles in the software infrastructure sector with distinct market footprints.
F5, Inc.: Multi-Cloud Security and Delivery Leader
F5, Inc. dominates the multi-cloud application security and delivery market. Its core revenue stems from advanced hardware and software solutions like BIG-IP appliances and NGINX platforms. In 2026, F5 focuses strategically on enhancing multi-cloud performance and securing network applications across diverse architectures, leveraging partnerships with AWS, Azure, and Google Cloud. Its competitive advantage lies in integrated, high-performance security solutions for large enterprises.
StoneCo Ltd.: Brazilian Fintech Powerhouse
StoneCo Ltd. leads in fintech solutions for Brazil’s small and medium-sized merchants. It generates revenue through proprietary Stone Hubs and tailored payment technologies for online and in-store commerce. In 2026, StoneCo prioritizes expanding its hyper-local sales and services network to deepen market penetration. Its strength is delivering localized, scalable fintech infrastructure in an emerging market.
Strategic Collision: Similarities & Divergences
Both companies operate in software infrastructure but diverge sharply in their business philosophies. F5 pursues a broad, multi-cloud security ecosystem, while StoneCo builds a hyper-localized fintech network focused on Brazil’s commerce. The primary battleground is technology-enabled infrastructure, with F5 targeting global enterprises and StoneCo focusing on regional merchants. Their distinct profiles offer contrasting exposure to mature versus emerging market dynamics.
Income Statement Comparison
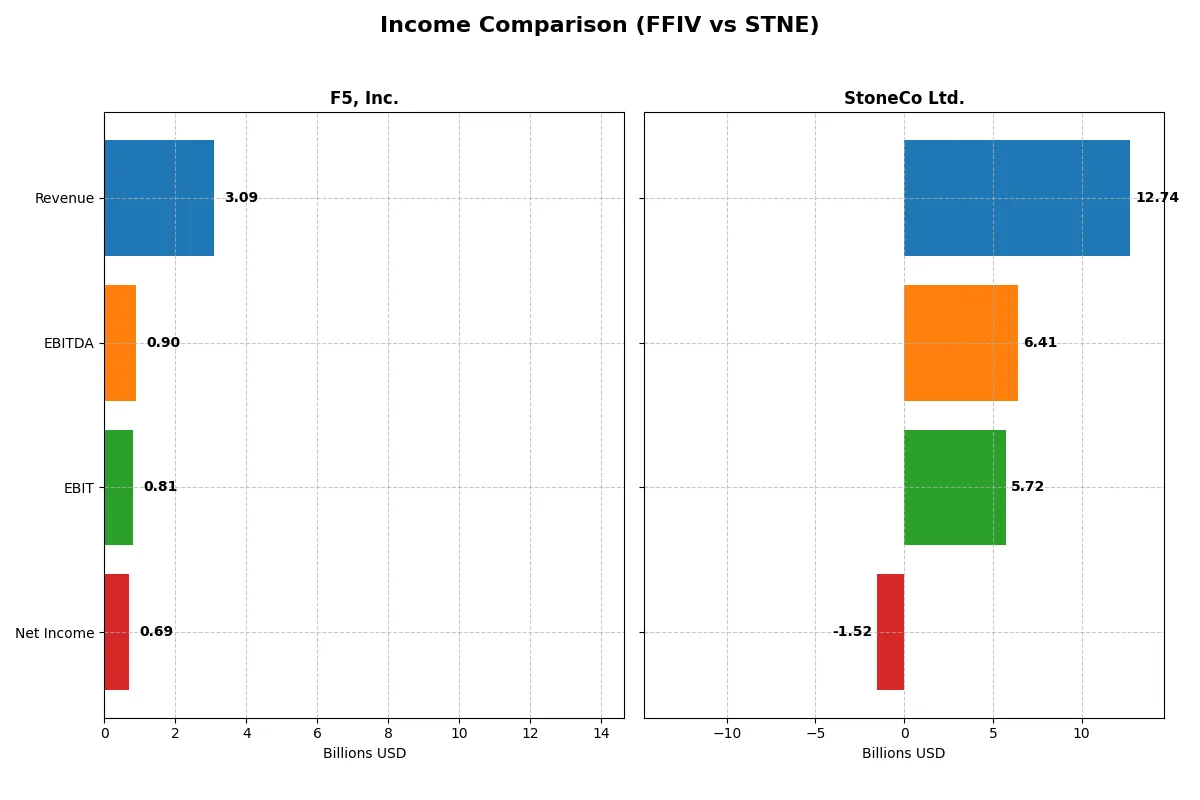
This data dissects the core profitability and scalability of both corporate engines to reveal who dominates the bottom line:
| Metric | F5, Inc. (FFIV) | StoneCo Ltd. (STNE) |
|---|---|---|
| Revenue | 3.09B USD | 12.74B BRL |
| Cost of Revenue | 564M USD | 3.39B BRL |
| Operating Expenses | 1.76B USD | 3.47B BRL |
| Gross Profit | 2.52B USD | 9.35B BRL |
| EBITDA | 901M USD | 6.41B BRL |
| EBIT | 808M USD | 5.72B BRL |
| Interest Expense | 0 USD | 1.06B BRL |
| Net Income | 692M USD | -1.52B BRL |
| EPS | 11.95 USD | -5.02 BRL |
| Fiscal Year | 2025 | 2024 |
Income Statement Analysis: The Bottom-Line Duel
This income statement comparison reveals each company’s operational efficiency and profitability through recent fiscal trends and margin dynamics.
F5, Inc. Analysis
F5, Inc. shows consistent revenue growth, reaching $3.09B in 2025, with net income climbing to $692M. The company sustains a strong gross margin of 81.7% and a net margin of 22.4%, reflecting disciplined cost control. Its 2025 results highlight robust momentum, with net income up 22% year-over-year and EPS growth surpassing 23%.
StoneCo Ltd. Analysis
StoneCo Ltd. grows revenue rapidly to BRL 12.7B in 2024, up 12% year-over-year. Despite a solid gross margin near 73.4%, the company reports a net loss of BRL -1.52B, driven by high interest expenses and negative net margins. Although EBIT margin remains high at 44.9%, net income trends and EPS sharply deteriorate, signaling profitability challenges.
Margin Strength vs. Scale Ambition
F5 delivers a clear fundamental win with consistent profitability, expanding margins, and efficient cost management. StoneCo’s impressive revenue scale contrasts with persistent bottom-line losses and negative margin trends. For investors prioritizing earnings quality and margin resilience, F5’s profile proves more attractive amid market volatility.
Financial Ratios Comparison
These vital ratios act as a diagnostic tool to expose the underlying fiscal health, valuation premiums, and capital efficiency of the companies compared below:
| Ratios | F5, Inc. (FFIV) | StoneCo Ltd. (STNE) |
|---|---|---|
| ROE | 19.3% (2025) | -12.9% (2024) |
| ROIC | 14.0% (2025) | 22.4% (2024) |
| P/E | 26.9 (2025) | -9.8 (2024) |
| P/B | 5.19 (2025) | 1.27 (2024) |
| Current Ratio | 1.56 (2025) | 1.37 (2024) |
| Quick Ratio | 1.51 (2025) | 1.37 (2024) |
| D/E | 0.06 (2025) | 1.10 (2024) |
| Debt-to-Assets | 3.7% (2025) | 23.5% (2024) |
| Interest Coverage | N/A | 5.57 (2024) |
| Asset Turnover | 0.49 (2025) | 0.23 (2024) |
| Fixed Asset Turnover | 9.02 (2025) | 6.95 (2024) |
| Payout Ratio | 0% (2025) | 0% (2024) |
| Dividend Yield | 0% (2025) | 0% (2024) |
| Fiscal Year | 2025 | 2024 |
Efficiency & Valuation Duel: The Vital Signs
Ratios act as a company’s DNA, exposing hidden risks and operational strengths that define its market standing and growth potential.
F5, Inc.
F5 delivers robust profitability with a 19.3% ROE and a strong 22.4% net margin, signaling operational excellence. The stock trades at a stretched 26.9 P/E and a rich 5.2 P/B, reflecting high investor expectations. Despite no dividend yield, F5 prioritizes growth through substantial R&D investment, supporting long-term shareholder value.
StoneCo Ltd.
StoneCo shows weak core profitability, with negative net margin and ROE at -11.9% and -12.9%, respectively, despite an efficient 22.4% ROIC. The valuation appears attractive with a P/E of -9.8 and P/B at 1.3, indicating market skepticism. The company reinvests heavily in growth, as it pays no dividend, yet carries higher debt levels, adding financial risk.
Premium Valuation vs. Operational Safety
F5 balances strong profitability and solid balance sheet metrics but at a premium valuation. StoneCo offers value through lower multiples but suffers from negative profitability and elevated leverage. Investors seeking operational safety may prefer F5, while those targeting turnaround potential might consider StoneCo’s riskier profile.
Which one offers the Superior Shareholder Reward?
I observe that neither F5, Inc. (FFIV) nor StoneCo Ltd. (STNE) pays dividends, focusing instead on reinvestment and share buybacks. FFIV’s free cash flow per share stands robust at $15.7, with no dividend payout but consistent buyback activity implied by strong cash metrics and low debt. STNE, despite its aggressive growth and reinvestment in capex ($4.2/share), shows negative free cash flow (-$16.2/share) and net losses, raising sustainability concerns. FFIV’s model leverages high margins and strong operating cash flow to fuel buybacks, offering a more reliable total shareholder return in 2026. Thus, I conclude FFIV offers the superior shareholder reward due to its sustainable capital allocation and healthier cash generation.
Comparative Score Analysis: The Strategic Profile
The radar chart reveals the fundamental DNA and trade-offs of F5, Inc. and StoneCo Ltd., highlighting their financial strengths and valuation differences:
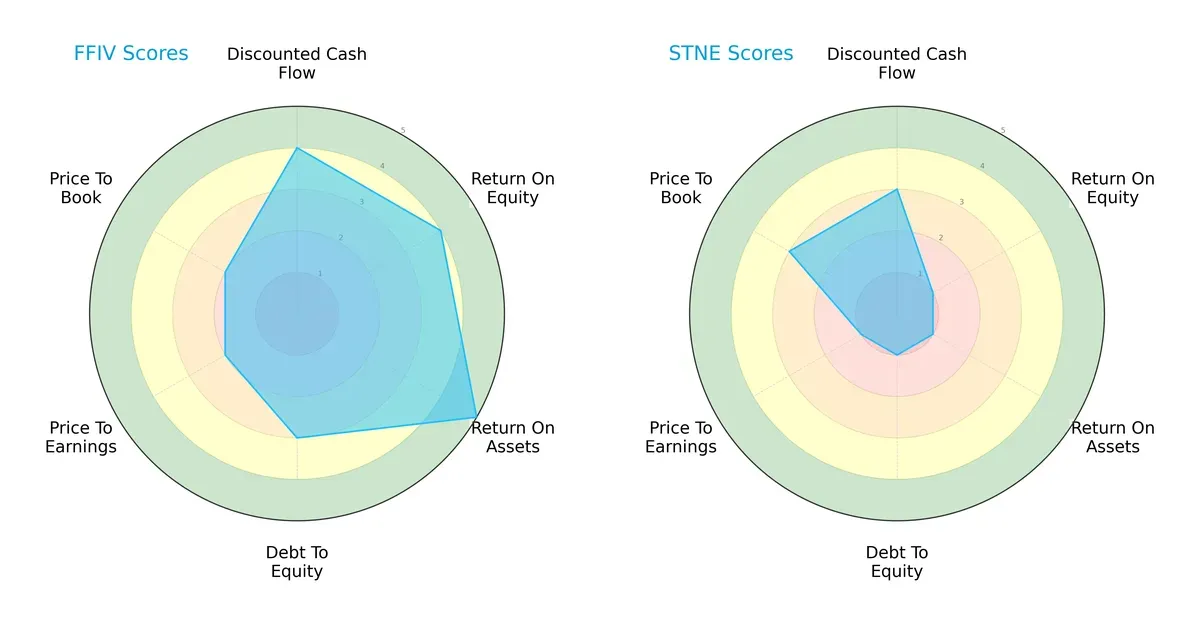
F5, Inc. delivers a balanced profile with strong returns on equity (4) and assets (5), moderate debt management (3), but slightly stretched valuation scores (PE/PB at 2). StoneCo Ltd. leans heavily on moderate DCF (3) but suffers from weak profitability (ROE/ROA scores at 1) and high financial risk (debt-to-equity at 1). F5’s diversified strengths contrast with StoneCo’s reliance on a modest valuation edge.
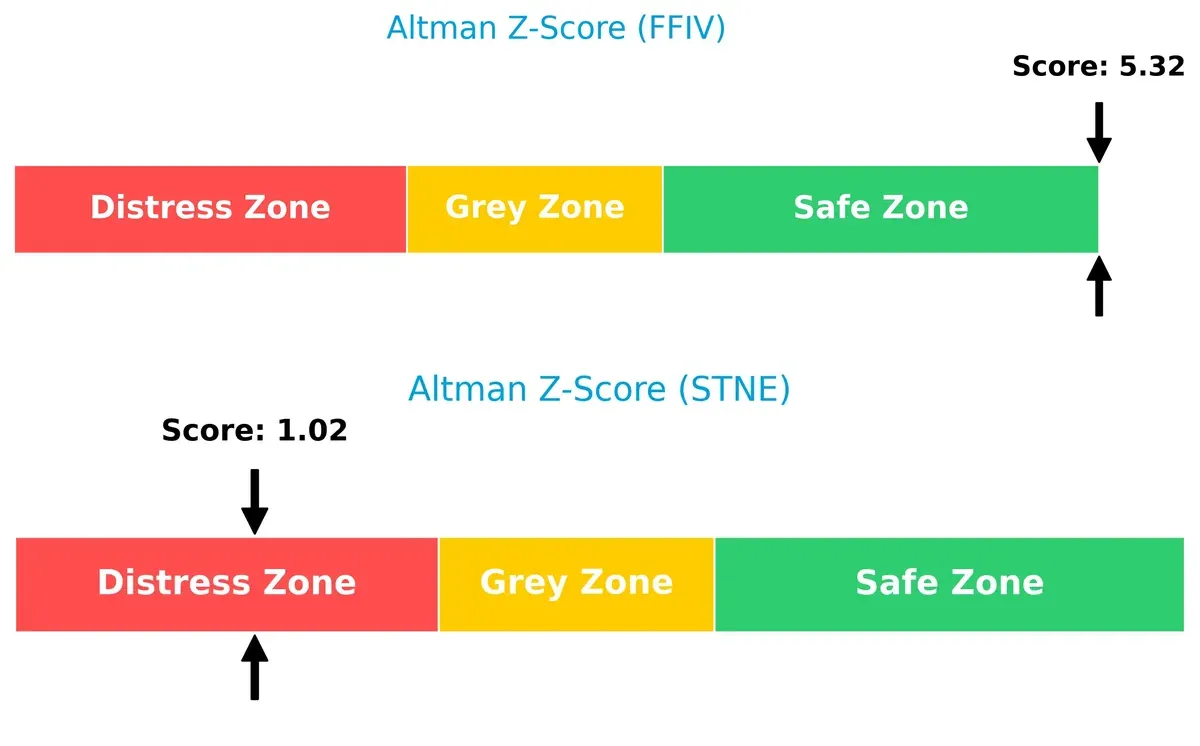
Bankruptcy Risk: Solvency Showdown
F5, Inc.’s Altman Z-Score of 5.32 places it firmly in the safe zone, indicating robust long-term solvency. StoneCo Ltd.’s 1.02 signals distress and heightened bankruptcy risk in this economic cycle:
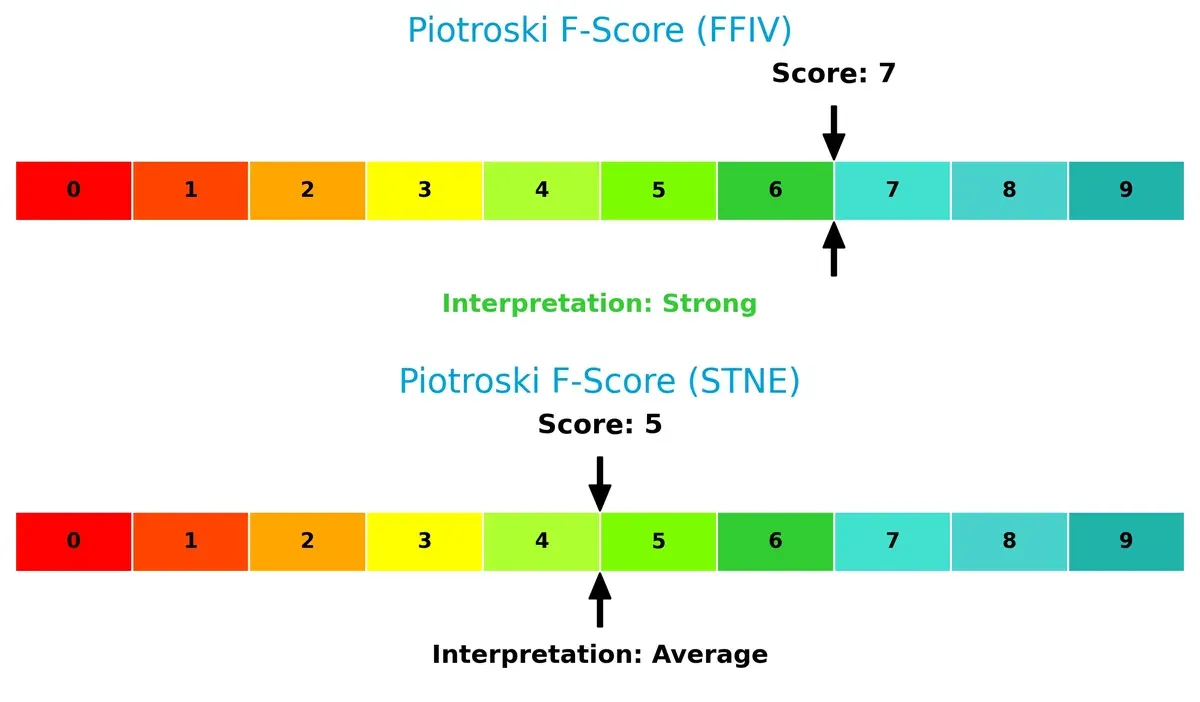
Financial Health: Quality of Operations
F5, Inc. scores a strong 7 on the Piotroski F-Score, reflecting solid profitability, liquidity, and operational efficiency. StoneCo Ltd.’s average 5 exposes internal weaknesses and potential red flags in financial health:
How are the two companies positioned?
This section dissects the operational DNA of F5 and StoneCo by comparing their revenue distribution by segment alongside their internal strengths and weaknesses. The goal is to confront their economic moats to identify which business model offers the most resilient, sustainable competitive advantage today.
Revenue Segmentation: The Strategic Mix
This comparison dissects how F5, Inc. and StoneCo Ltd. diversify their income streams and reveals where their primary sector bets lie:
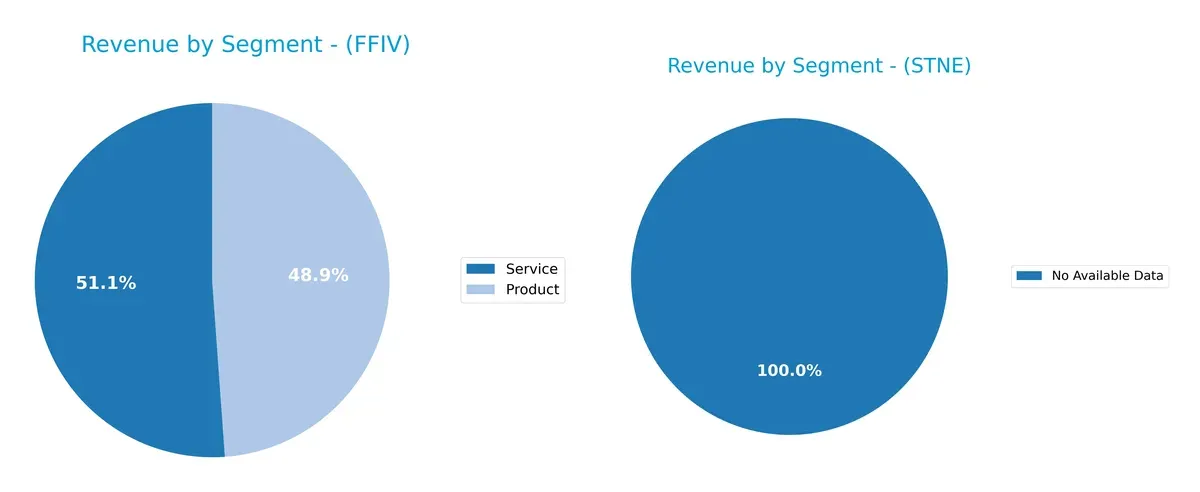
F5, Inc. balances revenue between Product ($1.5B) and Service ($1.58B) segments in 2025, showing a well-diversified mix that reduces reliance on one stream. StoneCo Ltd. lacks available data, preventing segmentation analysis. F5’s balanced model anchors its ecosystem lock-in by blending product sales with recurring service revenue, mitigating concentration risk and enhancing resilience amid sector cyclicality.
Strengths and Weaknesses Comparison
This table compares the strengths and weaknesses of F5, Inc. and StoneCo Ltd.:
F5, Inc. Strengths
- Strong profitability with 22.42% net margin and 19.28% ROE
- Favorable liquidity ratios with current ratio 1.56 and quick ratio 1.51
- Low debt levels with debt-to-assets 3.65% and interest coverage infinite
- Global presence across Americas, Asia Pacific, and EMEA
- Balanced revenue from products and services
- High fixed asset turnover at 9.02
StoneCo Ltd. Strengths
- High ROIC of 22.41%, indicating efficient capital use
- Favorable P/E and P/B ratios suggest undervaluation
- Good interest coverage at 5.41 and moderate debt-to-assets at 23.53%
- Quick ratio at 1.37 supports short-term liquidity
- Positive fixed asset turnover of 6.95
F5, Inc. Weaknesses
- Unfavorable P/E and P/B ratios indicate possible overvaluation
- Asset turnover is low at 0.49, limiting efficiency
- No dividend yield, which may deter income-focused investors
StoneCo Ltd. Weaknesses
- Negative net margin (-11.89%) and ROE (-12.87%) show unprofitability
- High debt-to-equity ratio of 1.1 raises financial risk
- WACC at 10.74% is unfavorable, increasing capital costs
- Asset turnover weak at 0.23, reflecting operational inefficiency
- No dividend yield, limiting shareholder returns
F5, Inc. demonstrates robust profitability and global diversification but faces valuation and efficiency challenges. StoneCo Ltd. shows efficient capital use but struggles with profitability and higher leverage, highlighting areas requiring strategic focus.
The Moat Duel: Analyzing Competitive Defensibility
A structural moat is the only barrier that shields long-term profits from relentless competition erosion. Let’s dissect the moats of two key players:
F5, Inc.: Hardware-Software Integration Moat
F5’s moat stems from its proprietary multi-cloud security hardware and software integration. This synergy sustains an 82% gross margin and 22% net margin. Expansion in cloud-native products may deepen this moat by 2026.
StoneCo Ltd.: Localized Payment Ecosystem Moat
StoneCo relies on a hyper-local fintech ecosystem in Brazil, contrasting F5’s global tech infrastructure. Despite a strong 45% EBIT margin, StoneCo’s negative net margin signals margin pressure. Growth in digital payments could widen its moat.
Moat Strength: Proprietary Integration vs. Localized Ecosystem
Both firms create value with ROIC exceeding WACC and rising trends. F5’s wider moat benefits from stable global demand and margin resilience. StoneCo’s moat is deeper in emerging fintech but faces profitability risks. F5 is better positioned to defend market share long term.
Which stock offers better returns?
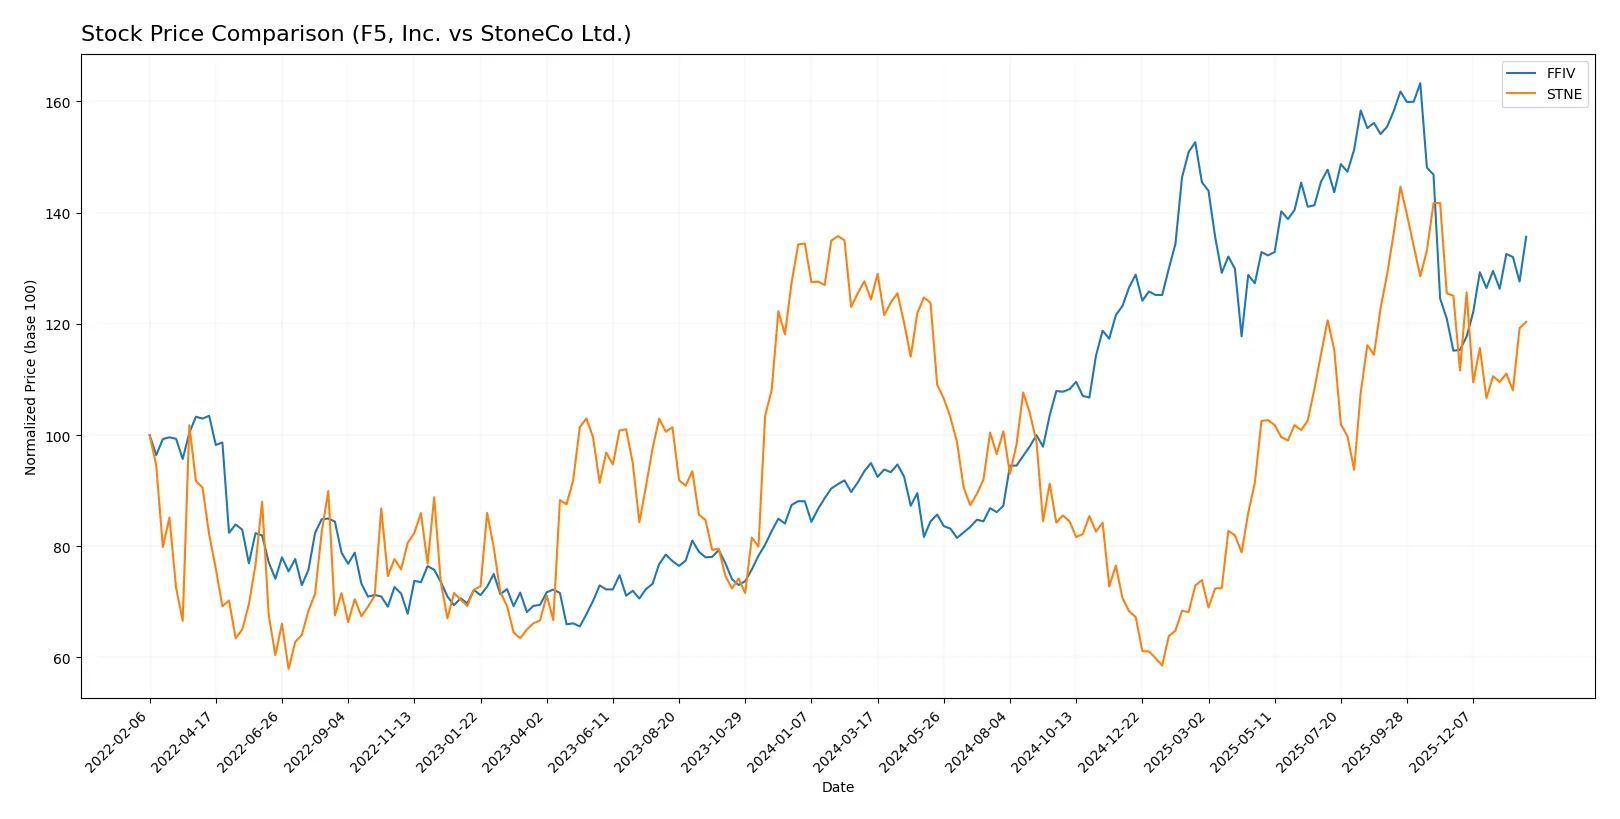
The stock price comparison over the past twelve months reveals significant divergence: F5, Inc. shows robust gains with upward momentum, while StoneCo Ltd. faces a moderate decline with decelerating weakness.
Trend Comparison
F5, Inc. exhibits a strong bullish trend with a 42.85% price increase over the past year, accelerating its upward trajectory and reaching a high of 331.75. Volatility is elevated at 48.51, signaling wide price swings.
StoneCo Ltd. trends bearish, declining 3.24% over the year with deceleration. Its price fluctuates narrowly, reflected by a low standard deviation of 2.9, and it peaked at only 19.4 before falling.
Comparing both, F5, Inc. delivers superior market performance with a clear growth trend, while StoneCo Ltd. posts a mild negative return and subdued volatility.
Target Prices
Analysts have set clear target price ranges for F5, Inc. and StoneCo Ltd., reflecting cautious optimism.
| Company | Target Low | Target High | Consensus |
|---|---|---|---|
| F5, Inc. | 295 | 352 | 330.67 |
| StoneCo Ltd. | 19 | 21 | 19.83 |
F5’s consensus target exceeds its current price of 275.61 by about 20%, signaling upside potential. StoneCo’s target is roughly 23% above its 16.14 price, indicating room for growth amid market volatility.

Don’t Let Luck Decide Your Entry Point
Optimize your entry points with our advanced ProRealTime indicators. You’ll get efficient buy signals with precise price targets for maximum performance. Start outperforming now!
How do institutions grade them?
The following tables summarize the latest institutional grades for F5, Inc. and StoneCo Ltd.:
F5, Inc. Grades
This table shows recent grade actions by major investment firms for F5, Inc.:
| Grading Company | Action | New Grade | Date |
|---|---|---|---|
| Needham | Maintain | Hold | 2026-01-28 |
| Piper Sandler | Maintain | Overweight | 2026-01-28 |
| Goldman Sachs | Maintain | Neutral | 2026-01-28 |
| Barclays | Maintain | Equal Weight | 2026-01-28 |
| RBC Capital | Maintain | Outperform | 2026-01-28 |
| JP Morgan | Upgrade | Overweight | 2026-01-15 |
| Piper Sandler | Upgrade | Overweight | 2026-01-05 |
| RBC Capital | Upgrade | Outperform | 2026-01-05 |
| Morgan Stanley | Maintain | Equal Weight | 2025-12-17 |
| Morgan Stanley | Maintain | Equal Weight | 2025-10-28 |
StoneCo Ltd. Grades
This table lists recent grade actions from recognized firms for StoneCo Ltd.:
| Grading Company | Action | New Grade | Date |
|---|---|---|---|
| UBS | Maintain | Buy | 2026-01-28 |
| Goldman Sachs | Maintain | Buy | 2026-01-28 |
| Goldman Sachs | Maintain | Buy | 2025-10-14 |
| B of A Securities | Maintain | Buy | 2025-09-09 |
| UBS | Maintain | Buy | 2025-08-29 |
| JP Morgan | Maintain | Overweight | 2025-07-16 |
| Barclays | Maintain | Equal Weight | 2025-05-12 |
| Barclays | Maintain | Equal Weight | 2025-04-23 |
| Citigroup | Upgrade | Buy | 2025-04-22 |
| Morgan Stanley | Maintain | Underweight | 2025-03-21 |
Which company has the best grades?
StoneCo Ltd. consistently receives Buy ratings from UBS, Goldman Sachs, and others, indicating strong institutional confidence. F5, Inc. shows a mix of Hold, Equal Weight, and Outperform grades, reflecting more cautious sentiment. Investors may view StoneCo’s stronger consensus ratings as a sign of higher growth expectations or sector favorability.
Risks specific to each company
The following categories identify critical pressure points and systemic threats facing F5, Inc. and StoneCo Ltd. in the 2026 market environment:
1. Market & Competition
F5, Inc.
- Operates in multi-cloud security, facing intense competition from large cloud providers and security startups.
StoneCo Ltd.
- Focuses on Brazilian fintech; highly competitive with local banks and global fintech disruptors.
2. Capital Structure & Debt
F5, Inc.
- Extremely low debt-to-equity (0.06) signals conservative leverage and strong balance sheet.
StoneCo Ltd.
- High debt-to-equity (1.1) indicates elevated financial risk and reliance on borrowed capital.
3. Stock Volatility
F5, Inc.
- Beta near 1 (0.975) suggests stock moves closely with market, moderate volatility.
StoneCo Ltd.
- High beta (1.835) reflects elevated stock volatility and sensitivity to market swings.
4. Regulatory & Legal
F5, Inc.
- Subject to global data security and compliance regulations, with potential penalties.
StoneCo Ltd.
- Exposed to complex Brazilian financial regulations and evolving fintech oversight.
5. Supply Chain & Operations
F5, Inc.
- Relies on hardware and software integration; supply chain disruptions could delay product delivery.
StoneCo Ltd.
- Dependent on local infrastructure and digital payment ecosystems, sensitive to operational hiccups.
6. ESG & Climate Transition
F5, Inc.
- Increasing pressure to reduce carbon footprint in data centers and hardware manufacturing.
StoneCo Ltd.
- Faces challenges in sustainable finance and social governance within emerging markets.
7. Geopolitical Exposure
F5, Inc.
- Diverse global presence mitigates risk but exposes to geopolitical tensions, especially US-China tech rivalry.
StoneCo Ltd.
- Concentrated in Brazil and Latin America, vulnerable to regional political instability and currency fluctuations.
Which company shows a better risk-adjusted profile?
F5, Inc. faces moderate market competition and geopolitical risks but benefits from a rock-solid balance sheet and stable financial metrics. StoneCo’s highest risks stem from excessive leverage, negative profitability, and volatile stock behavior amid regulatory and regional uncertainties. F5’s Altman Z-score in the safe zone (5.32) contrasts sharply with StoneCo’s distress zone (1.02). Therefore, F5, Inc. shows a markedly better risk-adjusted profile for investors prioritizing financial stability and lower volatility. StoneCo’s ongoing losses and heavy debt remain significant red flags despite its growth potential in fintech.
Final Verdict: Which stock to choose?
F5, Inc. (FFIV) stands out as a cash-generating powerhouse with a durable competitive edge. Its growing ROIC comfortably outpaces its WACC, signaling effective capital allocation and sustainable value creation. A point of vigilance remains its relatively high valuation multiples, which could pressure returns if growth slows. FFIV suits an Aggressive Growth portfolio focused on quality and operational strength.
StoneCo Ltd. (STNE) leverages a strategic moat rooted in expanding payment platform reach and solid recurring revenues. Despite its impressive ROIC trend, the company’s profitability remains volatile, and leverage levels raise caution. Compared to FFIV, STNE offers less safety but more asymmetric upside potential, fitting a GARP (Growth at a Reasonable Price) investor seeking emerging market exposure with controlled risk.
If you prioritize steady value creation and operational resilience, F5, Inc. outshines as the compelling choice due to its stable cash flow and improving profitability. However, if you seek growth in a dynamic fintech space with potential for outsized returns despite earnings volatility, StoneCo offers superior growth leverage. Both represent distinct analytical scenarios aligned with different investor risk tolerances and strategic goals.
Disclaimer: Investment carries a risk of loss of initial capital. The past performance is not a reliable indicator of future results. Be sure to understand risks before making an investment decision.
Go Further
I encourage you to read the complete analyses of F5, Inc. and StoneCo Ltd. to enhance your investment decisions: