Home > Comparison > Technology > PANW vs FFIV
The strategic rivalry between Palo Alto Networks, Inc. and F5, Inc. defines the current trajectory of the technology sector’s software infrastructure landscape. Palo Alto Networks operates as a cybersecurity powerhouse focused on cloud and network security solutions. In contrast, F5, Inc. specializes in multi-cloud application security and delivery, blending hardware and software innovations. This analysis explores which operational model offers a superior risk-adjusted return for diversified investors navigating evolving market demands.
Table of contents
Companies Overview
Palo Alto Networks and F5 stand as pivotal players in the cybersecurity and application delivery markets.
Palo Alto Networks, Inc.: Cybersecurity Infrastructure Leader
Palo Alto Networks dominates the cybersecurity infrastructure sector. Its core revenue derives from firewall appliances, software, and subscription services focused on threat prevention and cloud security. In 2026, the company prioritizes expanding its cloud security and threat intelligence offerings to address evolving cyber threats across enterprises and government sectors.
F5, Inc.: Multi-Cloud Application Security Specialist
F5 leads in multi-cloud application security and delivery. It generates revenue through hardware and software solutions ensuring application security, performance, and availability across on-premises and cloud environments. The firm’s 2026 strategy centers on enhancing multi-cloud integration and expanding its portfolio with advanced security products like NGINX and DDoS protection services.
Strategic Collision: Similarities & Divergences
Both companies operate within software infrastructure but differ sharply in philosophy. Palo Alto Networks emphasizes a comprehensive cybersecurity platform while F5 focuses on a multi-cloud, application-centric approach. They compete primarily in securing cloud environments and enterprise networks. Their distinct models offer investors exposure to either broad cybersecurity defense or specialized application delivery security.
Income Statement Comparison
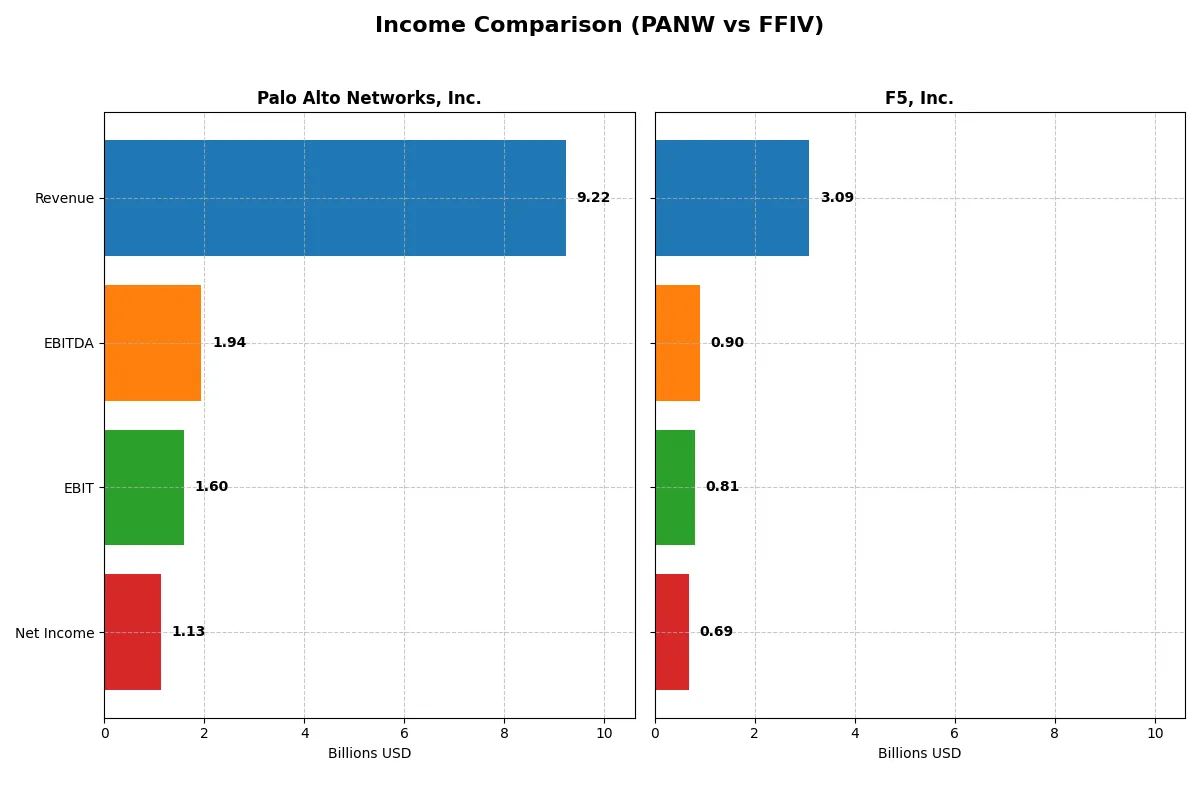
This data dissects the core profitability and scalability of both corporate engines to reveal who dominates the bottom line:
| Metric | Palo Alto Networks, Inc. (PANW) | F5, Inc. (FFIV) |
|---|---|---|
| Revenue | 9.22B | 3.09B |
| Cost of Revenue | 2.45B | 564M |
| Operating Expenses | 5.53B | 1.76B |
| Gross Profit | 6.77B | 2.52B |
| EBITDA | 1.94B | 901M |
| EBIT | 1.60B | 808M |
| Interest Expense | 3M | 0 |
| Net Income | 1.13B | 692M |
| EPS | 1.71 | 11.95 |
| Fiscal Year | 2025 | 2025 |
Income Statement Analysis: The Bottom-Line Duel
This income statement comparison unveils which company wields superior efficiency and profit generation in today’s competitive landscape.
Palo Alto Networks, Inc. Analysis
Palo Alto Networks grew revenue from $4.3B in 2021 to $9.2B in 2025, with net income surging from losses to $1.13B in 2025. Its gross margin holds steady at a healthy 73.4%, while net margin at 12.3% reflects recent margin compression. The 2025 jump in EBIT by 61% signals operational momentum despite a 62% net margin drop.
F5, Inc. Analysis
F5 delivered moderate revenue growth from $2.6B in 2021 to $3.1B in 2025, with net income nearly doubling to $692M. The company boasts a robust 81.7% gross margin and an impressive 22.4% net margin, both outperforming industry averages. In 2025, F5’s EBIT rose 21%, supported by consistent margin gains and solid EPS growth of 24%.
Margin Strength vs. Growth Scale
F5 leads with stronger margin profiles and steadier net income growth, reflecting superior capital efficiency. Palo Alto Networks impresses with rapid revenue and EBIT expansion but faces net margin volatility. Investors seeking stable profitability may favor F5’s consistent cash generation, while growth-focused profiles might lean toward Palo Alto’s scale and operational leverage.
Financial Ratios Comparison
These vital ratios act as a diagnostic tool to expose the underlying fiscal health, valuation premiums, and capital efficiency of the companies compared below:
| Ratios | Palo Alto Networks (PANW) | F5, Inc. (FFIV) |
|---|---|---|
| ROE | 14.49% | 19.28% |
| ROIC | 5.67% | 13.99% |
| P/E | 101.43 | 26.91 |
| P/B | 14.70 | 5.19 |
| Current Ratio | 0.89 | 1.56 |
| Quick Ratio | 0.89 | 1.51 |
| D/E | 0.04 | 0.06 |
| Debt-to-Assets | 1.43% | 3.65% |
| Interest Coverage | 414.3 | 0 (not reported) |
| Asset Turnover | 0.39 | 0.49 |
| Fixed Asset Turnover | 12.56 | 9.02 |
| Payout ratio | 0 | 0 |
| Dividend yield | 0 | 0 |
| Fiscal Year | 2025 | 2025 |
Efficiency & Valuation Duel: The Vital Signs
Financial ratios form the company’s DNA, uncovering hidden risks and operational strengths vital for investment evaluation.
Palo Alto Networks, Inc.
Palo Alto Networks shows a solid net margin of 12.3% and a neutral ROE at 14.5%, indicating moderate profitability. Its P/E ratio of 101.4 signals an expensive valuation, stretched relative to earnings. The company offers no dividend, focusing on heavy R&D reinvestment, emphasizing growth over immediate shareholder returns.
F5, Inc.
F5 posts a robust net margin of 22.4% and a favorable ROE of 19.3%, reflecting strong profitability and efficient capital use. Its P/E ratio of 26.9 appears high but more reasonable than Palo Alto’s. Like Palo Alto, F5 pays no dividend, instead prioritizing growth investments, supported by a strong current ratio of 1.56 indicating operational stability.
Premium Valuation vs. Operational Safety
F5 offers a better balance of profitability and valuation, with more favorable ratios and financial stability. Palo Alto’s premium valuation suggests higher risk for stretched earnings. Growth-oriented investors may prefer Palo Alto’s aggressive reinvestment, while those valuing operational safety might lean toward F5.
Which one offers the Superior Shareholder Reward?
Palo Alto Networks (PANW) and F5, Inc. (FFIV) both forgo dividends, focusing on reinvestment and buybacks. PANW’s free cash flow per share reached $5.24 in 2025, but it lacks buyback disclosures, signaling limited direct shareholder returns. FFIV generated $15.7 FCF per share in 2025 and maintains a robust buyback program, enhancing total return. FFIV’s lower price-to-free-cash-flow ratio (~20.6 vs. PANW’s ~33.1) suggests better valuation support for buybacks. I see FFIV’s distribution model—growing FCF and active buybacks—as more sustainable and rewarding long-term. In 2026, FFIV offers the superior total shareholder return profile.
Comparative Score Analysis: The Strategic Profile
The radar chart reveals the fundamental DNA and trade-offs shaping Palo Alto Networks and F5, Inc., highlighting their unique financial strengths and weaknesses:
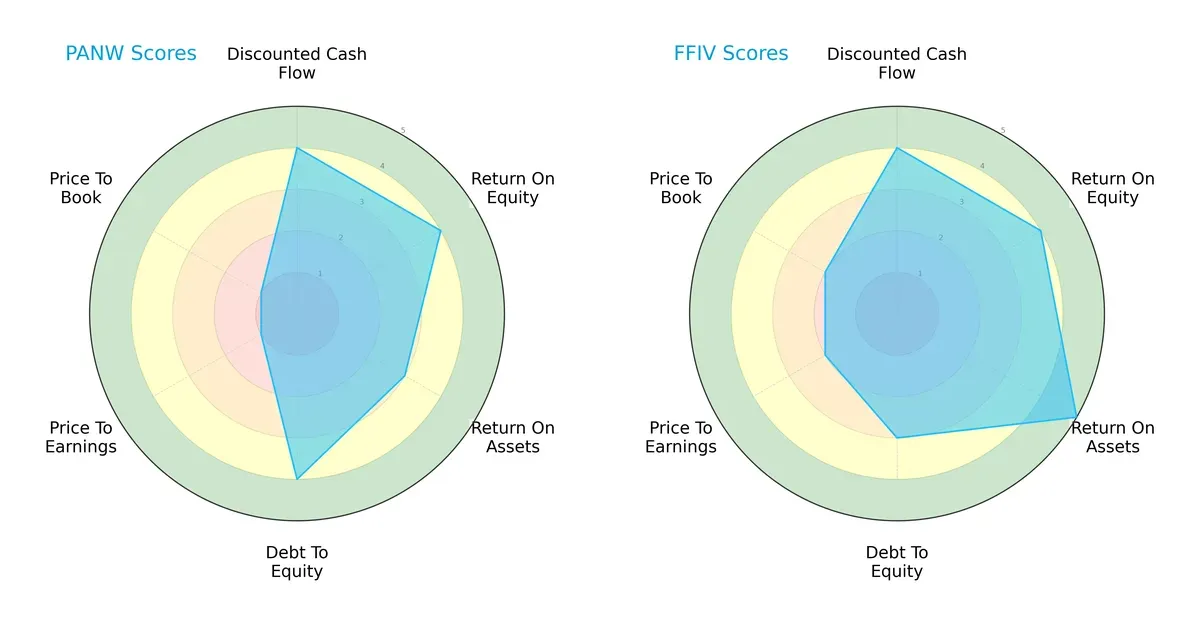
Palo Alto Networks shows a balanced profile in DCF, ROE, and debt management but struggles with valuation metrics (PE/PB score both at 1, very unfavorable). F5, Inc. excels in asset efficiency (ROA score 5) and maintains a strong overall score (4), though it carries slightly higher debt risk (Debt/Equity score 3). F5’s profile is more balanced, while Palo Alto relies heavily on capital structure discipline and cash flow strength.
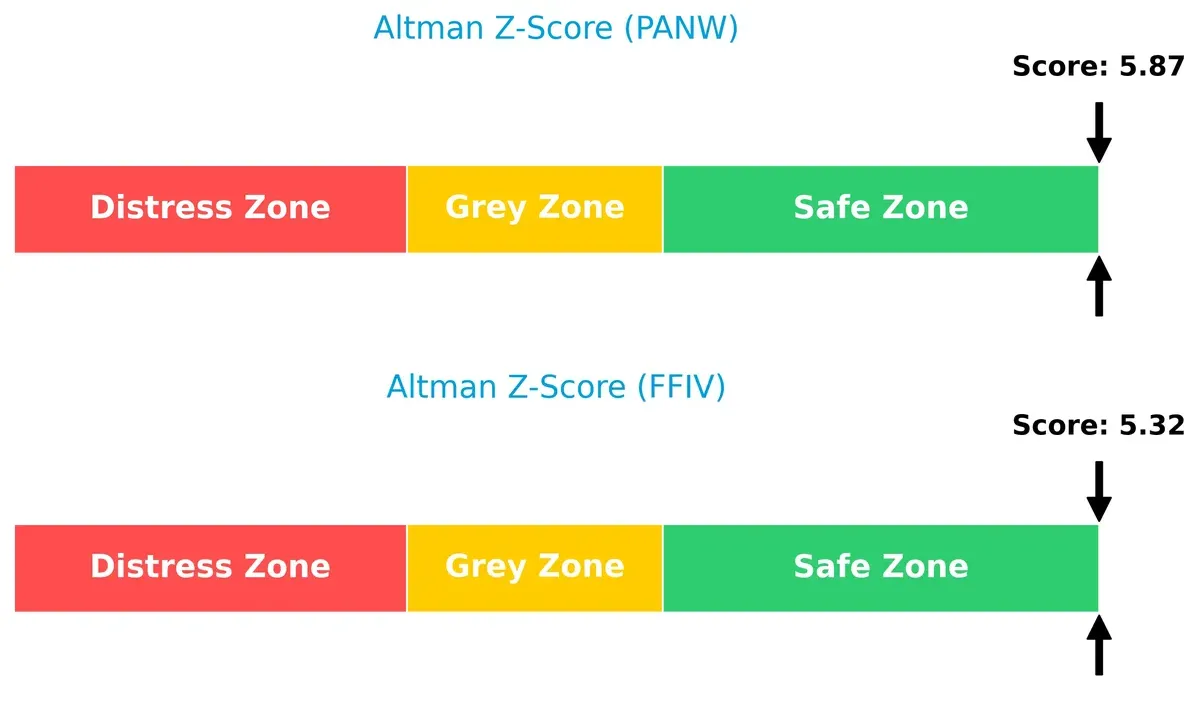
Bankruptcy Risk: Solvency Showdown
The Altman Z-Scores place both firms comfortably in the safe zone, but Palo Alto Networks leads slightly, suggesting marginally stronger long-term solvency in this cycle:
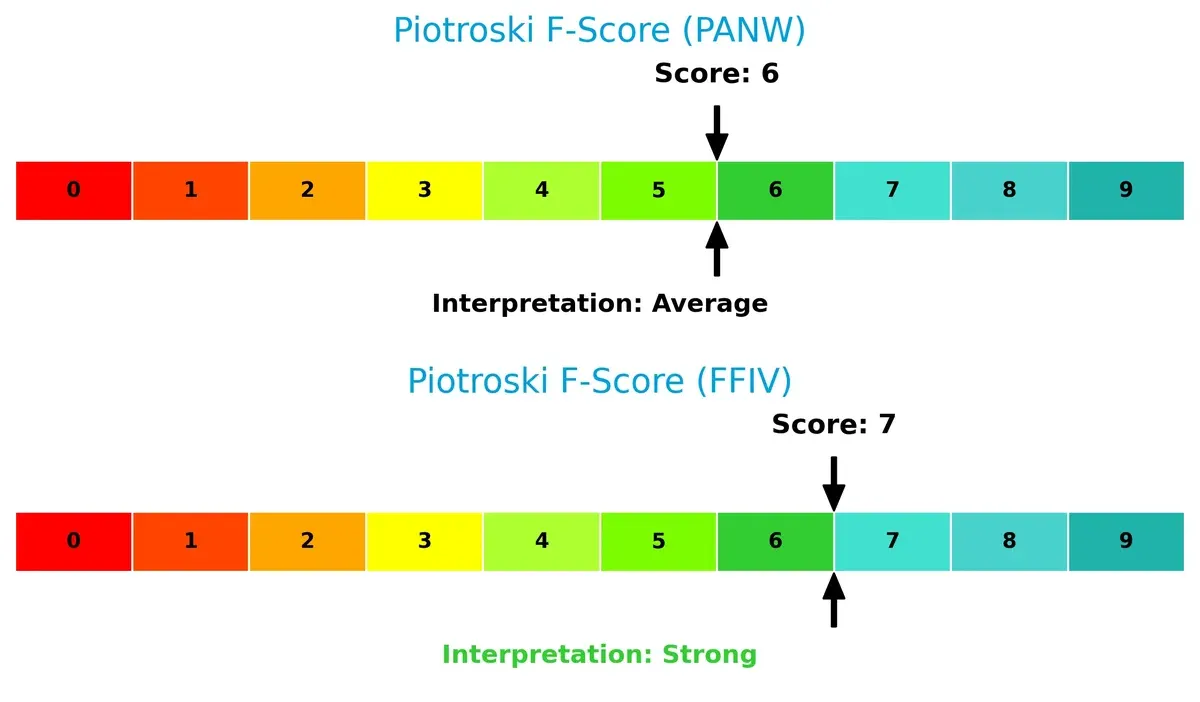
Financial Health: Quality of Operations
F5, Inc. scores a 7 on the Piotroski scale, indicating strong internal financial health and operational quality. Palo Alto Networks, with a 6, is solid but shows minor red flags compared to its peer:
How are the two companies positioned?
This section dissects PANW and FFIV’s operational DNA by comparing their revenue distribution and internal dynamics. The goal is to confront their economic moats and identify which model offers the most resilient competitive advantage today.
Revenue Segmentation: The Strategic Mix
This visual comparison dissects how Palo Alto Networks and F5 diversify their income streams and where their primary sector bets lie:
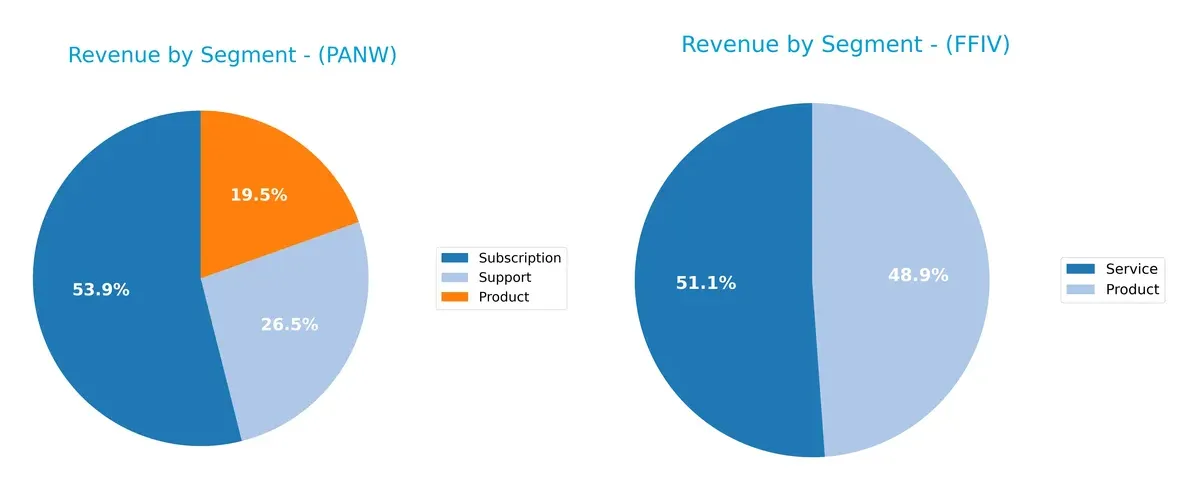
Palo Alto Networks anchors its revenue in subscriptions at $4.97B, overshadowing product sales at $1.8B and support at $2.45B, reflecting a strong ecosystem lock-in. F5 shows a more balanced split with $1.51B in product and $1.58B in services, indicating broader revenue diversification. PANW’s concentration in subscription risks dependency on renewal rates, while FFIV’s mix reduces exposure to any single segment’s volatility.
Strengths and Weaknesses Comparison
This table compares the Strengths and Weaknesses of Palo Alto Networks and F5, Inc.:
Palo Alto Networks Strengths
- Strong subscription revenue growing to $4.97B in 2025
- High interest coverage at 532.53
- Favorable low debt-to-assets at 1.43%
- Large Americas presence at $6.21B
- Favorable WACC at 7.34%
- Solid fixed asset turnover of 12.56
F5, Inc. Strengths
- Higher net margin at 22.42%
- Strong ROE at 19.28% and ROIC at 13.99%
- Favorable liquidity ratios with current ratio 1.56
- Infinite interest coverage
- Balanced global sales with $1.82B Americas revenue
- Favorable fixed asset turnover at 9.02
Palo Alto Networks Weaknesses
- Unfavorable high P/E at 101.43 and P/B at 14.7
- Low current ratio at 0.89 indicating liquidity risk
- Unfavorable asset turnover at 0.39
- No dividend yield
- Neutral ROE and ROIC relative to WACC
- Subscription and support still smaller than product revenue
F5, Inc. Weaknesses
- Unfavorable P/E at 26.91 and P/B at 5.19
- Unfavorable asset turnover at 0.49
- No dividend yield
- Slightly higher debt-to-assets at 3.65%
- Neutral WACC at 8.31%
Palo Alto Networks excels in subscription growth and conservative leverage but faces valuation and liquidity concerns. F5 shows stronger profitability and liquidity metrics but contends with valuation pressures and asset efficiency. Both companies demonstrate robust global footprints and capital structure management, influencing their strategic positioning.
The Moat Duel: Analyzing Competitive Defensibility
A structural moat is the sole shield protecting long-term profits from relentless competitive erosion. Let’s dissect the core moats of two software infrastructure leaders:
Palo Alto Networks, Inc.: Innovation-Driven Switching Costs
Palo Alto Networks leverages high switching costs through integrated cybersecurity solutions and subscription services. Despite shedding value currently, its ROIC growth signals improving profitability. Expansion into cloud security in 2026 could strengthen this moat.
F5, Inc.: Cost Advantage and Durable Profitability
F5’s moat stems from cost advantages and a diversified multi-cloud application security portfolio. Its ROIC exceeds WACC by 5.7%, showcasing efficient capital use and lasting value creation. Continued partnerships with major cloud providers fuel growth prospects.
Verdict: Switching Costs vs. Cost Advantage – Which Moat Runs Deeper?
F5 holds a deeper, more durable moat with clear value creation and robust profitability growth. Palo Alto Networks shows promise but currently struggles to convert innovation into sustained economic profit. F5 is better positioned to defend market share in 2026.
Which stock offers better returns?
Over the past year, Palo Alto Networks showed a strong 26.3% price increase with recent deceleration, while F5 posted a more robust 42.9% gain, accelerating upward in recent months.
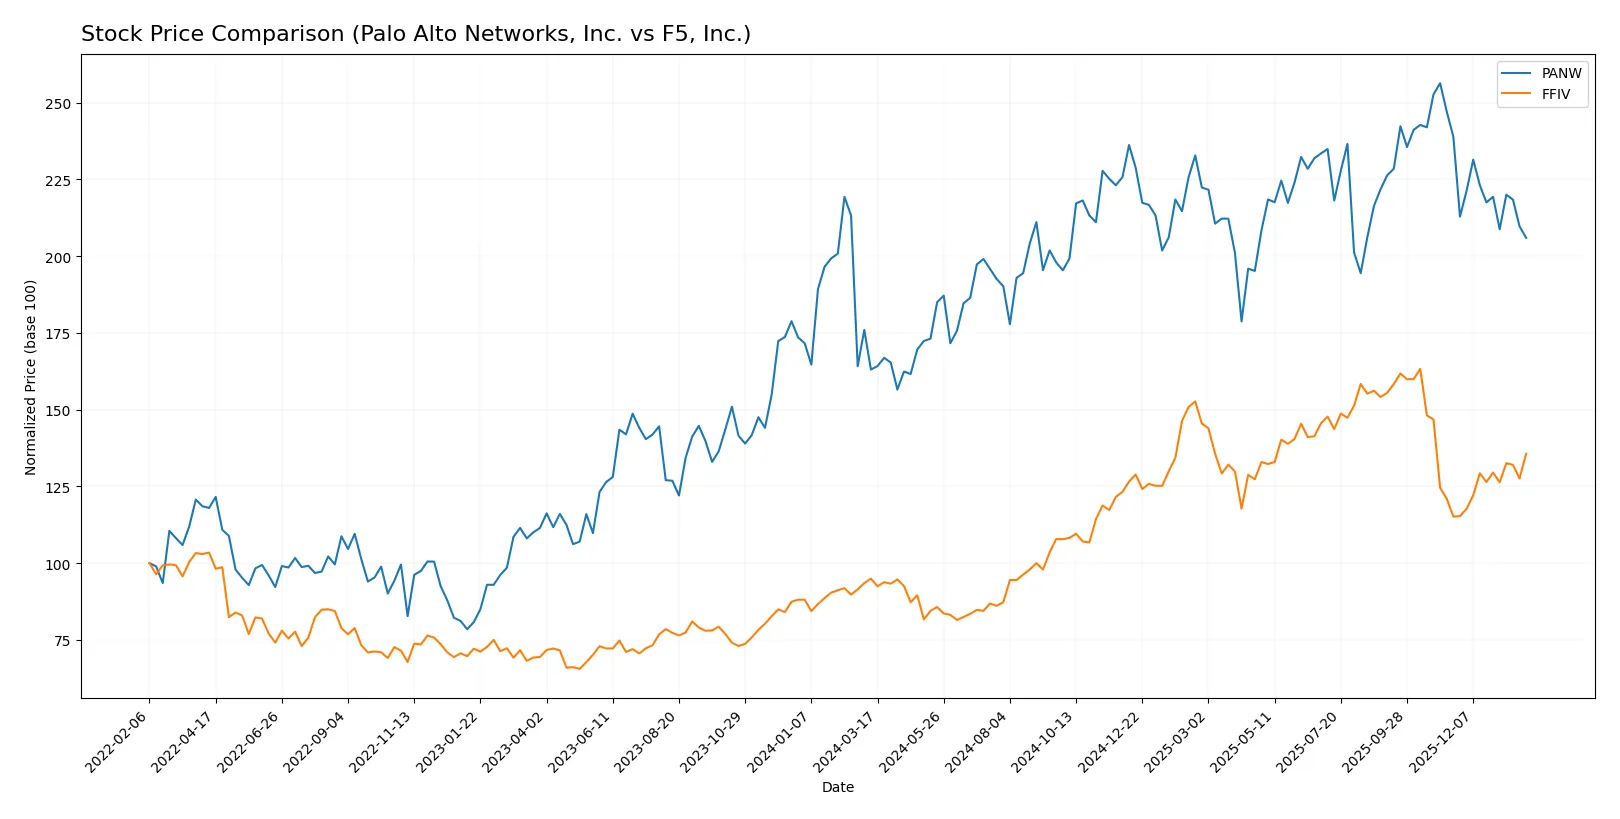
Trend Comparison
Palo Alto Networks’ stock rose 26.3% over 12 months, marking a bullish trend with decelerating momentum and a high of 220.24. Recent months show a 13.8% decline, indicating short-term weakness.
F5’s stock gained 42.9% over the same period, sustaining a bullish trend with acceleration and a high volatility level. Its recent 17.8% gain confirms strong upward momentum.
Comparing both, F5 outperformed Palo Alto Networks in total price appreciation and recent trend strength, delivering the highest market returns among the two.
Target Prices
Analysts show a bullish consensus for both Palo Alto Networks and F5, Inc., reflecting confidence in their growth prospects.
| Company | Target Low | Target High | Consensus |
|---|---|---|---|
| Palo Alto Networks, Inc. | 157 | 265 | 231.07 |
| F5, Inc. | 295 | 352 | 330.67 |
The target consensus for Palo Alto Networks stands significantly above its current price of $177, indicating upside potential. F5’s consensus target also exceeds its current price of $276, suggesting room for appreciation amid solid fundamentals.

Don’t Let Luck Decide Your Entry Point
Optimize your entry points with our advanced ProRealTime indicators. You’ll get efficient buy signals with precise price targets for maximum performance. Start outperforming now!
How do institutions grade them?
Palo Alto Networks, Inc. Grades
The following table summarizes recent grades from major institutional analysts for Palo Alto Networks, Inc.:
| Grading Company | Action | New Grade | Date |
|---|---|---|---|
| Needham | Maintain | Buy | 2026-01-28 |
| UBS | Maintain | Neutral | 2026-01-13 |
| Guggenheim | Upgrade | Neutral | 2026-01-05 |
| Piper Sandler | Maintain | Overweight | 2026-01-05 |
| Morgan Stanley | Maintain | Overweight | 2025-12-18 |
| HSBC | Downgrade | Reduce | 2025-11-21 |
| Goldman Sachs | Maintain | Buy | 2025-11-21 |
| Rosenblatt | Maintain | Buy | 2025-11-20 |
| Needham | Maintain | Buy | 2025-11-20 |
| BTIG | Maintain | Buy | 2025-11-20 |
F5, Inc. Grades
This table presents the latest grades issued by recognized institutions for F5, Inc.:
| Grading Company | Action | New Grade | Date |
|---|---|---|---|
| Needham | Maintain | Hold | 2026-01-28 |
| Piper Sandler | Maintain | Overweight | 2026-01-28 |
| Goldman Sachs | Maintain | Neutral | 2026-01-28 |
| Barclays | Maintain | Equal Weight | 2026-01-28 |
| RBC Capital | Maintain | Outperform | 2026-01-28 |
| JP Morgan | Upgrade | Overweight | 2026-01-15 |
| Piper Sandler | Upgrade | Overweight | 2026-01-05 |
| RBC Capital | Upgrade | Outperform | 2026-01-05 |
| Morgan Stanley | Maintain | Equal Weight | 2025-12-17 |
| Morgan Stanley | Maintain | Equal Weight | 2025-10-28 |
Which company has the best grades?
Palo Alto Networks holds predominantly Buy and Overweight ratings from multiple major firms, while F5, Inc. has more mixed ratings centered on Hold to Outperform. Investors may interpret Palo Alto Networks’ stronger consensus as a signal of greater institutional confidence.
Risks specific to each company
In 2026’s dynamic market landscape, these categories highlight critical pressure points and systemic threats facing Palo Alto Networks, Inc. and F5, Inc.:
1. Market & Competition
Palo Alto Networks, Inc.
- Faces intense competition in cybersecurity, with rapid innovation demands.
F5, Inc.
- Competes in multi-cloud security with established cloud partnerships, maintaining niche strength.
2. Capital Structure & Debt
Palo Alto Networks, Inc.
- Very low debt (D/E 0.04), strong interest coverage, but low liquidity (current ratio 0.89).
F5, Inc.
- Low debt (D/E 0.06), excellent liquidity (current ratio 1.56), slightly higher leverage but manageable.
3. Stock Volatility
Palo Alto Networks, Inc.
- Beta of 0.75 suggests lower volatility than market.
F5, Inc.
- Beta near 1.0 indicates volatility close to overall market risk.
4. Regulatory & Legal
Palo Alto Networks, Inc.
- Cybersecurity regulations tighten, exposing to compliance costs and potential fines.
F5, Inc.
- Faces regulatory scrutiny in multi-cloud environments; risks from data privacy laws.
5. Supply Chain & Operations
Palo Alto Networks, Inc.
- Global hardware supply constraints impact appliance delivery timelines.
F5, Inc.
- Operations rely heavily on hardware-software integration, vulnerable to component shortages.
6. ESG & Climate Transition
Palo Alto Networks, Inc.
- Increasing pressure to reduce carbon footprint and improve governance transparency.
F5, Inc.
- ESG initiatives progressing but must accelerate to meet stakeholder expectations.
7. Geopolitical Exposure
Palo Alto Networks, Inc.
- Exposure to US-China tensions affecting global sales and supply chains.
F5, Inc.
- Operations diversified globally but sensitive to trade restrictions and sanctions.
Which company shows a better risk-adjusted profile?
F5’s most impactful risk lies in navigating regulatory complexities in multi-cloud security, while Palo Alto Networks struggles with liquidity constraints amid intense competition. F5 delivers a stronger risk-adjusted profile, supported by its favorable liquidity ratios and robust Altman Z-Score. Palo Alto Networks’ stretched current ratio (0.89) signals a red flag in the current market environment.
Final Verdict: Which stock to choose?
Palo Alto Networks, Inc. (PANW) excels as a powerhouse of innovation with a rapidly growing profitability trend. Its superpower lies in aggressive R&D investment fueling future growth, but a current liquidity shortfall remains a point of vigilance. It suits portfolios aiming for aggressive growth and tech leadership exposure.
F5, Inc. (FFIV) boasts a durable competitive moat with strong cash flow efficiency and a solid balance sheet. Its strategic advantage comes from a well-established recurring revenue base and superior capital efficiency, offering better stability relative to PANW. FFIV fits well into GARP (Growth at a Reasonable Price) portfolios seeking resilience.
If you prioritize high-growth potential with innovative edge, PANW is the compelling choice due to its accelerating profitability and market leadership. However, if you seek a more stable investment with a proven economic moat and efficient capital use, FFIV offers better stability and a more favorable risk-reward profile. Each reflects distinct investor avatars with different tolerance for growth versus safety.
Disclaimer: Investment carries a risk of loss of initial capital. The past performance is not a reliable indicator of future results. Be sure to understand risks before making an investment decision.
Go Further
I encourage you to read the complete analyses of Palo Alto Networks, Inc. and F5, Inc. to enhance your investment decisions: