Home > Comparison > Technology > PLTR vs FFIV
The strategic rivalry between Palantir Technologies Inc. and F5, Inc. shapes the evolution of the technology sector. Palantir, a data-driven software innovator, contrasts with F5’s multi-cloud application security and delivery solutions. This head-to-head pits advanced data analytics against robust network security. I will evaluate which company offers the superior risk-adjusted return for a diversified portfolio amid shifting industry dynamics and escalating digital demands.
Table of contents
Companies Overview
Palantir Technologies and F5, Inc. stand as pivotal players in the software infrastructure sector, shaping enterprise data and application security.
Palantir Technologies Inc.: Data-Driven Intelligence Leader
Palantir dominates the data analytics platform space with its Gotham and Foundry software, powering intelligence and commercial clients worldwide. Its core revenue stems from deploying complex data integration and analysis tools that enable actionable insights. In 2026, Palantir sharpened its focus on AI-driven platforms, expanding its Palantir Artificial Intelligence Platform to enhance large language model integration.
F5, Inc.: Multi-Cloud Application Security Specialist
F5 leads in application security and delivery, offering appliances and cloud-based solutions that protect and optimize network applications. Its revenue primarily comes from selling multi-cloud security products and professional services to enterprises and governments. The company’s 2026 strategy emphasizes seamless multi-cloud integration and advanced threat defense across hybrid environments.
Strategic Collision: Similarities & Divergences
Both companies operate in software infrastructure but diverge sharply in approach: Palantir pursues a data-centric, AI-enhanced analytics model, while F5 prioritizes security and application performance in multi-cloud architectures. Their primary battleground is enterprise digital transformation, where data insights meet secure application delivery. Palantir appeals to data-driven operational intelligence investors; F5 attracts those focused on resilient, scalable cybersecurity solutions.
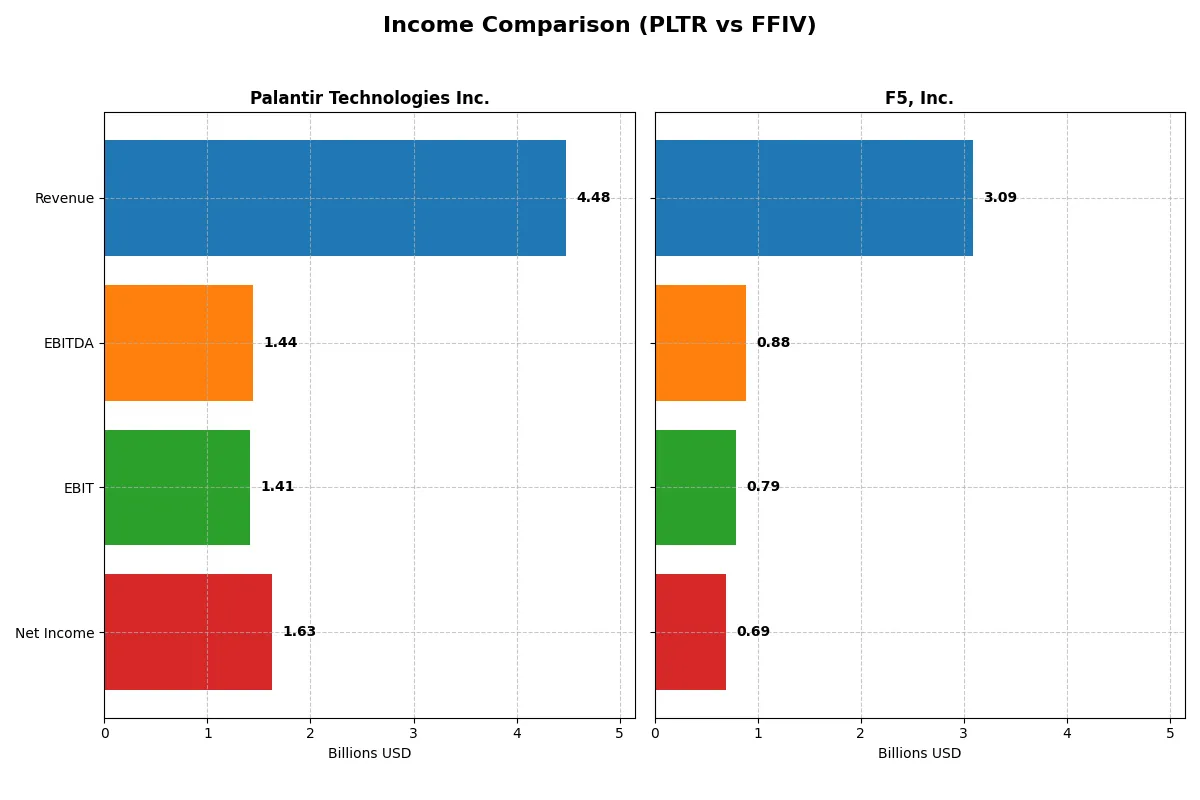
Income Statement Comparison
This data dissects the core profitability and scalability of both corporate engines to reveal who dominates the bottom line:
| Metric | Palantir Technologies Inc. (PLTR) | F5, Inc. (FFIV) |
|---|---|---|
| Revenue | 4.48B | 3.09B |
| Cost of Revenue | 789M | 574M |
| Operating Expenses | 2.27B | 1.75B |
| Gross Profit | 3.69B | 2.51B |
| EBITDA | 1.44B | 884M |
| EBIT | 1.41B | 791M |
| Interest Expense | 0 | 0 |
| Net Income | 1.63B | 692M |
| EPS | 0.69 | 11.96 |
| Fiscal Year | 2025 | 2025 |
Income Statement Analysis: The Bottom-Line Duel
This income statement comparison reveals which company operates with superior efficiency and profitability in a competitive landscape.
Palantir Technologies Inc. Analysis
Palantir delivers a striking revenue surge, jumping from 1.5B in 2021 to 4.5B in 2025, with net income turning sharply positive to 1.6B. Its gross margin stands robust at 82%, and net margin impresses at 36%, signaling strong cost control and operational leverage. The 2025 results highlight accelerating momentum and exceptional margin expansion.
F5, Inc. Analysis
F5 posts steady revenue growth from 2.6B in 2021 to 3.1B in 2025, with net income climbing to 692M. Gross margin remains healthy near 81%, while net margin lags at 22%, reflecting a less aggressive cost structure. The latest year shows consistent profitability with moderate margin gains and solid earnings per share growth.
High Growth Margins vs. Steady Profitability
Palantir outpaces F5 with a spectacular revenue and net income surge, backed by superior gross and net margins. F5 delivers dependable, more measured growth and profitability. Investors favoring rapid expansion and margin expansion will find Palantir’s profile more compelling, while those prioritizing stable earnings may lean toward F5’s steadier trajectory.
Financial Ratios Comparison
These vital ratios act as a diagnostic tool to expose the underlying fiscal health, valuation premiums, and capital efficiency of the companies compared below:
| Ratios | Palantir Technologies Inc. (PLTR) | F5, Inc. (FFIV) |
|---|---|---|
| ROE | 22.0% | 19.3% |
| ROIC | 17.9% | 13.8% |
| P/E | 259.2x | 26.9x |
| P/B | 57.0x | 5.2x |
| Current Ratio | 7.11 | 1.56 |
| Quick Ratio | 7.11 | 1.51 |
| D/E | 0.03 | 0.07 |
| Debt-to-Assets | 2.6% | 4.1% |
| Interest Coverage | 0 | 0 |
| Asset Turnover | 0.50 | 0.49 |
| Fixed Asset Turnover | 17.8 | 9.0 |
| Payout ratio | 0% | 0% |
| Dividend yield | 0% | 0% |
| Fiscal Year | 2025 | 2025 |
Efficiency & Valuation Duel: The Vital Signs
Financial ratios act as a company’s DNA, revealing operational strengths and hidden risks that shape investor confidence and valuation.
Palantir Technologies Inc.
Palantir commands a high ROE of 22.0% and a robust net margin of 36.31%, showcasing solid profitability. However, its valuation appears stretched, with a P/E ratio exceeding 259 and a P/B ratio above 57. The company reinvests heavily in R&D, foregoing dividends to fuel growth and innovation.
F5, Inc.
F5 delivers a strong ROE of 19.28% and a healthy net margin of 22.42%, reflecting operational efficiency. Its valuation is more reasonable, with a P/E near 27 and P/B around 5.2, though still somewhat elevated. Like Palantir, F5 does not pay dividends, reallocating cash to growth initiatives and maintaining solid liquidity.
Valuation Stretch vs. Operational Balance
Palantir’s ratios highlight high profitability but an expensive valuation, increasing risk. F5 offers a better valuation balance with strong profitability and favorable liquidity. Investors seeking growth with moderate valuation risk may find F5’s profile more fitting.
Which one offers the Superior Shareholder Reward?
Palantir Technologies Inc. (PLTR) pays no dividends and focuses on reinvestment, boasting a strong free cash flow per share of $0.89 and a current ratio above 7, signaling solid liquidity. Its share buyback program remains modest, reflecting a growth-first capital allocation. F5, Inc. (FFIV) also pays no dividends but executes a more aggressive buyback strategy, supported by a robust free cash flow per share of $15.7 and a healthier operating margin near 26%. FFIV’s lower price-to-free-cash-flow ratio (~20.6) versus PLTR’s sky-high valuation multiples suggests more attractive shareholder returns. I see FFIV’s balanced buybacks and operational strength as a more sustainable model delivering superior total return potential in 2026.
Comparative Score Analysis: The Strategic Profile
The radar chart reveals the fundamental DNA and trade-offs of both firms, highlighting their strategic strengths and vulnerabilities across key financial metrics:
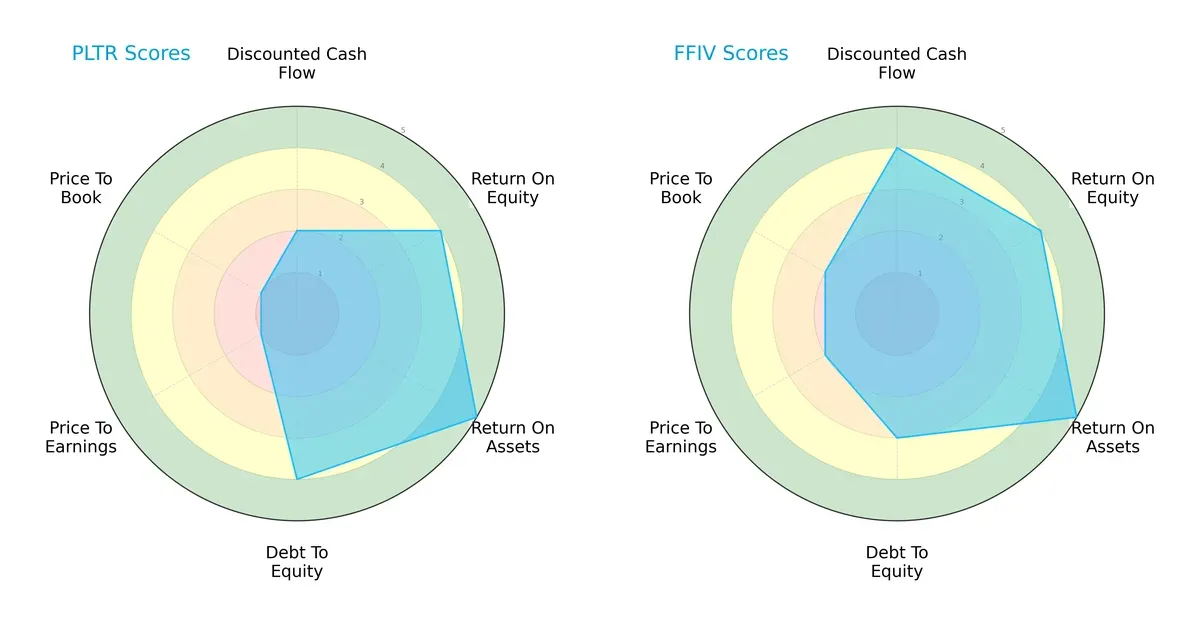
Palantir Technologies Inc. (PLTR) shows strengths in asset efficiency and conservative leverage with top scores in ROA (5) and Debt/Equity (4). However, its valuation metrics are weak, scoring a mere 1 in both P/E and P/B, indicating potential overvaluation risks. F5, Inc. (FFIV) presents a more balanced profile with favorable DCF (4), ROE (4), and asset returns (5), though it carries slightly higher leverage risk (Debt/Equity score 3) and modestly better valuation scores (P/E 2, P/B 2). I see FFIV as the more balanced firm, while PLTR relies heavily on operational efficiency but suffers from stretched valuation multiples.
Bankruptcy Risk: Solvency Showdown
The Altman Z-Score gap between PLTR (135.1) and FFIV (5.3) signals robust solvency for both, but PLTR’s extraordinarily high score suggests an exceptional buffer against bankruptcy risk in this cycle:
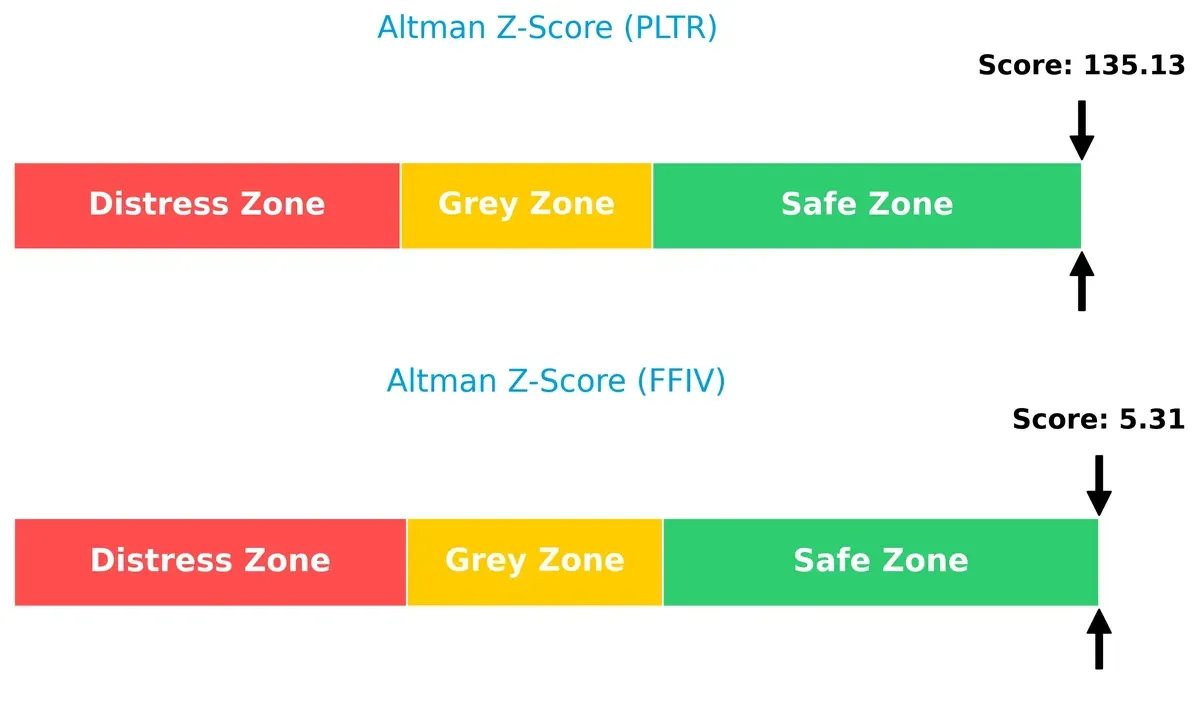
Both companies sit comfortably in the safe zone, yet PLTR’s score is unusually elevated. Historically, such a high Z-score signals strong liquidity and low default risk, giving investors confidence in its long-term survival amid economic volatility.
Financial Health: Quality of Operations
The Piotroski F-Score comparison shows PLTR at 7 (strong) and FFIV at 6 (average), indicating superior internal financial quality for PLTR, though neither firm hits the highest tier:
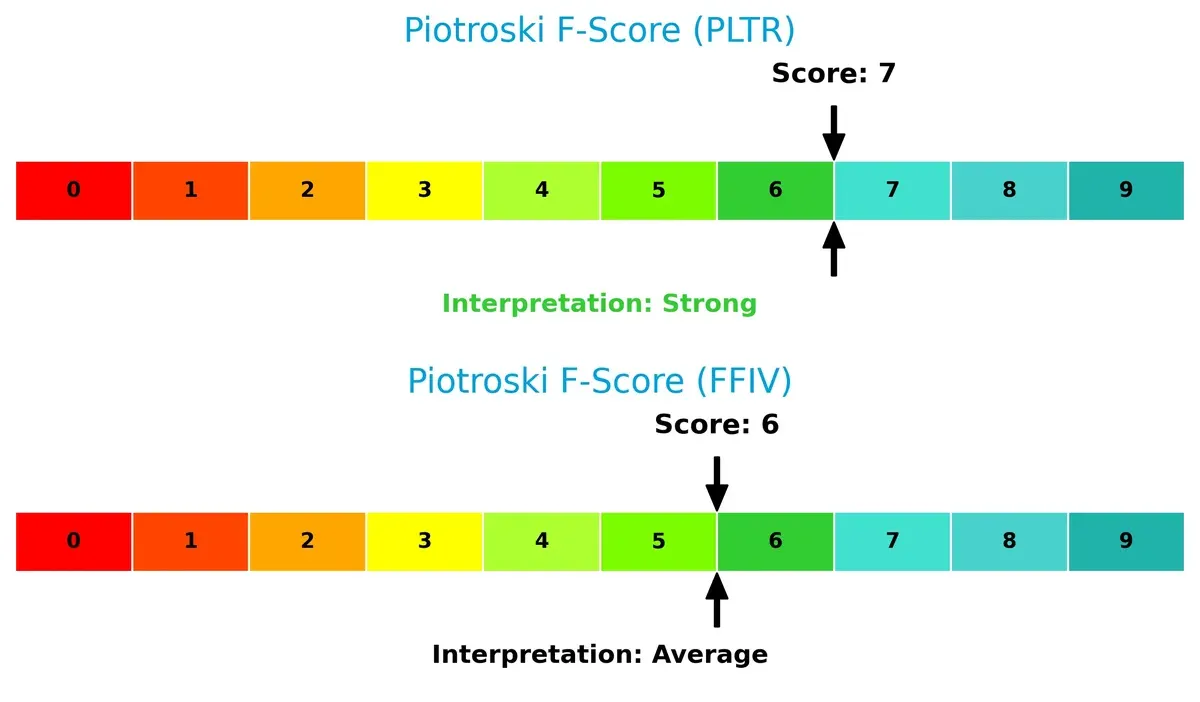
PLTR’s stronger score reflects better profitability, liquidity, and operational efficiency. FFIV’s average score suggests some internal red flags, possibly in leverage or asset turnover. I consider PLTR’s operational health more robust, which supports its growth narrative despite valuation concerns.
How are the two companies positioned?
This section dissects the operational DNA of Palantir and F5 by comparing revenue distribution and internal dynamics. The goal is to confront their economic moats and identify which model offers the most resilient, sustainable advantage today.
Revenue Segmentation: The Strategic Mix
The following visual comparison dissects how Palantir Technologies and F5, Inc. diversify their income streams and where their primary sector bets lie:
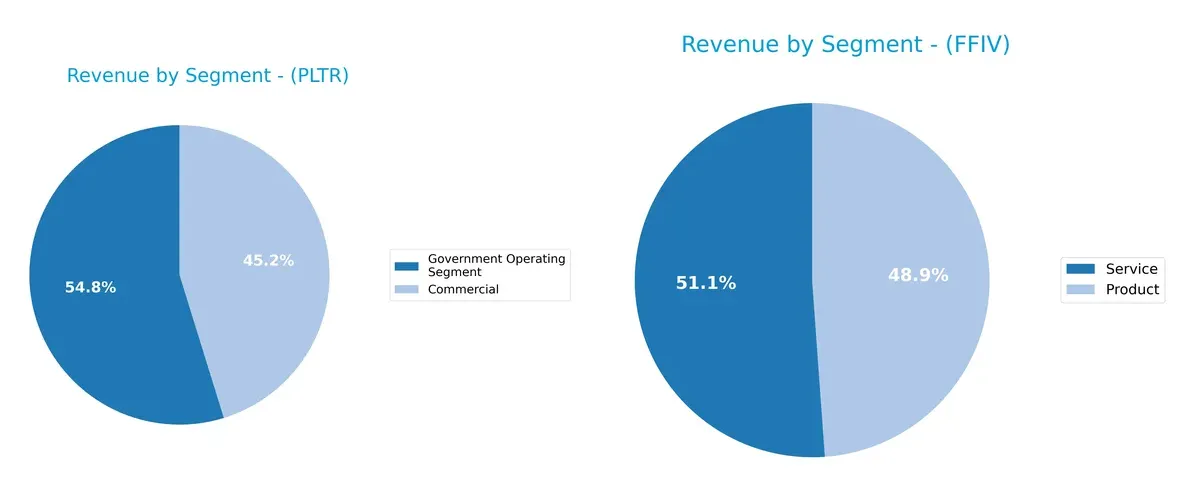
Palantir anchors its revenue in two distinct segments: Government Operating at $1.57B and Commercial at $1.30B in 2024. This mix shows a moderate diversification with a government focus, highlighting ecosystem lock-in within public contracts. F5, by contrast, balances its revenues evenly between Product at $1.27B and Service at $1.54B, demonstrating a well-diversified model that reduces concentration risk and leverages infrastructure dominance in network solutions.
Strengths and Weaknesses Comparison
This table compares the Strengths and Weaknesses of Palantir Technologies Inc. and F5, Inc.:
Palantir Strengths
- Strong profitability with 36.31% net margin
- High ROE at 22.0%
- Favorable ROIC of 17.95%
- Very low debt levels with 0.03 D/E
- High fixed asset turnover at 17.76
- Balanced commercial and government revenue streams
F5 Strengths
- Solid profitability with 22.42% net margin
- Healthy ROE of 19.28%
- Favorable ROIC at 13.8%
- Strong liquidity with 1.56 current ratio
- Diverse revenue from products and services
- Broad geographic presence across Americas, Asia Pacific, EMEA
Palantir Weaknesses
- Unfavorable high P/E at 259.19 and P/B at 57.02
- Elevated current ratio of 7.11 may indicate inefficient asset use
- WACC at 11.72% exceeds ROIC, raising cost concerns
- No dividend yield
- Asset turnover moderate at 0.5
F5 Weaknesses
- P/E of 26.91 and P/B of 5.19 are unfavorable
- Asset turnover low at 0.49
- No dividend yield
- WACC neutral at 8.43% and close to ROIC
Palantir excels in profitability and asset efficiency but shows valuation and capital cost concerns. F5 benefits from liquidity and geographic diversification, though faces valuation and asset utilization challenges. Both companies maintain strong capital structures supporting their strategic positioning.
The Moat Duel: Analyzing Competitive Defensibility
A structural moat is the only barrier guarding long-term profits from relentless competitive erosion. Let’s dissect how Palantir and F5 defend their turf:
Palantir Technologies Inc.: Intangible Assets Powerhouse
Palantir’s moat stems from its proprietary data integration and AI platforms, reflected in soaring ROIC at 6.2% above WACC. Its 214% ROIC growth signals widening advantage as new AI products expand market reach in 2026.
F5, Inc.: Cost and Scale Efficiency Leader
F5’s moat hinges on multi-cloud security and delivery solutions with a solid 5.4% ROIC premium over WACC. Growing ROIC by 50% shows steady operational strength, with cloud partnerships poised to deepen its infrastructure dominance.
Verdict: Intangible Assets vs. Scale and Cost Leadership
Palantir’s rapidly expanding intangible asset moat outpaces F5’s steady cost advantage. Palantir’s accelerating profitability better equips it to defend and expand market share in a fast-evolving software infrastructure landscape.
Which stock offers better returns?
The chart illustrates stark contrasts in price movements and trading dynamics for Palantir Technologies Inc. and F5, Inc. over the past year. Palantir saw extreme growth but recent pullbacks, while F5 experienced steady gains with accelerating momentum.
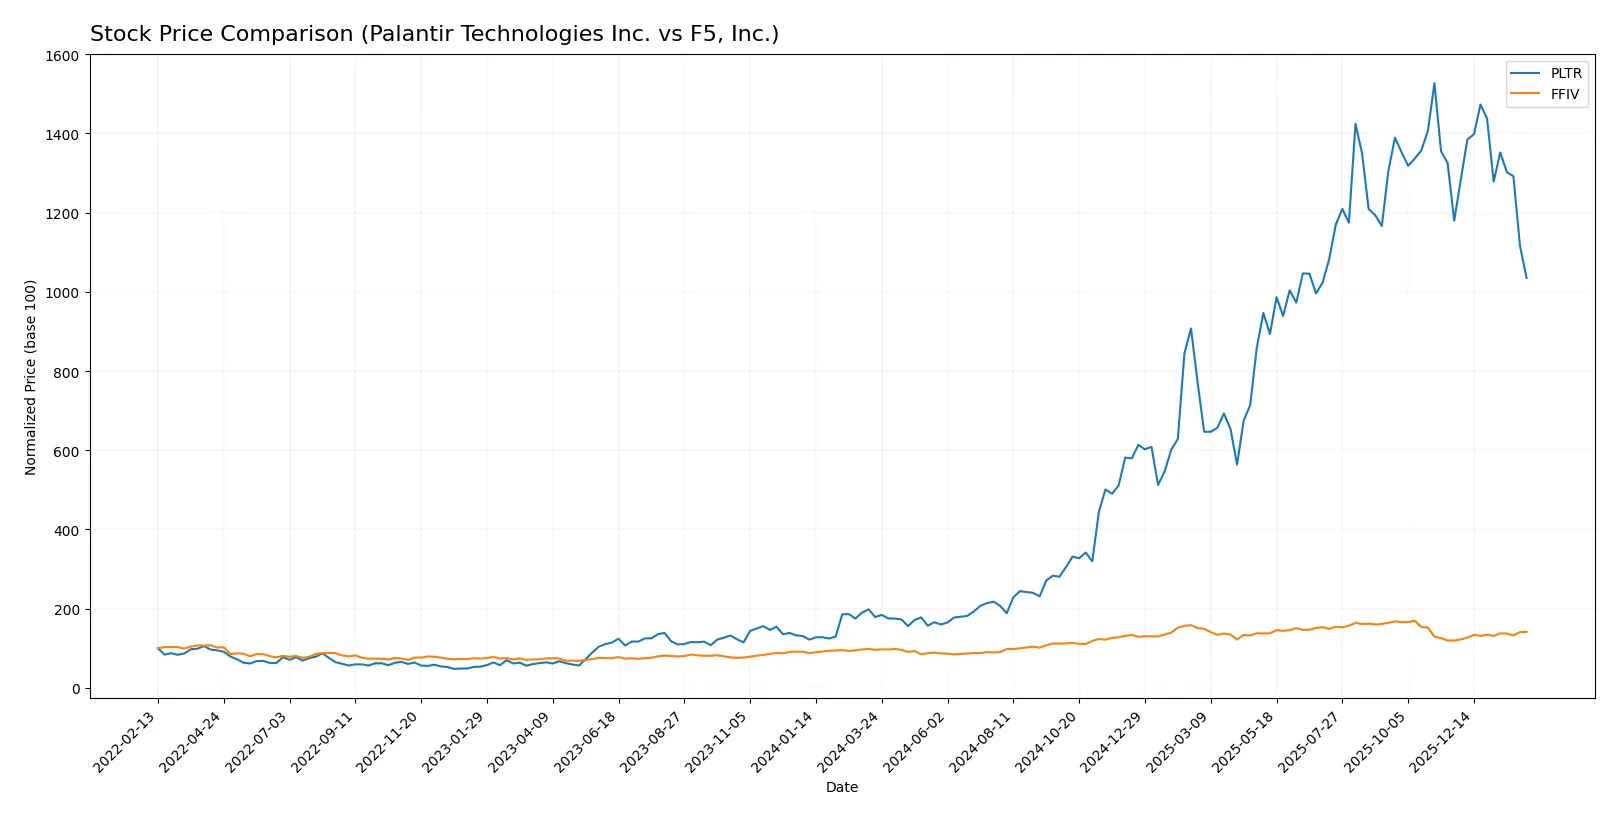
Trend Comparison
Palantir’s stock surged 478.54% over the last 12 months, marking a strong bullish trend despite deceleration and a recent 12.24% decline between November 2025 and February 2026. Volatility remains high with a 59.53 standard deviation.
F5’s stock rose 47.19% over the same period, maintaining a bullish trend with accelerating gains. It recorded an 18.05% increase in the recent quarter, supported by lower volatility at a 48.28 standard deviation.
Comparing both, Palantir delivered significantly higher market returns despite recent weakness. F5 showed steadier growth with positive momentum, but Palantir remains the stronger performer overall.
Target Prices
Analysts set confident target price ranges for Palantir Technologies Inc. and F5, Inc., reflecting strong upside potential.
| Company | Target Low | Target High | Consensus |
|---|---|---|---|
| Palantir Technologies Inc. | 180 | 230 | 200.15 |
| F5, Inc. | 295 | 352 | 330.67 |
The consensus targets for both stocks exceed current prices, indicating bullish analyst sentiment. Palantir trades at 136, well below its 200 consensus, while F5 at 277 shows room to grow towards 331.

Don’t Let Luck Decide Your Entry Point
Optimize your entry points with our advanced ProRealTime indicators. You’ll get efficient buy signals with precise price targets for maximum performance. Start outperforming now!
How do institutions grade them?
Palantir Technologies Inc. Grades
The latest grades from reputable firms for Palantir Technologies Inc. are as follows:
| Grading Company | Action | New Grade | Date |
|---|---|---|---|
| UBS | Maintain | Neutral | 2026-02-03 |
| Citigroup | Maintain | Buy | 2026-02-03 |
| DA Davidson | Maintain | Neutral | 2026-02-03 |
F5, Inc. Grades
Recent reliable grades issued for F5, Inc. reflect the following views:
| Grading Company | Action | New Grade | Date |
|---|---|---|---|
| Needham | Maintain | Hold | 2026-01-28 |
| RBC Capital | Maintain | Outperform | 2026-01-28 |
| Piper Sandler | Maintain | Overweight | 2026-01-28 |
Which company has the best grades?
F5, Inc. holds stronger grades overall, with multiple “Outperform” and “Overweight” ratings. Palantir’s grades cluster around “Neutral” and “Buy,” suggesting more cautious optimism. Investors may interpret F5’s higher ratings as greater confidence from analysts.
Risks specific to each company
The following categories identify the critical pressure points and systemic threats facing both firms in the 2026 market environment:
1. Market & Competition
Palantir Technologies Inc.
- Operates in a highly competitive software infrastructure market with rapid innovation cycles.
F5, Inc.
- Faces intense competition in multi-cloud application security and delivery, requiring constant product evolution.
2. Capital Structure & Debt
Palantir Technologies Inc.
- Maintains a very low debt-to-equity ratio of 0.03, indicating conservative leverage.
F5, Inc.
- Also low leverage at 0.07 but with slightly higher debt-to-assets ratio (4.14%).
3. Stock Volatility
Palantir Technologies Inc.
- Exhibits high beta of 1.687, signaling greater stock price volatility relative to the market.
F5, Inc.
- Lower beta at 1.008 suggests more stable stock price movements.
4. Regulatory & Legal
Palantir Technologies Inc.
- Exposure to government contracts may increase regulatory scrutiny and compliance costs.
F5, Inc.
- Subject to regulations on data security and cloud services across multiple jurisdictions.
5. Supply Chain & Operations
Palantir Technologies Inc.
- Software delivery model reduces physical supply chain risks but depends on data infrastructure reliability.
F5, Inc.
- Relies on hardware-software integration and cloud partnerships, exposing it to operational disruptions.
6. ESG & Climate Transition
Palantir Technologies Inc.
- Limited direct ESG risks but growing pressure to improve sustainability disclosures and data privacy standards.
F5, Inc.
- Faces pressure to reduce carbon footprint in hardware manufacturing and data center operations.
7. Geopolitical Exposure
Palantir Technologies Inc.
- Significant exposure due to involvement with US, UK, and international intelligence agencies.
F5, Inc.
- Global customer base exposes it to geopolitical tensions affecting cloud and security regulations.
Which company shows a better risk-adjusted profile?
Palantir’s key risk lies in high stock volatility and regulatory scrutiny due to government contracts. F5’s main concern is operational risk from hardware dependency and geopolitical complexities in cloud security. F5’s lower beta and solid capital structure suggest a better risk-adjusted profile. Palantir’s sky-high P/E ratio and beta highlight valuation and volatility risks that demand cautious allocation.
Final Verdict: Which stock to choose?
Palantir Technologies Inc. wields unmatched growth momentum fueled by a robust and expanding economic moat. Its superpower lies in delivering rapidly increasing returns on invested capital, signaling efficient capital allocation and strong competitive positioning. The steep valuation and an unusually high current ratio remain points of vigilance. It suits portfolios targeting aggressive growth and high reward potential.
F5, Inc. benefits from a solid strategic moat anchored in steady cash flow and operational resilience. Its moat stability and more reasonable valuation multiples offer a safety buffer compared to Palantir. F5 appeals to investors seeking growth at a reasonable price, blending growth prospects with a defensible capital structure and better short-term liquidity metrics.
If you prioritize high-growth potential and can tolerate valuation premiums and liquidity quirks, Palantir might be the compelling choice due to its accelerating profitability and strong value creation. However, if you seek a more balanced risk profile with reliable cash generation and moderate growth, F5 offers better stability and a more conservative valuation footing.
Disclaimer: Investment carries a risk of loss of initial capital. The past performance is not a reliable indicator of future results. Be sure to understand risks before making an investment decision.
Go Further
I encourage you to read the complete analyses of Palantir Technologies Inc. and F5, Inc. to enhance your investment decisions: