Home > Comparison > Technology > ORCL vs FFIV
The strategic rivalry between Oracle Corporation and F5, Inc. shapes the technology sector’s infrastructure landscape. Oracle operates as a capital-intensive giant, delivering broad cloud software and hardware solutions worldwide. In contrast, F5 focuses on high-margin, multi-cloud application security and delivery services. This head-to-head pits scale and diversification against specialized innovation. This analysis will identify which trajectory holds the superior risk-adjusted potential for a well-rounded portfolio in 2026.
Table of contents
Companies Overview
Oracle Corporation and F5, Inc. stand as pivotal players in the software infrastructure market.
Oracle Corporation: Enterprise IT Powerhouse
Oracle dominates enterprise IT with its comprehensive cloud software suite, including ERP, human capital management, and autonomous database technologies. Its revenue primarily stems from cloud applications, license sales, and hardware solutions. In 2026, Oracle focuses sharply on expanding its cloud services and integrating advanced AI and blockchain into its infrastructure to enhance enterprise digital transformation.
F5, Inc.: Multi-Cloud Security Specialist
F5 leads in multi-cloud application security and delivery, offering products that secure and optimize network applications across on-premises and public clouds. Its core revenue comes from advanced security appliances and software modules. The company’s 2026 strategy emphasizes strengthening partnerships with major cloud providers and advancing its application security portfolio to meet evolving cyber threats.
Strategic Collision: Similarities & Divergences
Oracle and F5 both operate in software infrastructure but diverge sharply in approach: Oracle leverages a broad, integrated cloud ecosystem, while F5 pursues a specialized multi-cloud security niche. Their competition centers on cloud adoption by enterprises seeking secure, scalable IT solutions. Oracle’s scale contrasts with F5’s agility, defining distinct investment profiles rooted in scope versus specialization.
Income Statement Comparison
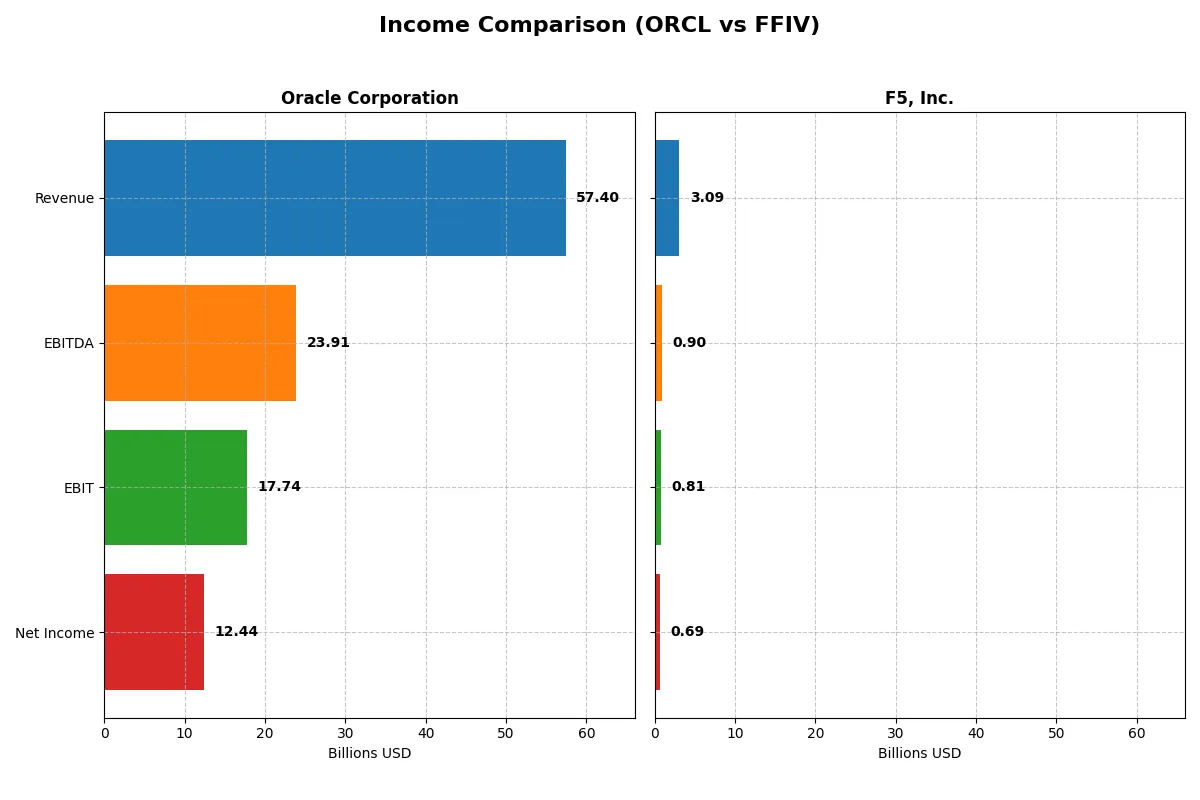
The following data dissects the core profitability and scalability of both corporate engines to reveal who dominates the bottom line:
| Metric | Oracle Corporation (ORCL) | F5, Inc. (FFIV) |
|---|---|---|
| Revenue | 57.4B | 3.1B |
| Cost of Revenue | 16.9B | 564M |
| Operating Expenses | 22.8B | 1.76B |
| Gross Profit | 40.5B | 2.52B |
| EBITDA | 23.9B | 901M |
| EBIT | 17.7B | 808M |
| Interest Expense | 3.58B | 0 |
| Net Income | 12.4B | 692M |
| EPS | 4.46 | 11.95 |
| Fiscal Year | 2025 | 2025 |
Income Statement Analysis: The Bottom-Line Duel
This income statement comparison reveals which company runs its business more efficiently and delivers superior profitability to shareholders.
Oracle Corporation Analysis
Oracle’s revenue climbed from $40.5B in 2021 to $57.4B in 2025, showing steady top-line growth. Net income fluctuated, peaking at $13.7B in 2021 but dipping to $12.4B in 2025. Gross margin held a healthy 70.5%, while its net margin of 21.7% confirms solid profitability. Recent years show strong momentum with expanding EBIT and EPS growth.
F5, Inc. Analysis
F5’s revenue rose from $2.6B in 2021 to $3.1B in 2025, reflecting moderate growth. Net income surged impressively from $331M to $692M, doubling over five years. Gross margin at 81.7% and net margin of 22.4% highlight excellent cost control and profitability. The latest fiscal year saw robust EBIT and EPS gains, signaling accelerating operational efficiency.
Margin Strength vs. Growth Momentum
Oracle boasts scale with higher absolute profits and strong margins but shows net income volatility over the period. F5 delivers superior margin expansion and consistent net income growth, though on a smaller revenue base. For investors, Oracle offers stability and size, while F5 presents a compelling growth and margin improvement profile.
Financial Ratios Comparison
These vital ratios act as a diagnostic tool to expose the underlying fiscal health, valuation premiums, and capital efficiency of the companies compared below:
| Ratios | Oracle Corporation (ORCL) | F5, Inc. (FFIV) |
|---|---|---|
| ROE | 60.8% | 19.3% |
| ROIC | 10.9% | 14.0% |
| P/E | 37.1 | 26.9 |
| P/B | 22.6 | 5.2 |
| Current Ratio | 0.75 | 1.56 |
| Quick Ratio | 0.75 | 1.51 |
| D/E (Debt to Equity Ratio) | 5.09 | 0.06 |
| Debt-to-Assets | 61.8% | 3.7% |
| Interest Coverage | 4.94 | N/A |
| Asset Turnover | 0.34 | 0.49 |
| Fixed Asset Turnover | 1.32 | 9.02 |
| Payout Ratio | 38.1% | 0% |
| Dividend Yield | 1.03% | 0% |
| Fiscal Year | 2025 | 2025 |
Efficiency & Valuation Duel: The Vital Signs
Financial ratios serve as a company’s DNA, exposing hidden risks and operational strengths crucial for informed investing decisions.
Oracle Corporation
Oracle exhibits a robust 60.8% ROE and a strong 21.7% net margin, signaling excellent profitability. However, its valuation appears stretched with a high P/E of 37.1 and P/B of 22.6. The company delivers a modest 1.03% dividend yield, balancing returns amid reinvestment in R&D, which consumes 17.2% of revenue.
F5, Inc.
F5 posts a solid 19.3% ROE and a 22.4% net margin, reflecting efficient operations. Its valuation is lower yet still premium, with a P/E of 26.9 and P/B of 5.2. The firm pays no dividends, favoring growth through significant R&D spending at 17.5% of revenue, supporting future innovation and expansion.
Valuation Stretch vs. Operational Efficiency
Oracle’s exceptional profitability contrasts with a stretched valuation and weaker liquidity, elevating risk. F5 balances strong returns with a more reasonable valuation and superior liquidity, offering a healthier risk profile. Risk-tolerant investors may prefer Oracle’s yield and scale, while growth-focused investors may favor F5’s operational efficiency and reinvestment strategy.
Which one offers the Superior Shareholder Reward?
Oracle (ORCL) and F5, Inc. (FFIV) follow contrasting shareholder reward strategies. Oracle pays a modest dividend yield around 1.0–1.3% with a payout ratio near 38–42%, supported by stable free cash flow, though its free cash flow per share turned slightly negative in 2025, signaling caution. Oracle supplements returns with moderate buybacks, but heavy leverage (debt to equity ~5x) raises risk. F5 forgoes dividends entirely, funneling nearly all free cash flow into share buybacks and growth initiatives, delivering a high free cash flow per share (~$15.7 in 2025) and low debt levels (debt to equity below 0.1). I observe that F5’s aggressive buyback and reinvestment model suits long-term value creation better than Oracle’s leveraged dividend approach. In 2026, F5 offers a superior total return profile due to its sustainable capital allocation and lower financial risk.
Comparative Score Analysis: The Strategic Profile
The radar chart reveals the fundamental DNA and trade-offs of Oracle Corporation and F5, Inc., highlighting their strategic strengths and vulnerabilities:
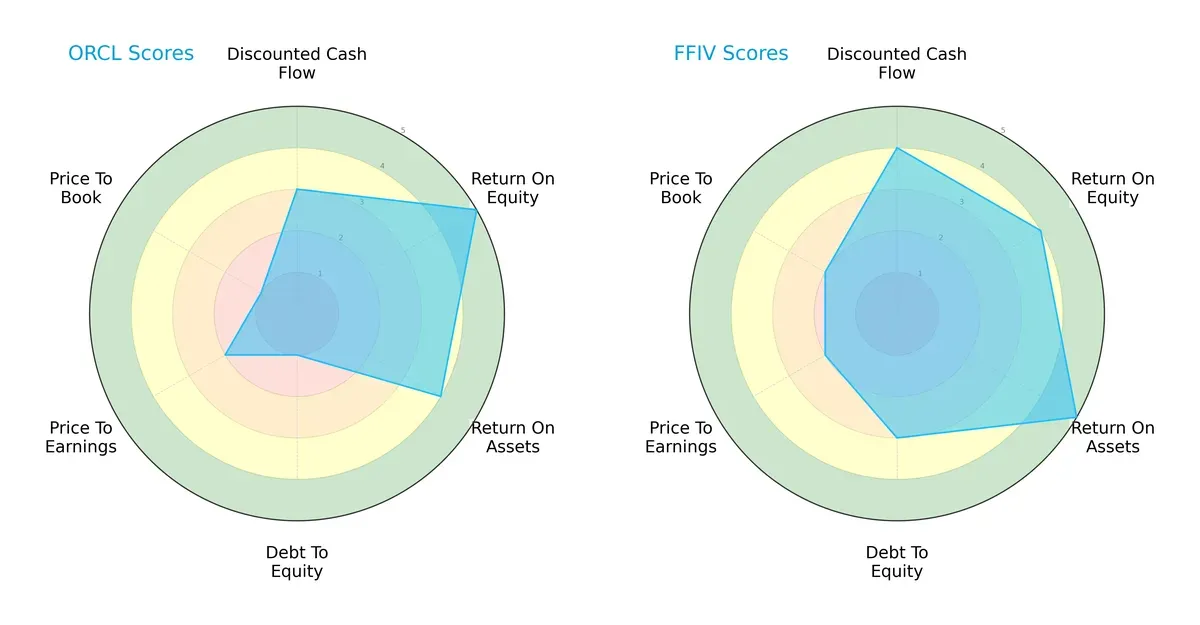
Oracle excels in return on equity with a top score of 5, demonstrating strong profitability on shareholder capital. F5 leads in return on assets (5 versus Oracle’s 4), indicating superior asset utilization. Oracle’s balance sheet is a red flag with a very unfavorable debt-to-equity score of 1, whereas F5 maintains a more moderate 3, signaling better financial stability. Valuation scores show both firms facing moderate to unfavorable conditions, but F5 edges Oracle with slightly better price-to-book metrics. Overall, F5 presents a more balanced profile, while Oracle relies heavily on its equity profitability advantage despite financial leverage risks.
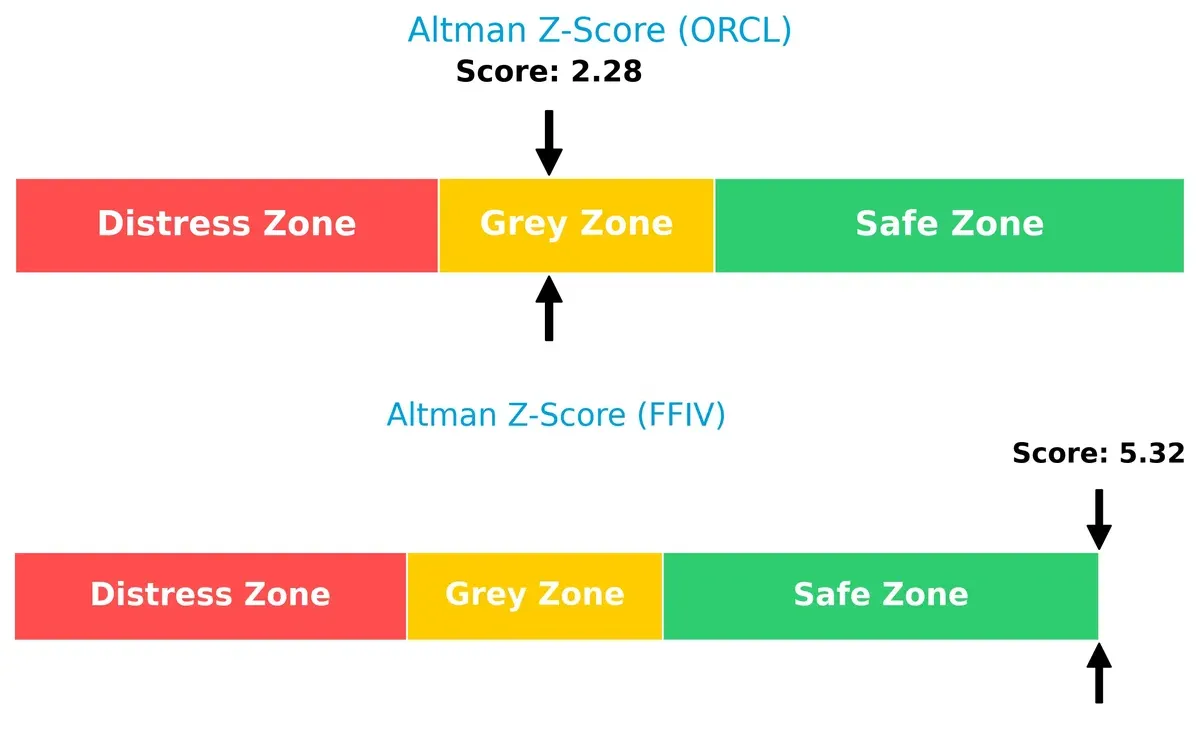
Bankruptcy Risk: Solvency Showdown
F5’s Altman Z-Score of 5.32 places it safely above distress levels, signaling strong long-term solvency. Oracle’s 2.28 score sits in the grey zone, implying moderate bankruptcy risk under current market pressures:
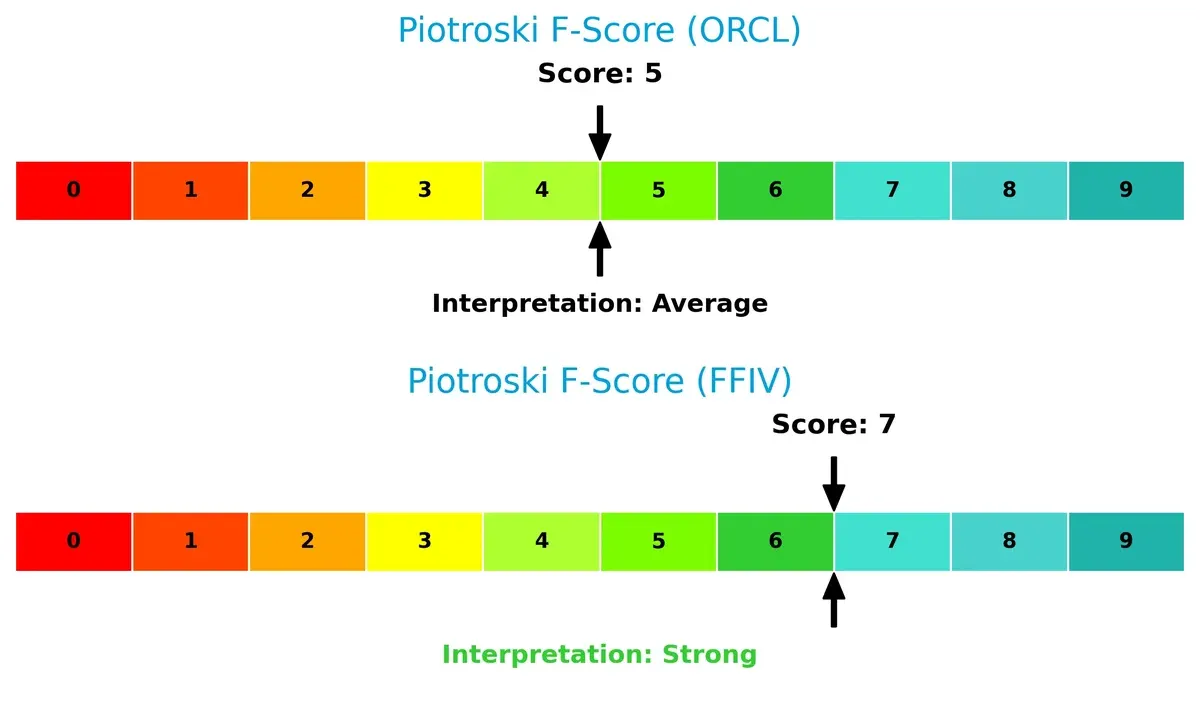
Financial Health: Quality of Operations
F5’s Piotroski F-Score of 7 indicates robust financial health with strong internal metrics. Oracle’s score of 5 flags average operational quality and potential red flags in profitability or liquidity compared to F5:
How are the two companies positioned?
This section dissects the operational DNA of Oracle and F5 by comparing their revenue distribution and internal dynamics. The goal is to confront their economic moats to identify which model offers the most resilient competitive advantage today.
Revenue Segmentation: The Strategic Mix
The following visual comparison dissects how Oracle Corporation and F5, Inc. diversify their income streams and where their primary sector bets lie:
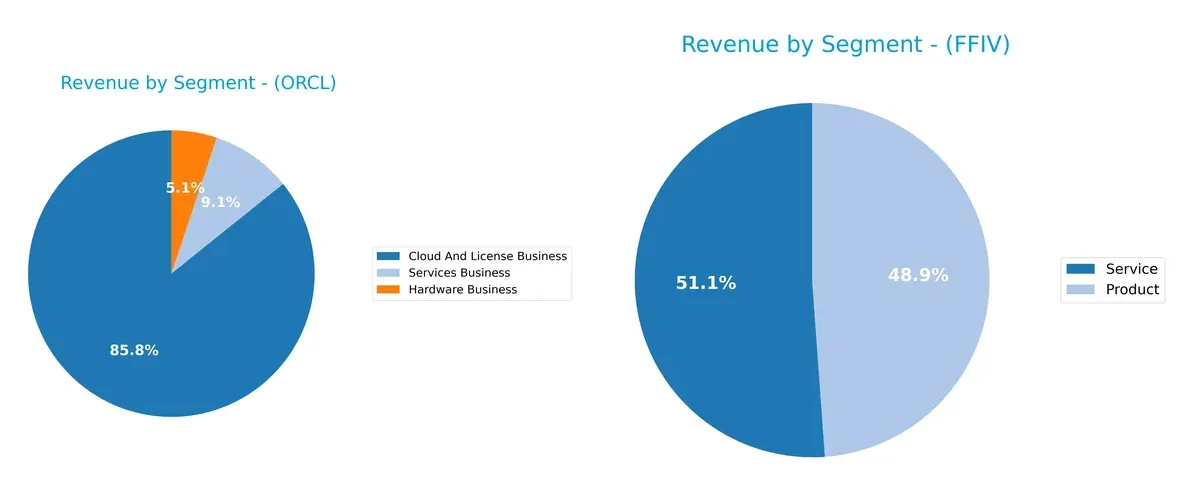
Oracle’s revenue dwarfs F5’s, anchored heavily by its Cloud and License Business at $49.2B in 2025. This segment dominates Oracle’s portfolio, signaling strong ecosystem lock-in. Oracle’s Hardware ($2.9B) and Services ($5.2B) segments add modest diversification. In contrast, F5’s revenue nearly evenly pivots between Product ($1.5B) and Service ($1.6B), reflecting a balanced mix that mitigates concentration risk but lacks Oracle’s scale or infrastructure dominance.
Strengths and Weaknesses Comparison
This table compares the strengths and weaknesses of Oracle Corporation and F5, Inc.:
Oracle Corporation Strengths
- Dominant Cloud and License business with $49.2B in 2025
- Strong global presence, $36.3B Americas revenue
- High net margin at 21.68%
- Exceptional ROE at 60.84%
- Solid ROIC of 10.86%
F5, Inc. Strengths
- Balanced Product and Service revenues around $1.5B each in 2025
- Favorable liquidity ratios with current ratio 1.56 and quick ratio 1.51
- Low debt level with D/E at 0.06 and debt/assets at 3.65%
- Strong ROIC at 13.99%
- High fixed asset turnover at 9.02
Oracle Corporation Weaknesses
- Weak liquidity, current and quick ratios at 0.75
- High leverage, debt to assets at 61.83%
- Valuation appears rich with PE 37.1 and PB 22.57
- Asset turnover low at 0.34
- WACC slightly above ROIC at 10.12%
- Moderate interest coverage at 4.96
F5, Inc. Weaknesses
- PE at 26.91 and PB at 5.19 indicate valuation concerns
- Zero dividend yield may deter income investors
- Asset turnover low at 0.49
- Small scale global revenue, $1.8B Americas largest market
- Lower ROE at 19.28% compared to Oracle
Oracle’s scale and high profitability stem from its broad cloud and license portfolio and strong global presence. However, its financial leverage and valuation metrics raise red flags. F5 benefits from healthier balance sheet ratios and efficient asset use but operates at a smaller scale with valuation and dividend yield drawbacks. Both face challenges in asset turnover, highlighting potential operational efficiency improvements.
The Moat Duel: Analyzing Competitive Defensibility
A structural moat is the only reliable shield protecting long-term profits from relentless competitive erosion. Let’s dissect how these companies defend their turf:
Oracle Corporation: Intangible Assets Fuelling Enterprise Dominance
Oracle’s moat centers on its vast ecosystem of proprietary software and cloud infrastructure. This manifests in robust gross margins of 70.5% and stable net margins near 22%. Yet, its declining ROIC signals emerging pressures. Oracle’s push into autonomous databases and industry-specific clouds aims to deepen this moat in 2026.
F5, Inc.: Network Effects Powering Application Security
F5’s competitive edge lies in its specialized multi-cloud security solutions with embedded network effects across large enterprises. Its superior gross margin of 81.7% and growing ROIC by 52% show strong value creation. F5’s expansion into SaaS offerings and cloud partnerships could disrupt traditional security models further in 2026.
Economic Moats at War: Intangible Assets vs. Network Effects
F5 boasts a wider and deeper moat with a very favorable ROIC trend, reflecting efficient capital use and durable competitive advantages. Oracle’s intangible assets provide scale but face margin and profitability headwinds. F5 is better equipped to defend and grow its market share amid increasing cloud security demand.
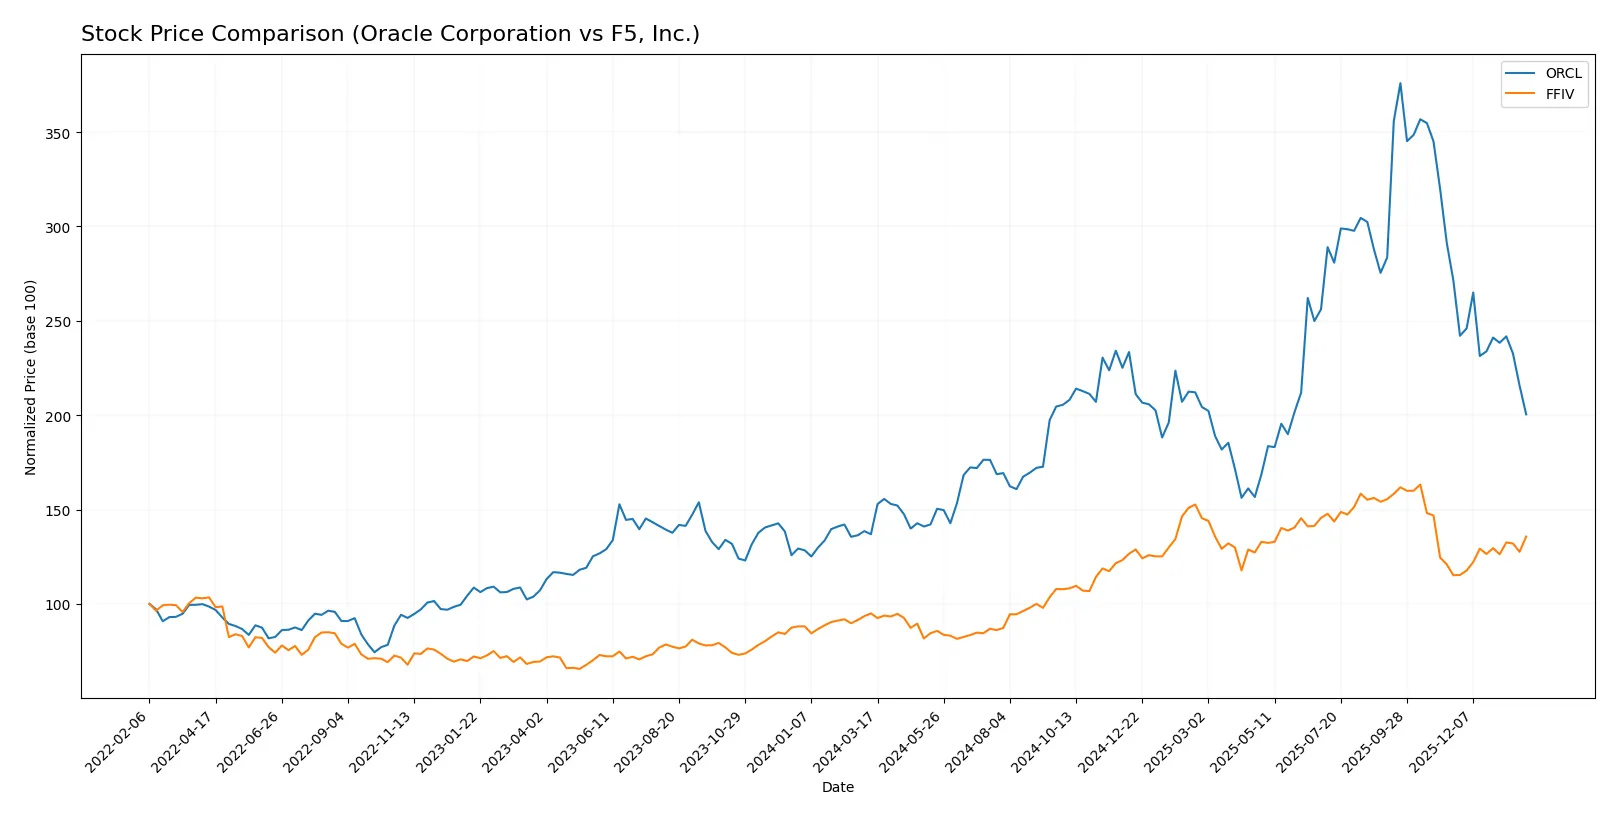
Which stock offers better returns?
Over the past 12 months, Oracle and F5 displayed strong price gains with distinct momentum shifts and contrasting recent trading dynamics.
Trend Comparison
Oracle’s stock gained 46.4% over the last year, marking a bullish trend with decelerating momentum. It reached a high of 308.66 and a low of 112.42.
F5’s stock rose 42.85% over the same period, also bullish but accelerating. The price ranged between 165.57 and 331.75, showing stronger recent momentum.
Oracle’s recent trend reversed, falling 26.15%, while F5 gained 17.78%. F5 currently leads in market performance and buyer dominance.
Target Prices
Analysts present a bullish consensus for Oracle Corporation and F5, Inc., suggesting significant upside potential from current prices.
| Company | Target Low | Target High | Consensus |
|---|---|---|---|
| Oracle Corporation | 175 | 400 | 310.33 |
| F5, Inc. | 295 | 352 | 330.67 |
Oracle’s target consensus of 310.33 exceeds its current price of 164.58 by 88%, reflecting strong growth expectations. F5’s consensus target of 330.67 stands about 20% above its current 275.61, indicating moderate optimism.

Don’t Let Luck Decide Your Entry Point
Optimize your entry points with our advanced ProRealTime indicators. You’ll get efficient buy signals with precise price targets for maximum performance. Start outperforming now!
How do institutions grade them?
Oracle Corporation Grades
The following table summarizes recent grades assigned to Oracle Corporation by major institutions.
| Grading Company | Action | New Grade | Date |
|---|---|---|---|
| Morgan Stanley | maintain | Equal Weight | 2026-01-23 |
| UBS | maintain | Buy | 2026-01-05 |
| Jefferies | maintain | Buy | 2026-01-05 |
| RBC Capital | maintain | Sector Perform | 2026-01-05 |
| Goldman Sachs | maintain | Neutral | 2025-12-12 |
| UBS | maintain | Buy | 2025-12-11 |
| Piper Sandler | maintain | Overweight | 2025-12-11 |
| Keybanc | maintain | Overweight | 2025-12-11 |
| Stifel | maintain | Buy | 2025-12-11 |
| JP Morgan | maintain | Neutral | 2025-12-11 |
F5, Inc. Grades
The table below presents recent institutional grades for F5, Inc.
| Grading Company | Action | New Grade | Date |
|---|---|---|---|
| Needham | maintain | Hold | 2026-01-28 |
| Piper Sandler | maintain | Overweight | 2026-01-28 |
| Goldman Sachs | maintain | Neutral | 2026-01-28 |
| Barclays | maintain | Equal Weight | 2026-01-28 |
| RBC Capital | maintain | Outperform | 2026-01-28 |
| JP Morgan | upgrade | Overweight | 2026-01-15 |
| Piper Sandler | upgrade | Overweight | 2026-01-05 |
| RBC Capital | upgrade | Outperform | 2026-01-05 |
| Morgan Stanley | maintain | Equal Weight | 2025-12-17 |
| Morgan Stanley | maintain | Equal Weight | 2025-10-28 |
Which company has the best grades?
Oracle Corporation consistently receives Buy and Overweight ratings from several major firms, reflecting steady confidence. F5, Inc. shows recent upgrades and Outperform ratings but also includes Hold and Equal Weight grades, indicating mixed institutional views. Investors may interpret Oracle’s broader Buy consensus as stronger institutional endorsement.
Risks specific to each company
In 2026’s volatile market, these categories pinpoint the critical pressure points and systemic threats confronting Oracle Corporation and F5, Inc.:
1. Market & Competition
Oracle Corporation
- Faces intense competition from global cloud and infrastructure providers, pressuring margins.
F5, Inc.
- Operates in a niche multi-cloud security space but contends with big cloud vendors expanding capabilities.
2. Capital Structure & Debt
Oracle Corporation
- High debt levels with debt-to-assets at 61.8% raise financial risk and lower flexibility.
F5, Inc.
- Minimal debt burden with debt-to-assets at 3.65%, providing strong financial stability.
3. Stock Volatility
Oracle Corporation
- Elevated beta at 1.65 signals above-market volatility and sensitivity to tech sector swings.
F5, Inc.
- Lower beta of 0.98 indicates less price fluctuation and steadier investor sentiment.
4. Regulatory & Legal
Oracle Corporation
- Subject to strict data privacy and cloud compliance regulations globally, increasing legal costs.
F5, Inc.
- Faces regulatory scrutiny in cybersecurity standards but benefits from strong compliance track record.
5. Supply Chain & Operations
Oracle Corporation
- Complex hardware and software supply chain vulnerable to geopolitical disruptions and component shortages.
F5, Inc.
- Focused on software and appliances with diversified supply, reducing direct hardware risks.
6. ESG & Climate Transition
Oracle Corporation
- Increasing pressure to improve carbon footprint and social governance amid global ESG mandates.
F5, Inc.
- Proactively integrating ESG initiatives, positioning well for climate-conscious enterprise customers.
7. Geopolitical Exposure
Oracle Corporation
- Significant global operations expose it to trade tensions and regulatory barriers.
F5, Inc.
- More concentrated US and allied markets reduce geopolitical risk but limit global diversification.
Which company shows a better risk-adjusted profile?
Oracle’s most significant risk is its heavy leverage, which threatens financial agility in downturns. F5’s primary concern lies in intense competition from larger cloud providers encroaching on its market. F5’s favorable debt metrics and Altman Z-Score place it in a safer financial zone. Oracle’s high beta and debt burden amplify risk. Recent ratio data highlight Oracle’s precarious capital structure versus F5’s robust balance sheet. Overall, F5, Inc. exhibits a superior risk-adjusted profile in 2026.
Final Verdict: Which stock to choose?
Oracle’s superpower lies in its entrenched market presence and robust cash flow generation despite rising debt levels. However, its weak liquidity and declining ROIC signal a need for vigilance. It suits portfolios aiming for established enterprise software exposure with moderate risk tolerance.
F5 stands out with a durable moat driven by strong capital efficiency and a growing ROIC that outpaces its cost of capital. Its conservative balance sheet offers better financial stability than Oracle. F5 fits well in growth-at-a-reasonable-price (GARP) portfolios seeking steadily improving profitability.
If you prioritize steady value creation and balance sheet strength, F5 offers better stability with a rising ROIC and lower leverage. However, if you seek large-cap scale with broad enterprise reach and can tolerate liquidity risks, Oracle commands a premium despite its challenges. Each appeals to distinct investor profiles focused on either growth durability or market dominance.
Disclaimer: Investment carries a risk of loss of initial capital. The past performance is not a reliable indicator of future results. Be sure to understand risks before making an investment decision.
Go Further
I encourage you to read the complete analyses of Oracle Corporation and F5, Inc. to enhance your investment decisions: