Home > Comparison > Technology > FFIV vs OKTA
The strategic rivalry between F5, Inc. and Okta, Inc. shapes the evolution of the technology sector’s software infrastructure landscape. F5 operates as a capital-intensive provider of multi-cloud application security and delivery solutions, while Okta leads as a high-margin identity management platform. This analysis explores their contrasting growth models and technological approaches to determine which offers superior risk-adjusted returns for a diversified portfolio.

Table of contents
Companies Overview
F5, Inc. and Okta, Inc. both shape critical infrastructure software markets with distinct approaches to enterprise security and operations.
F5, Inc.: Multi-Cloud Application Security Leader
F5, Inc. dominates the multi-cloud application security and delivery space. It generates revenue through hardware appliances and software solutions that secure and optimize network applications and servers. In 2026, F5 focuses strategically on expanding cloud partnerships with AWS, Azure, and Google Cloud to enhance its hybrid and multi-cloud deployment capabilities.
Okta, Inc.: Identity and Access Management Pioneer
Okta, Inc. leads in identity solutions for enterprises and public sector clients. Its core revenue comes from the Okta Identity Cloud platform offering authentication, lifecycle management, and API security services. Okta’s 2026 strategy emphasizes expanding its Auth0 product line to provide seamless, adaptive, and passwordless authentication across cloud and on-premises systems.
Strategic Collision: Similarities & Divergences
Both companies operate in software infrastructure but diverge in focus: F5 secures application delivery across multi-cloud environments while Okta concentrates on identity and access management. Their primary battleground is enterprise cybersecurity, where cloud integration and user access control meet. F5 presents a hardware-software hybrid model, while Okta offers a cloud-first, software-as-a-service profile, creating distinct investment dynamics.
Income Statement Comparison
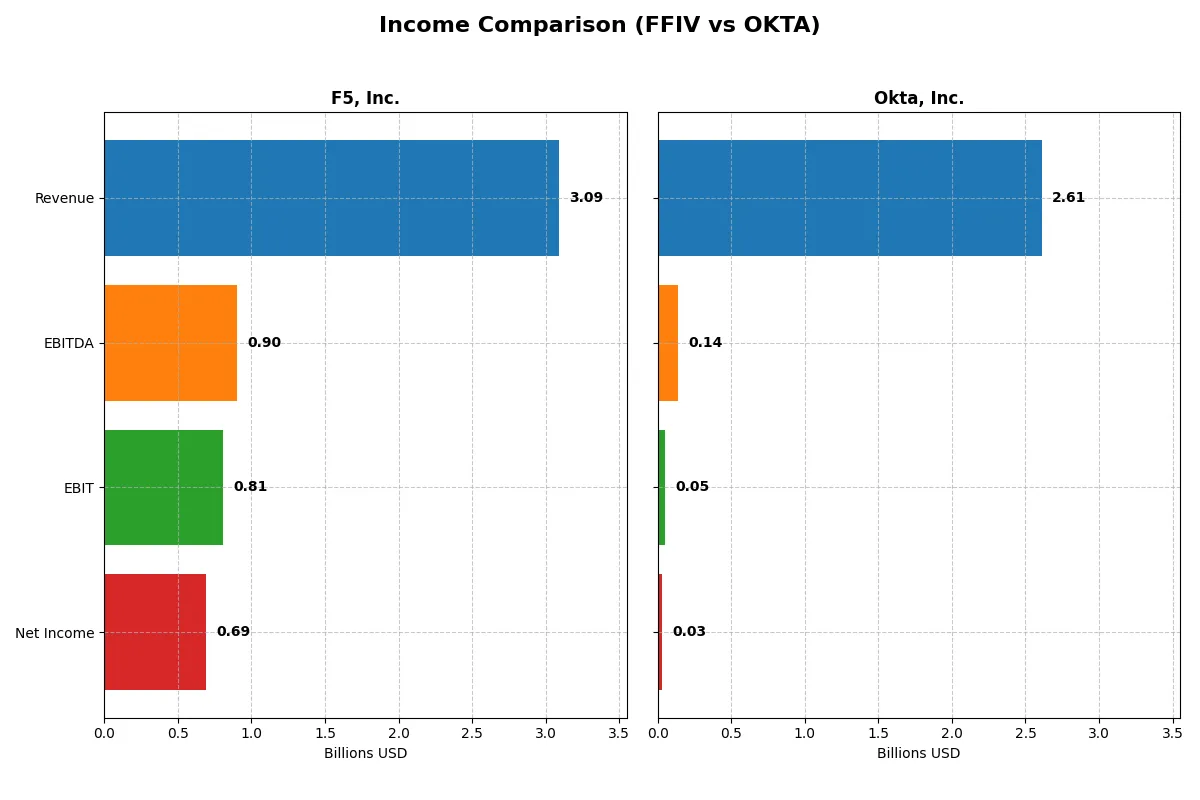
This data dissects the core profitability and scalability of both corporate engines to reveal who dominates the bottom line:
| Metric | F5, Inc. (FFIV) | Okta, Inc. (OKTA) |
|---|---|---|
| Revenue | 3.09B | 2.61B |
| Cost of Revenue | 564M | 618M |
| Operating Expenses | 1.76B | 2.07B |
| Gross Profit | 2.52B | 1.99B |
| EBITDA | 901M | 139M |
| EBIT | 808M | 51M |
| Interest Expense | 0 | 5M |
| Net Income | 692M | 28M |
| EPS | 11.95 | 0.17 |
| Fiscal Year | 2025 | 2025 |
Income Statement Analysis: The Bottom-Line Duel
This income statement comparison exposes the true efficiency and growth dynamics behind two distinct corporate engines in the tech sector.
F5, Inc. Analysis
F5, Inc. steadily grows revenue, reaching $3.09B in 2025, up 9.7% year-over-year. Net income surged 22%, hitting $692M, driven by robust gross margins of 81.7%. The 26.2% EBIT margin confirms strong operational efficiency, despite slightly rising operating expenses matched by revenue growth. Momentum remains firmly positive.
Okta, Inc. Analysis
Okta expands revenue aggressively, up 15.3% to $2.61B in 2025, reflecting rapid scale. Net income turned positive at $28M, a significant turnaround from prior losses, but net margin remains slim at 1.1%. Gross margin of 76.3% is healthy, though EBIT margin at 2.0% signals ongoing investment and margin pressure despite improving profitability.
Margin Dominance vs. Growth Surge
F5 commands superior profitability with powerful margins and consistent net income growth, exemplifying operational excellence. Okta impresses with rapid revenue expansion and a nascent return to profitability, yet its thin margins highlight ongoing scaling costs. For investors, F5’s profile appeals for stable, efficient returns; Okta presents a higher-growth, higher-risk opportunity.
Financial Ratios Comparison
These vital ratios act as a diagnostic tool to expose the underlying fiscal health, valuation premiums, and capital efficiency of the companies compared below:
| Ratios | F5, Inc. (FFIV) | Okta, Inc. (OKTA) |
|---|---|---|
| ROE | 19.3% | 0.4% |
| ROIC | 14.0% | -0.6% |
| P/E | 26.9 | 570.6 |
| P/B | 5.19 | 2.49 |
| Current Ratio | 1.56 | 1.35 |
| Quick Ratio | 1.51 | 1.35 |
| D/E (Debt-to-Equity) | 0.06 | 0.15 |
| Debt-to-Assets | 3.7% | 10.1% |
| Interest Coverage | N/A | -14.8 |
| Asset Turnover | 0.49 | 0.28 |
| Fixed Asset Turnover | 9.02 | 22.31 |
| Payout ratio | 0 | 0 |
| Dividend yield | 0 | 0 |
| Fiscal Year | 2025 | 2025 |
Efficiency & Valuation Duel: The Vital Signs
Financial ratios act as the company’s DNA, unveiling hidden risks and operational excellence critical for investors’ strategic decisions.
F5, Inc.
F5 delivers robust profitability with a 19.28% ROE and a strong 22.42% net margin, demonstrating operational efficiency. However, its P/E ratio of 26.91 signals a somewhat stretched valuation compared to broader markets. The company returns value mainly through reinvestment, prioritizing R&D over dividends, supporting sustainable growth.
Okta, Inc.
Okta struggles with profitability, posting a meager 0.44% ROE and a 1.07% net margin, reflecting weak operational results. Its sky-high P/E of 570.6 marks the stock as extremely expensive. With no dividends, the firm channels resources heavily into growth and R&D, though returns remain subdued, raising concerns about near-term shareholder payoffs.
Premium Valuation vs. Operational Safety
F5 offers a stronger balance of profitability and operational health despite a stretched valuation. Okta’s lofty multiples and weak returns signal higher risk. Investors seeking stability may prefer F5’s profile, while growth-oriented investors must weigh Okta’s premium valuation against uncertain earnings.
Which one offers the Superior Shareholder Reward?
I observe that F5, Inc. (FFIV) pays no dividends but generates strong free cash flow (15.7/share in 2025) with a robust payout capacity and reinvests prudently. Okta, Inc. (OKTA) also pays no dividends and posts minimal free cash flow (4.3/share), focusing heavily on growth investments amid slim profit margins. FFIV lacks buybacks but maintains pristine financial health and free cash flow coverage, signaling sustainable shareholder rewards. OKTA’s aggressive growth stance and weaker profitability, combined with negligible buybacks, imply higher risk. I conclude FFIV offers the more attractive and sustainable total return profile for investors in 2026.
Comparative Score Analysis: The Strategic Profile
The radar chart reveals the fundamental DNA and trade-offs of both firms, highlighting their core financial strengths and valuation challenges:
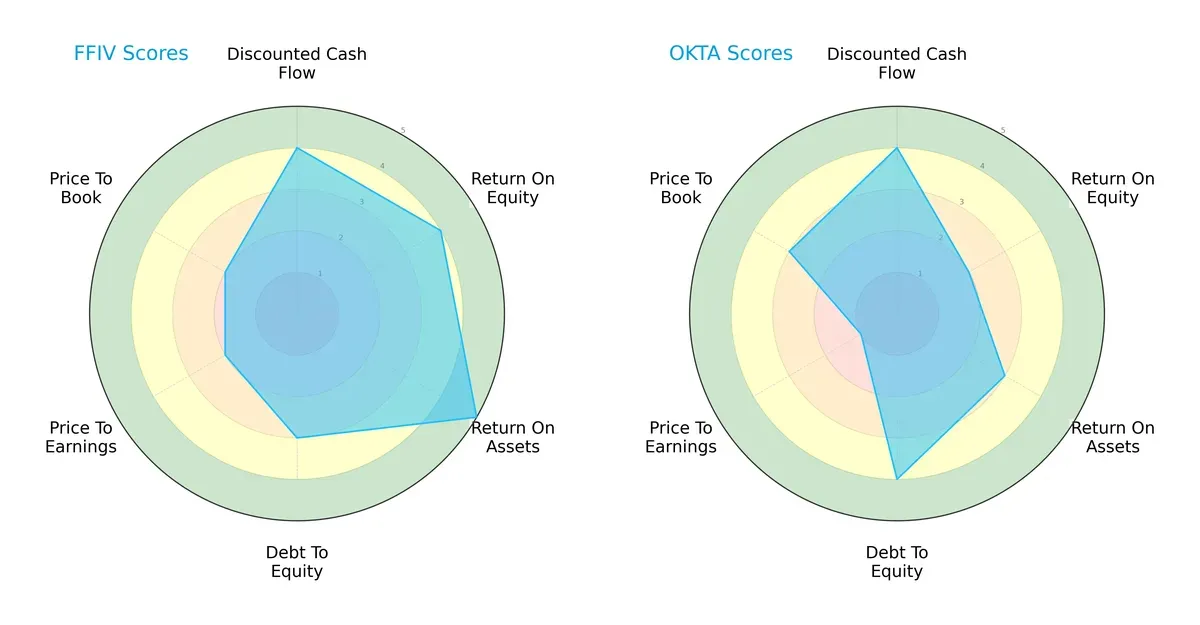
F5, Inc. demonstrates a more balanced profile with strong ROE (4) and ROA (5) scores, signaling efficient asset and equity use. Okta, Inc. relies more on a solid debt-to-equity position (4) but lags in profitability metrics like ROE (2) and ROA (3). Both share a favorable DCF score (4), yet F5’s moderate valuation scores (P/E 2, P/B 2) contrast with Okta’s weaker P/E (1) and better P/B (3). F5 delivers steadier operational efficiency; Okta’s strength lies in financial leverage management.
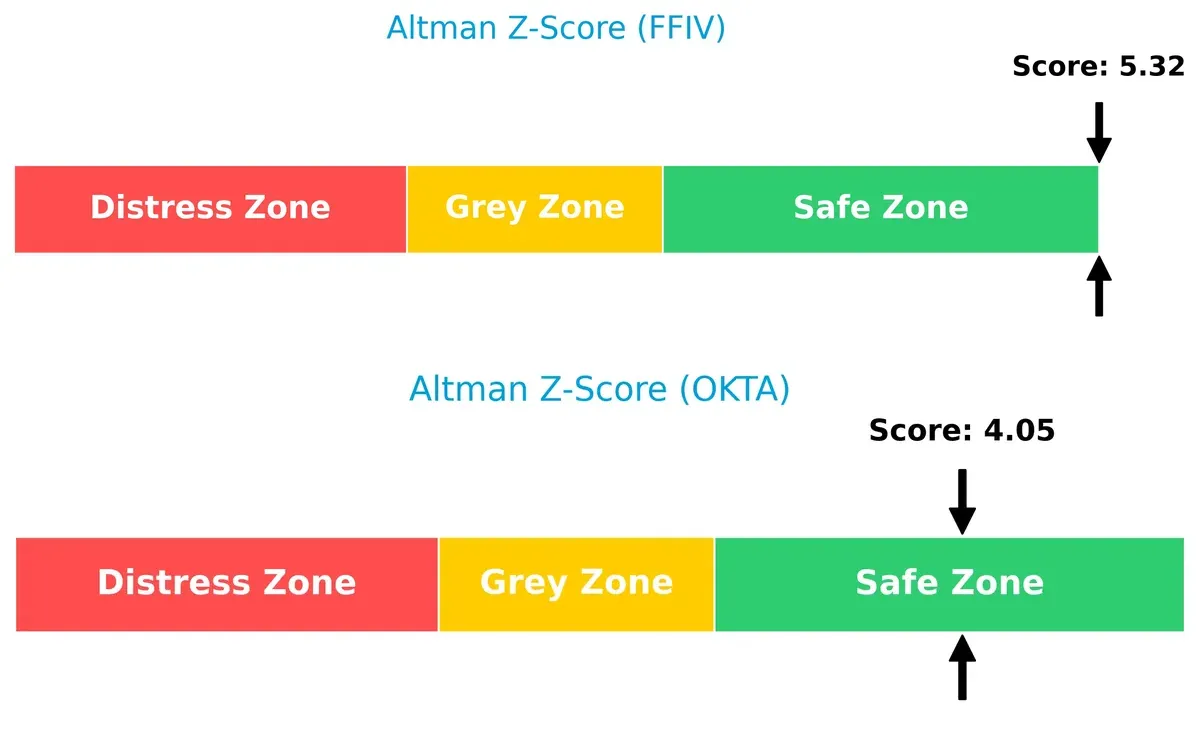
Bankruptcy Risk: Solvency Showdown
F5’s Altman Z-Score of 5.32 versus Okta’s 4.05 places both in the safe zone, but F5’s higher score signals stronger long-term solvency and lower bankruptcy risk in this cycle:
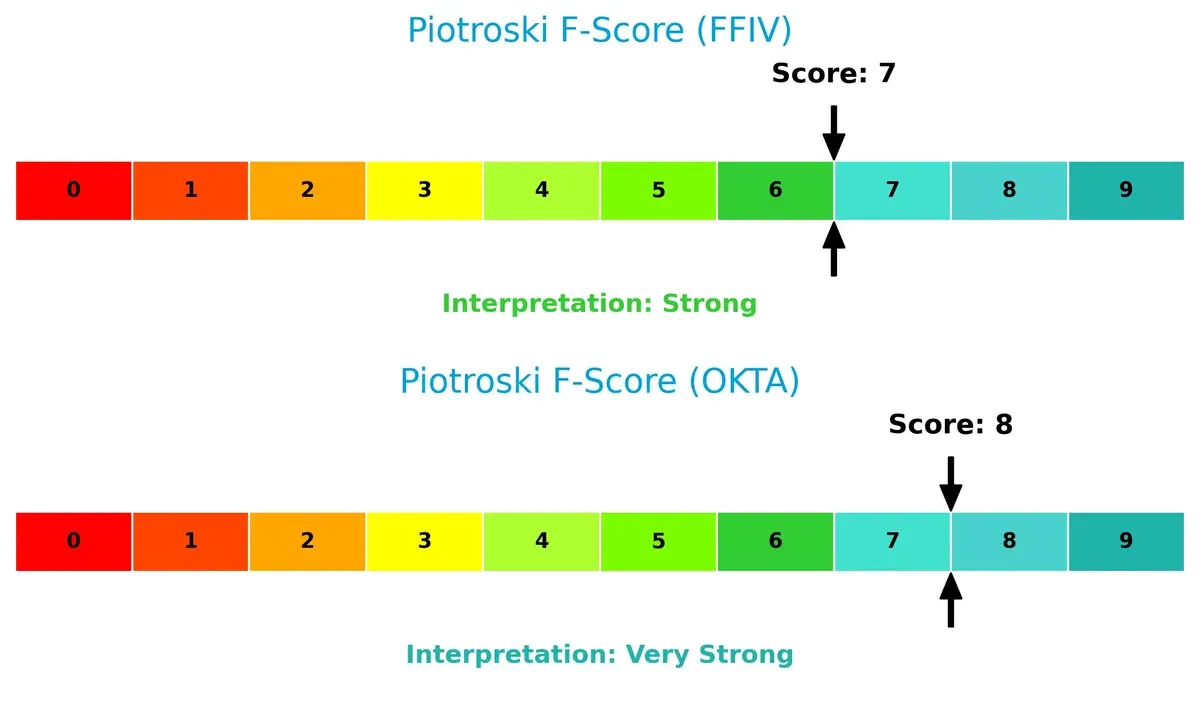
Financial Health: Quality of Operations
Okta’s Piotroski F-Score of 8 slightly surpasses F5’s 7, indicating very strong internal financial health versus strong. Neither shows red flags, but Okta edges ahead in operational quality and value metrics:
How are the two companies positioned?
This section dissects FFIV and OKTA’s operational DNA by comparing their revenue distribution and internal strengths and weaknesses. The goal is to confront their economic moats to identify which business model offers the most resilient competitive advantage today.
Revenue Segmentation: The Strategic Mix
The following comparison dissects how F5, Inc. and Okta, Inc. diversify their income streams and reveals where each firm places its primary sector bets:
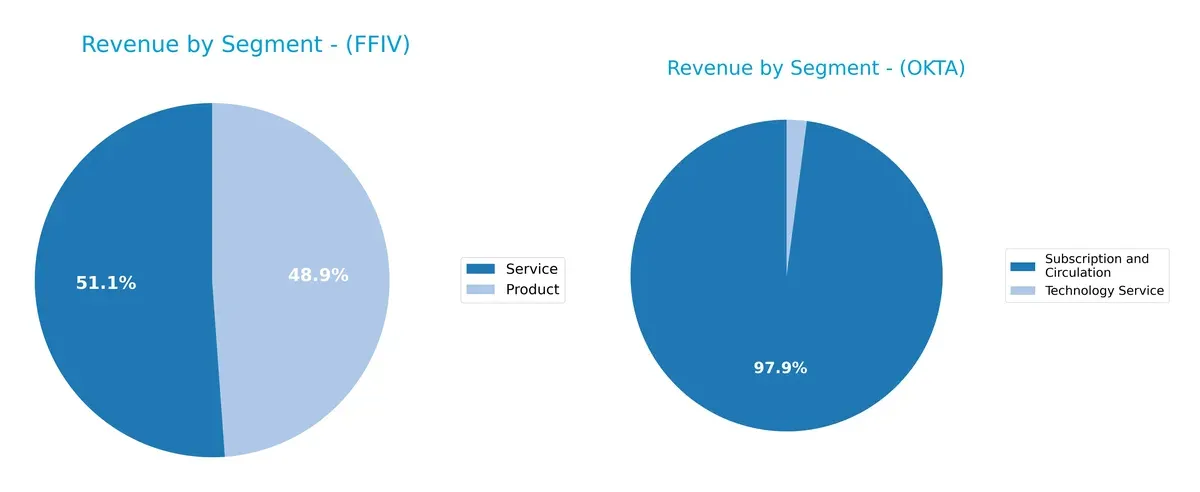
F5, Inc. balances revenue between Products ($1.51B) and Services ($1.58B), showing a more diversified mix. Okta, Inc. pivots heavily on Subscription and Circulation ($2.56B), dwarfing its Technology Service ($54M). F5’s split reduces concentration risk and supports ecosystem lock-in. Okta’s reliance on subscriptions anchors recurring revenue but exposes it to market shifts in cloud identity services. Both approaches reflect distinct strategic moats in tech infrastructure.
Strengths and Weaknesses Comparison
This table compares the Strengths and Weaknesses of F5, Inc. and Okta, Inc.:
F5 Strengths
- Balanced revenue from products (1.5B) and services (1.6B)
- Strong profitability with 22.4% net margin and 19.3% ROE
- Low leverage with 3.7% debt-to-assets
- Favorable liquidity ratios above 1.5
- Solid global presence across Americas, EMEA, Asia Pacific
Okta Strengths
- Large subscription revenue (2.56B) driving growth
- Favorable WACC at 7.1% supports capital efficiency
- Strong interest coverage at 10.2x
- Favorable quick ratio and moderate debt-to-assets (10.1%)
- High fixed asset turnover indicates efficient asset use
F5 Weaknesses
- Unfavorable valuation multiples: PE 26.9, PB 5.2 indicate premium pricing
- Asset turnover low at 0.49 limits operational efficiency
- No dividend yield may deter income investors
Okta Weaknesses
- Very low profitability: net margin 1.1%, ROE 0.4%, ROIC negative
- Extremely high PE at 570.6 suggests overvaluation risk
- Lower current ratio at 1.35 indicates weaker short-term liquidity
- Asset turnover weak at 0.28 despite high fixed asset turnover
- No dividend yield signals lack of shareholder income
F5 shows robust profitability and diversified revenue streams but trades at a premium with some operational efficiency concerns. Okta’s strengths lie in subscription growth and capital structure, yet profitability challenges and valuation extremes pose risks. Both companies must balance growth with improving operational metrics to sustain competitive positioning.
The Moat Duel: Analyzing Competitive Defensibility
A structural moat is the only shield protecting long-term profits from relentless competitive erosion. Let’s dissect the moats of two software infrastructure leaders:
F5, Inc.: Hardware-Software Integration Moat
F5’s moat rests on its unique hardware-software synergy, creating switching costs and performance reliability. This drives a robust 26% EBIT margin and growing ROIC, signaling durable value creation. Expansion into multi-cloud security deepens its moat in 2026.
Okta, Inc.: Cloud Identity Network Effects
Okta builds its moat through network effects in cloud identity management, locking in users with its platform. Despite a lower 2% EBIT margin and negative ROIC vs. WACC, rapidly rising profitability and platform expansions hint at improving defensibility.
Verdict: Integration Depth vs. Network Growth
F5 commands a wider moat with sustained value creation and margin stability. Okta’s moat is narrower but shows promising growth. F5 remains better positioned to defend market share amid evolving cloud security demands.
Which stock offers better returns?
The past 12 months reveal distinct dynamics: F5, Inc. surged with accelerating gains, while Okta, Inc. faced a steep decline despite recent stabilization.
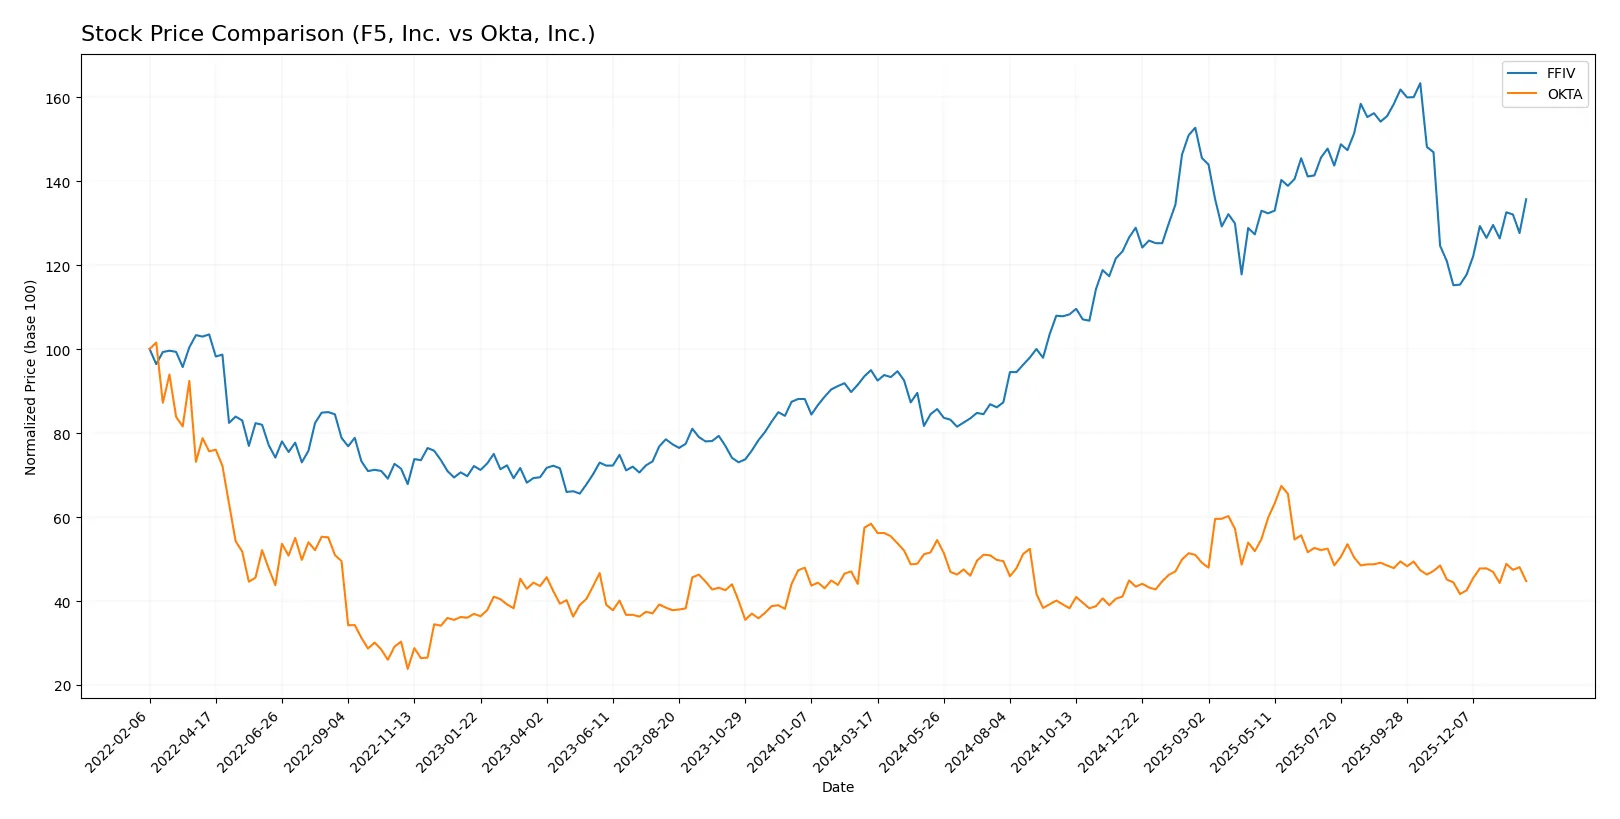
Trend Comparison
F5, Inc. shows a strong 42.85% price increase over the past year, marking a bullish trend with accelerating momentum and a high volatility of 48.51%. The stock reached a peak at 331.75 and bottomed at 165.57.
Okta, Inc. exhibits a bearish trend with a 23.41% price drop over the same period, though it shows signs of near-neutral movement recently with a 0.64% rise and lower volatility at 11.25%. The stock’s highest and lowest prices were 127.3 and 72.24, respectively.
Comparing both, F5, Inc. delivered significantly higher market performance over the past year, driven by sustained upward acceleration, while Okta, Inc. remains under pressure despite recent stability.
Target Prices
Analysts present a clear consensus on target prices for F5, Inc. and Okta, Inc., reflecting moderate upside potential.
| Company | Target Low | Target High | Consensus |
|---|---|---|---|
| F5, Inc. | 295 | 352 | 330.67 |
| Okta, Inc. | 60 | 140 | 110.67 |
F5’s target consensus stands about 20% above its current price of 275.61, signaling analyst confidence in its growth. Okta’s consensus at 110.67 suggests roughly 31% upside from its current price of 84.48, indicating optimism despite volatility risks.

Don’t Let Luck Decide Your Entry Point
Optimize your entry points with our advanced ProRealTime indicators. You’ll get efficient buy signals with precise price targets for maximum performance. Start outperforming now!
How do institutions grade them?
F5, Inc. Grades
The following table summarizes recent institutional grades for F5, Inc.:
| Grading Company | Action | New Grade | Date |
|---|---|---|---|
| Needham | Maintain | Hold | 2026-01-28 |
| Piper Sandler | Maintain | Overweight | 2026-01-28 |
| Goldman Sachs | Maintain | Neutral | 2026-01-28 |
| Barclays | Maintain | Equal Weight | 2026-01-28 |
| RBC Capital | Maintain | Outperform | 2026-01-28 |
| JP Morgan | Upgrade | Overweight | 2026-01-15 |
| Piper Sandler | Upgrade | Overweight | 2026-01-05 |
| RBC Capital | Upgrade | Outperform | 2026-01-05 |
| Morgan Stanley | Maintain | Equal Weight | 2025-12-17 |
| Morgan Stanley | Maintain | Equal Weight | 2025-10-28 |
Okta, Inc. Grades
The following table summarizes recent institutional grades for Okta, Inc.:
| Grading Company | Action | New Grade | Date |
|---|---|---|---|
| Stephens & Co. | Upgrade | Overweight | 2026-01-14 |
| RBC Capital | Maintain | Outperform | 2026-01-05 |
| Piper Sandler | Maintain | Neutral | 2026-01-05 |
| Jefferies | Upgrade | Buy | 2025-12-16 |
| Needham | Maintain | Buy | 2025-12-12 |
| BTIG | Maintain | Buy | 2025-12-04 |
| Goldman Sachs | Maintain | Buy | 2025-12-03 |
| Citigroup | Maintain | Neutral | 2025-12-03 |
| Guggenheim | Maintain | Buy | 2025-12-03 |
| Canaccord Genuity | Maintain | Buy | 2025-12-03 |
Which company has the best grades?
Okta, Inc. generally receives stronger grades, including multiple Buy and Overweight ratings. F5, Inc. mostly holds Neutral or Equal Weight grades with fewer upgrades. This suggests stronger institutional confidence in Okta.
Risks specific to each company
The following categories identify the critical pressure points and systemic threats facing both firms in the 2026 market environment:
1. Market & Competition
F5, Inc.
- Faces intense competition in multi-cloud security from established tech giants.
Okta, Inc.
- Operates in a crowded identity management space with rapid innovation and new entrants.
2. Capital Structure & Debt
F5, Inc.
- Maintains a very low debt-to-equity ratio at 0.06, indicating strong financial stability.
Okta, Inc.
- Slightly higher leverage with debt-to-equity at 0.15, manageable but increases financial risk.
3. Stock Volatility
F5, Inc.
- Beta near 1 (0.975) suggests market-level volatility, typical for tech infrastructure firms.
Okta, Inc.
- Lower beta of 0.76 implies less sensitivity to market swings, offering some volatility cushion.
4. Regulatory & Legal
F5, Inc.
- Subject to evolving cybersecurity regulations globally, increasing compliance costs.
Okta, Inc.
- Faces complex data privacy laws impacting identity solutions, with enforcement intensifying.
5. Supply Chain & Operations
F5, Inc.
- Relies on hardware and software supply chains vulnerable to global chip shortages.
Okta, Inc.
- Primarily cloud-based, reducing physical supply chain risks but dependent on cloud providers.
6. ESG & Climate Transition
F5, Inc.
- Moderate ESG risk; energy use in hardware production is a pressure point.
Okta, Inc.
- Lower direct environmental impact but must monitor cloud providers’ sustainability practices.
7. Geopolitical Exposure
F5, Inc.
- Global operations expose it to trade tensions and export controls, notably with Asia.
Okta, Inc.
- International sales create exposure to geopolitical instability and regulatory divergence.
Which company shows a better risk-adjusted profile?
F5, Inc. carries lower financial leverage and a stronger profitability profile, reducing its capital risk. Okta, despite a safer beta, struggles with thin margins and high valuation multiples that amplify downside risk. F5’s diversified product base and robust Altman Z-score (5.3) signal superior financial health. Okta’s higher P/E of 570 raises valuation concerns amid modest returns. Thus, F5 offers a better risk-adjusted profile for 2026 investors.
Final Verdict: Which stock to choose?
F5, Inc. (FFIV) stands out as a cash-generating powerhouse with a durable competitive advantage. Its rising ROIC well above WACC signals efficient capital allocation and persistent value creation. The main point of vigilance remains its premium valuation metrics, which might temper near-term upside. FFIV suits investors seeking steady growth with quality.
Okta, Inc. (OKTA) leverages a strategic moat rooted in recurring revenue and identity management dominance. While its profitability lags behind FFIV’s, its improving cash flow and strong balance sheet offer a cushion against volatility. OKTA fits portfolios favoring GARP—growth at a reasonable price—especially in tech-focused allocations.
If you prioritize robust profitability and proven capital efficiency, FFIV outshines OKTA with better stability and value creation. However, if you seek higher growth potential with a wider margin for operational improvement, OKTA offers compelling exposure despite its current earnings challenges. Each choice reflects a distinct investor profile balancing growth and risk.
Disclaimer: Investment carries a risk of loss of initial capital. The past performance is not a reliable indicator of future results. Be sure to understand risks before making an investment decision.
Go Further
I encourage you to read the complete analyses of F5, Inc. and Okta, Inc. to enhance your investment decisions: