Home > Comparison > Technology > FFIV vs ODD
The strategic rivalry between F5, Inc. and Oddity Tech Ltd. shapes the evolving landscape of the technology sector. F5, Inc. operates as a capital-intensive software infrastructure leader, delivering multi-cloud application security solutions. Oddity Tech, a nimble consumer-tech innovator, leverages digital-first brands to disrupt beauty and wellness markets. This analysis evaluates which distinct operational model offers a superior risk-adjusted return, guiding investors toward the optimal inclusion for a diversified portfolio.
Table of contents
Companies Overview
F5, Inc. and Oddity Tech Ltd. stand as contrasting forces in the technology sector, each commanding distinct market niches.
F5, Inc.: Multi-Cloud Application Security Leader
F5, Inc. dominates the multi-cloud application security and delivery market. Its core revenue stems from advanced hardware and software solutions like BIG-IP appliances and NGINX software modules. In 2026, F5 focuses on enhancing application security across hybrid architectures, leveraging partnerships with AWS, Azure, and Google Cloud to expand enterprise and public sector reach.
Oddity Tech Ltd.: Digital-First Beauty Innovator
Oddity Tech Ltd. pioneers consumer tech in beauty and wellness with its PowerMatch technology driving digital-first brand growth. Revenue primarily comes from cosmetics and skincare brands like IL MAKIAGE and SpoiledChild. In 2026, Oddity scales its digital platform to disrupt traditional markets, emphasizing rapid brand expansion and online consumer engagement worldwide.
Strategic Collision: Similarities & Divergences
F5 and Oddity Tech share a technology-driven business model but diverge sharply in focus: enterprise cloud security versus consumer beauty tech. Their main battleground lies in digital innovation—F5 in secure infrastructure, Oddity in digital consumer engagement. Investors face distinct profiles: F5 offers stability with established enterprise solutions, while Oddity presents higher volatility tied to disruptive consumer brand growth.
Income Statement Comparison
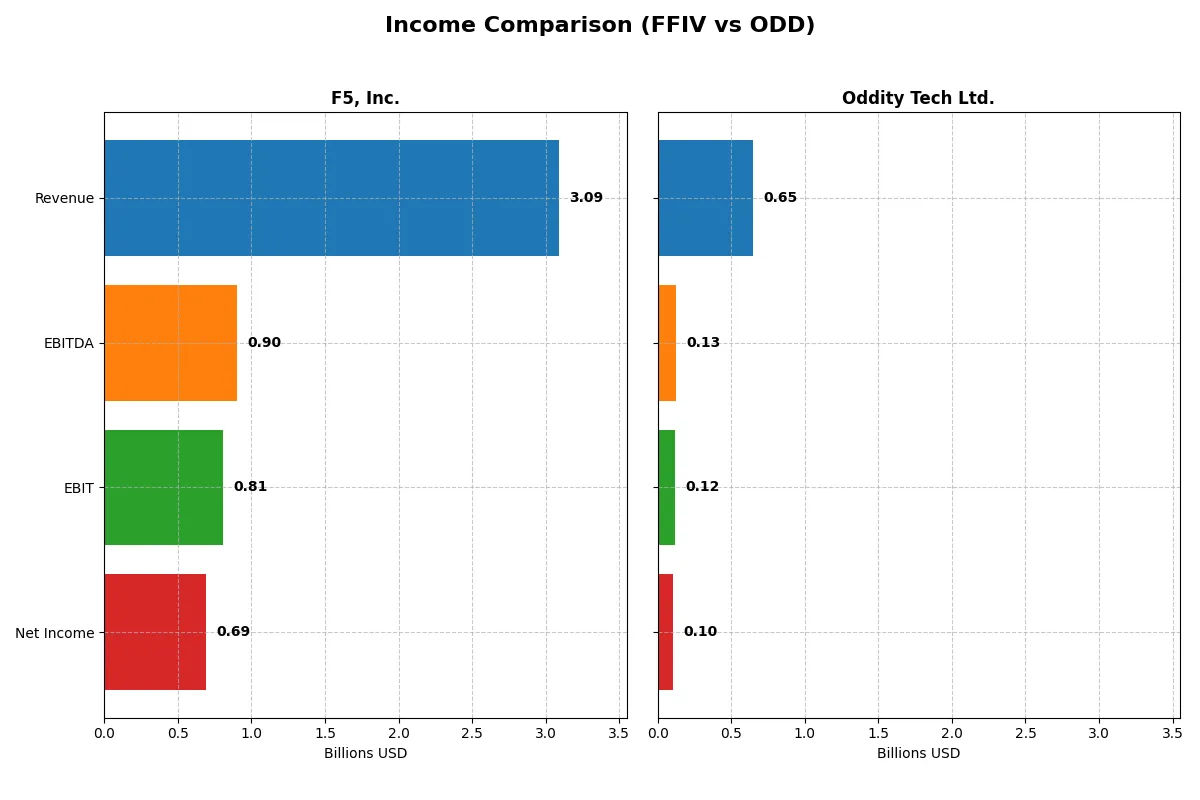
This data dissects the core profitability and scalability of both corporate engines to reveal who dominates the bottom line:
| Metric | F5, Inc. (FFIV) | Oddity Tech Ltd. (ODD) |
|---|---|---|
| Revenue | 3.09B | 647M |
| Cost of Revenue | 564M | 179M |
| Operating Expenses | 1.76B | 353M |
| Gross Profit | 2.52B | 468M |
| EBITDA | 901M | 125M |
| EBIT | 808M | 116M |
| Interest Expense | 0 | 76K |
| Net Income | 692M | 101M |
| EPS | 11.95 | 1.78 |
| Fiscal Year | 2025 | 2024 |
Income Statement Analysis: The Bottom-Line Duel
This income statement comparison reveals which company drives superior efficiency and profitability through its core operations.
F5, Inc. Analysis
F5, Inc. shows a steady revenue growth from $2.6B in 2021 to $3.1B in 2025, with net income nearly doubling from $331M to $692M. Its gross margin consistently exceeds 81%, while the net margin rose to 22.4% in 2025, signaling robust cost control and operational leverage. The latest year highlights strong momentum with 9.7% revenue growth and 23.7% EPS growth, reflecting efficient capital allocation.
Oddity Tech Ltd. Analysis
Oddity Tech Ltd. experiences rapid expansion, with revenue surging from $110M in 2020 to $647M in 2024, and net income growing over sevenfold to $101M. The gross margin stands at a healthy 72.4%, and the net margin improved to 15.7% in 2024. Its growth rates impress, with 27.2% revenue and 66% EPS growth last year, underscoring its scaling efficiency and expanding profitability profile.
Scale Versus Growth Efficiency
F5 dominates in absolute profitability and margin strength, delivering consistent, high returns with a mature business model. Oddity Tech impresses with explosive revenue and earnings growth but operates at lower margins and scale. Investors seeking stable cash flow will favor F5; those pursuing high-growth potential may find Oddity Tech’s profile more attractive despite its smaller size.
Financial Ratios Comparison
These vital ratios act as a diagnostic tool to expose the underlying fiscal health, valuation premiums, and capital efficiency of the companies compared:
| Ratios | F5, Inc. (FFIV) | Oddity Tech Ltd. (ODD) |
|---|---|---|
| ROE | 19.3% | 35.9% |
| ROIC | 14.0% | 28.6% |
| P/E | 26.9 | 23.7 |
| P/B | 5.19 | 8.54 |
| Current Ratio | 1.56 | 1.79 |
| Quick Ratio | 1.51 | 0.99 |
| D/E | 0.06 | 0.08 |
| Debt-to-Assets | 3.7% | 5.2% |
| Interest Coverage | 0 | 1521 |
| Asset Turnover | 0.49 | 1.47 |
| Fixed Asset Turnover | 9.02 | 19.38 |
| Payout Ratio | 0 | 0 |
| Dividend Yield | 0 | 0 |
| Fiscal Year | 2025 | 2024 |
Efficiency & Valuation Duel: The Vital Signs
Ratios serve as a company’s DNA, exposing hidden risks and operational strength that raw numbers alone cannot reveal.
F5, Inc.
F5, Inc. shows strong profitability with a 19.3% ROE and a solid 22.4% net margin, signaling efficient operations. However, its valuation appears stretched, with a high P/E of 26.9 and P/B of 5.2. The company pays no dividend, instead reinvesting heavily in R&D, fueling future growth and shareholder value.
Oddity Tech Ltd.
Oddity Tech delivers an impressive 36% ROE and 15.7% net margin, reflecting robust profitability. Its P/E of 23.8 is more moderate but paired with a high P/B of 8.5, indicating a premium valuation. Like F5, it does not distribute dividends, opting to channel cash into growth initiatives rather than shareholder payouts.
Premium Valuation vs. Operational Safety
Both companies maintain favorable overall ratios, but Oddity Tech’s superior returns come with a higher WACC and valuation premium, increasing risk. F5 offers a steadier profile with balanced reinvestment and operational efficiency. Investors seeking growth at a measured risk may lean towards F5’s profile, while those favoring high returns may prefer Oddity Tech’s aggressive stance.
Which one offers the Superior Shareholder Reward?
I observe that both F5, Inc. (FFIV) and Oddity Tech Ltd. (ODD) pay no dividends. FFIV reinvests heavily in free cash flow (FCF) with a high payout coverage ratio near 95%. Its buyback program appears moderate, as no explicit buyback data is provided but capital allocation favors steady FCF generation and reinvestment. ODD also retains all earnings, plowing cash into R&D and growth, shown by its lower free cash flow per share ($2.26 vs. FFIV’s $15.7) but higher asset turnover (1.47 vs. 0.49), indicating aggressive expansion. ODD’s financial leverage is lower, suggesting a more conservative capital structure. FFIV’s payout model, focused on converting strong operating cash flow into shareholder value, appears more sustainable in 2026. I conclude FFIV offers a superior total return profile due to its robust cash flow, prudent reinvestment, and potential for disciplined buybacks.
Comparative Score Analysis: The Strategic Profile
The radar chart reveals the fundamental DNA and trade-offs of both firms, highlighting their core financial strengths and valuation challenges:
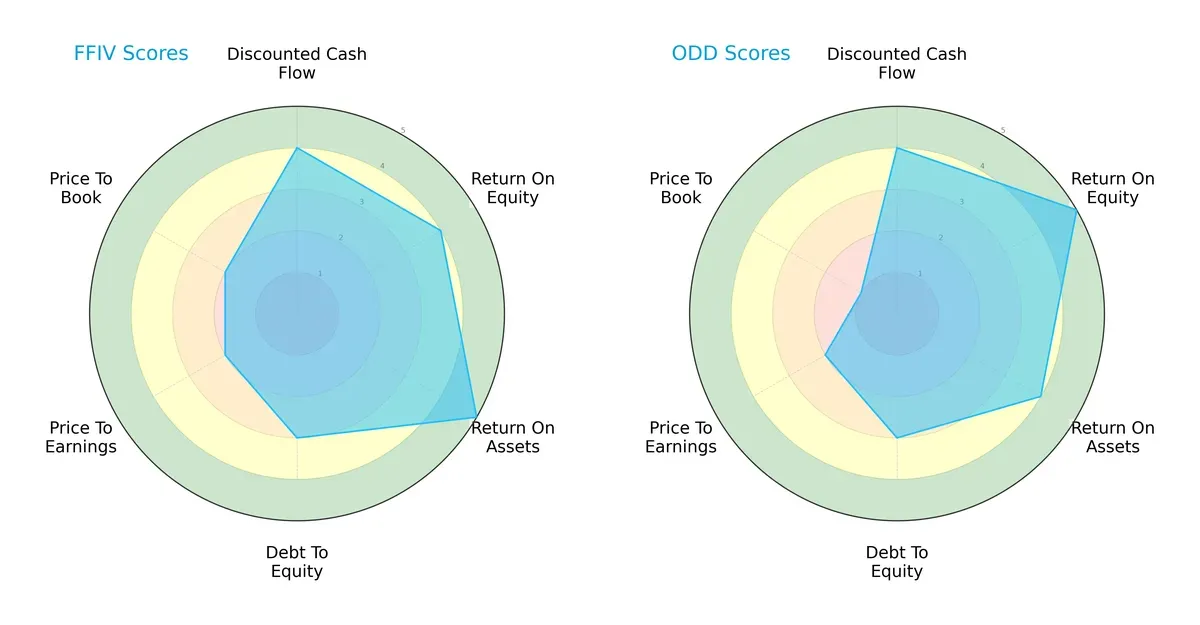
F5, Inc. (FFIV) shows a more balanced profile with strong ROA (5) and solid ROE (4), but moderate valuation scores (P/E 2, P/B 2) suggest some market skepticism. Oddity Tech (ODD) leverages a top-tier ROE (5) and favorable DCF (4) but suffers from a very unfavorable price-to-book score (1). FFIV’s strength lies in operational efficiency, while ODD relies on equity returns, exposing a valuation risk.
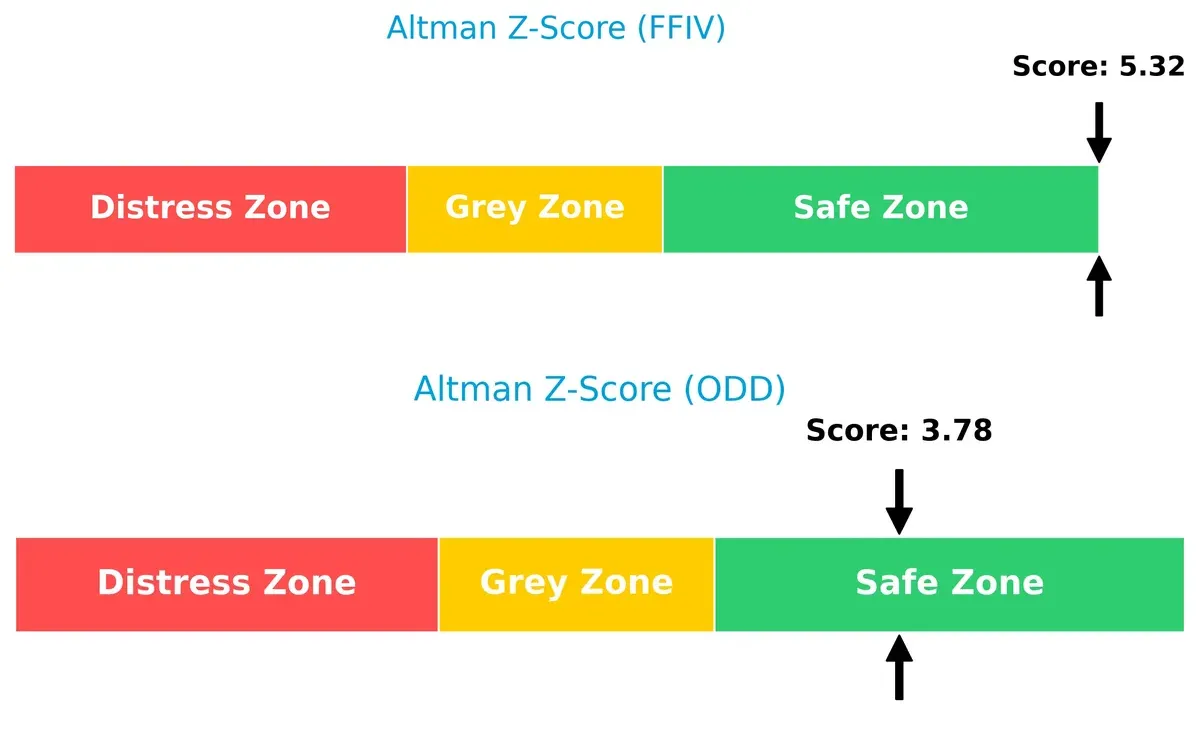
Bankruptcy Risk: Solvency Showdown
The Altman Z-Score delta favors F5, Inc. with a higher score of 5.32 versus Oddity Tech’s 3.78, both safely in the safe zone, indicating F5’s stronger buffer against financial distress in this cycle:
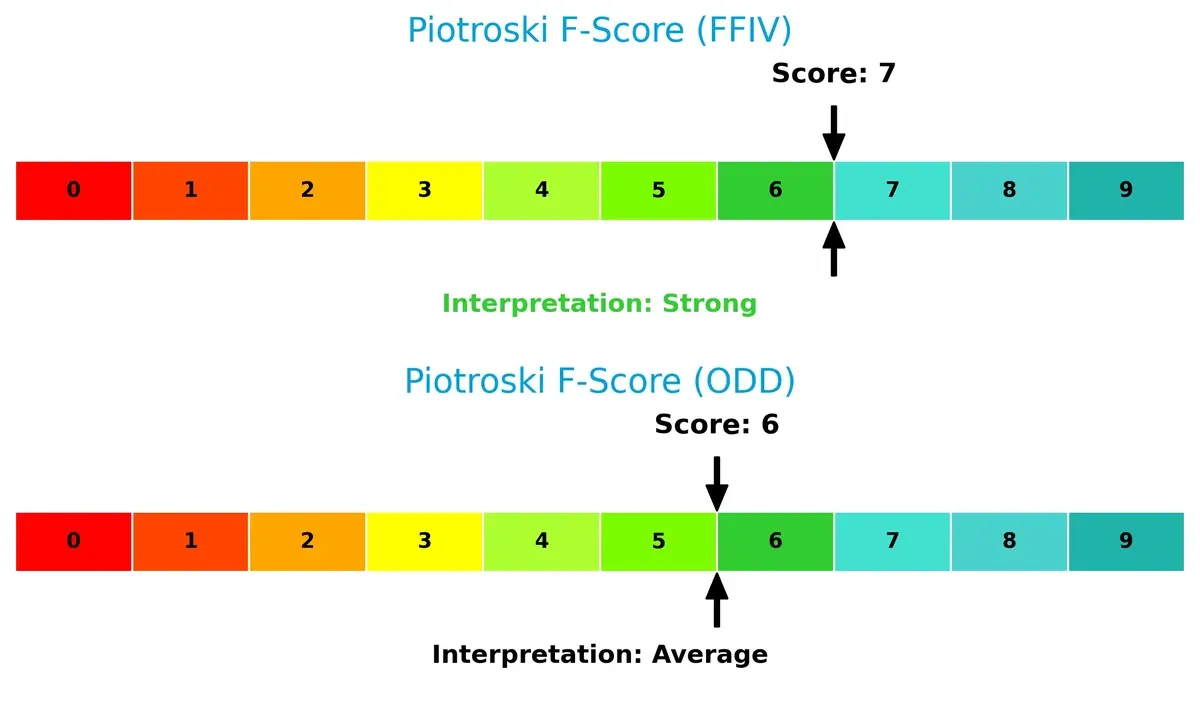
Financial Health: Quality of Operations
F5, Inc. posts a Piotroski F-Score of 7, signaling robust financial health and operational quality. Oddity Tech’s score of 6 is respectable but hints at some internal weaknesses relative to FFIV:
How are the two companies positioned?
This section dissects the operational DNA of F5 and Oddity Tech by comparing their revenue distribution and internal dynamics. The goal is to confront their economic moats to identify which model offers the most resilient, sustainable competitive advantage today.
Revenue Segmentation: The Strategic Mix
This visual comparison dissects how F5, Inc. and Oddity Tech Ltd. diversify their income streams and highlights their primary sector bets:
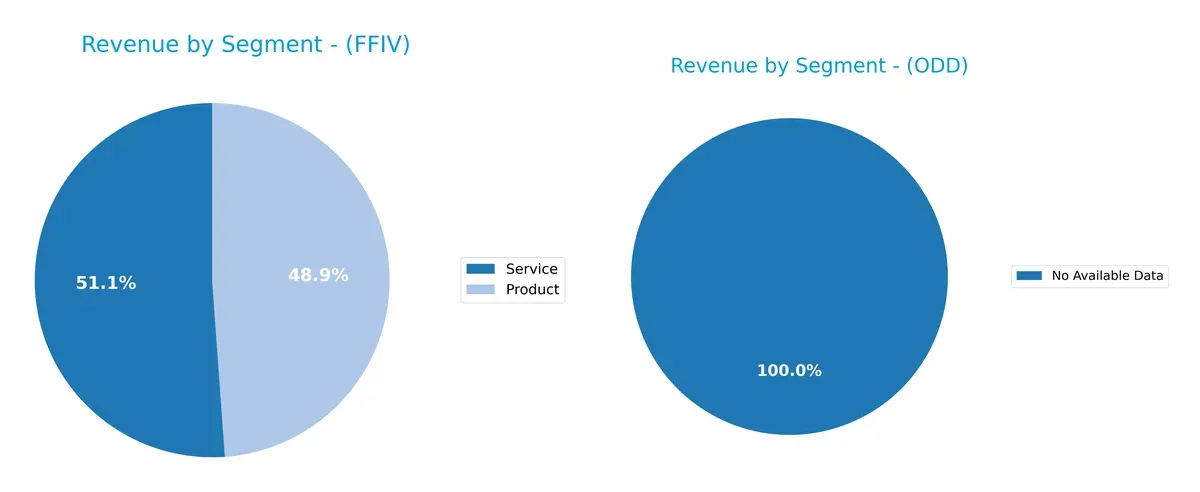
F5, Inc. splits its revenue between Products at $1.5B and Services at $1.58B, showcasing a balanced diversification. Oddity Tech Ltd. lacks disclosed data, limiting direct comparison. F5’s near-equal division reduces concentration risk and anchors its ecosystem lock-in through both product sales and recurring services. This dual focus strengthens resilience against market shifts and enhances capital allocation flexibility.
Strengths and Weaknesses Comparison
This table compares the Strengths and Weaknesses of F5, Inc. and Oddity Tech Ltd.:
F5, Inc. Strengths
- Balanced revenue from products (1.5B) and services (1.6B)
- Strong profitability with 22.4% net margin and 19.3% ROE
- Low leverage with 0.06 debt-to-equity and high interest coverage
- Global presence across Americas (1.8B), EMEA (827M), and Asia Pacific (537M)
- Favorable ROIC (13.99%) above WACC (8.31%)
- Stable liquidity ratios above 1.5
Oddity Tech Ltd. Strengths
- Superior profitability with 35.9% ROE and 28.6% ROIC
- High asset turnover (1.47) and fixed asset turnover (19.38) indicate efficiency
- Strong interest coverage (1521) and manageable debt levels
- Solid North American revenue base (547M) with international sales
- Favorable net margin (15.7%) and moderate P/E valuation (23.75)
- Strong capital efficiency despite higher WACC (18.64%)
F5, Inc. Weaknesses
- Elevated price-to-book (5.19) and price-to-earnings (26.91) ratios
- Below-par asset turnover (0.49) suggests less efficient use of assets
- Zero dividend yield limits income appeal
- Moderate global market share concentration
- Neutral cost of capital impact
- Unfavorable valuation metrics relative to sector
Oddity Tech Ltd. Weaknesses
- High weighted average cost of capital (18.64%) weighs on returns
- Quick ratio (0.99) near liquidity risk threshold
- Price-to-book ratio elevated at 8.54
- Absence of dividend yield reduces investor income options
- Geographic concentration in North America limits diversification
- Mixed valuation signals with neutral P/E status
F5, Inc. shows well-diversified global revenue and strong balance sheet metrics but faces valuation and efficiency challenges. Oddity Tech excels in profitability and asset efficiency but carries higher capital costs and geographic concentration risks. Both companies exhibit favorable overall financial profiles, with differing strategic implications for growth and risk management.
The Moat Duel: Analyzing Competitive Defensibility
A structural moat alone shields long-term profits from relentless competitive erosion. Let’s dissect the core moats of F5, Inc. and Oddity Tech Ltd.:
F5, Inc.: Network Effects and Intangible Assets Moat
F5 leverages deep network effects and proprietary software to sustain high ROIC above WACC by 5.7%. Its 26% EBIT margin reflects durable pricing power. Expanding multi-cloud security in 2026 should reinforce its fortress.
Oddity Tech Ltd.: Rapid Growth Driven Intangible Assets
Oddity’s moat stems from innovative digital-first branding and technology, fueling ROIC nearly 10% above WACC. Its aggressive 27% revenue growth and expanding margins signal a widening moat. New market disruptions could accelerate growth further.
Network Effects vs. Digital Disruption: The Moat Showdown
Oddity Tech’s sharper ROIC premium and faster growth hint at a widening moat versus F5’s steady but slower expansion. Oddity is better positioned to capture emerging market opportunities and defend its share aggressively.
Which stock offers better returns?
The past year shows distinct divergences: F5, Inc. rallies with accelerating gains and strong buyer dominance. Oddity Tech Ltd. faces a sustained decline amid seller pressure and deceleration.
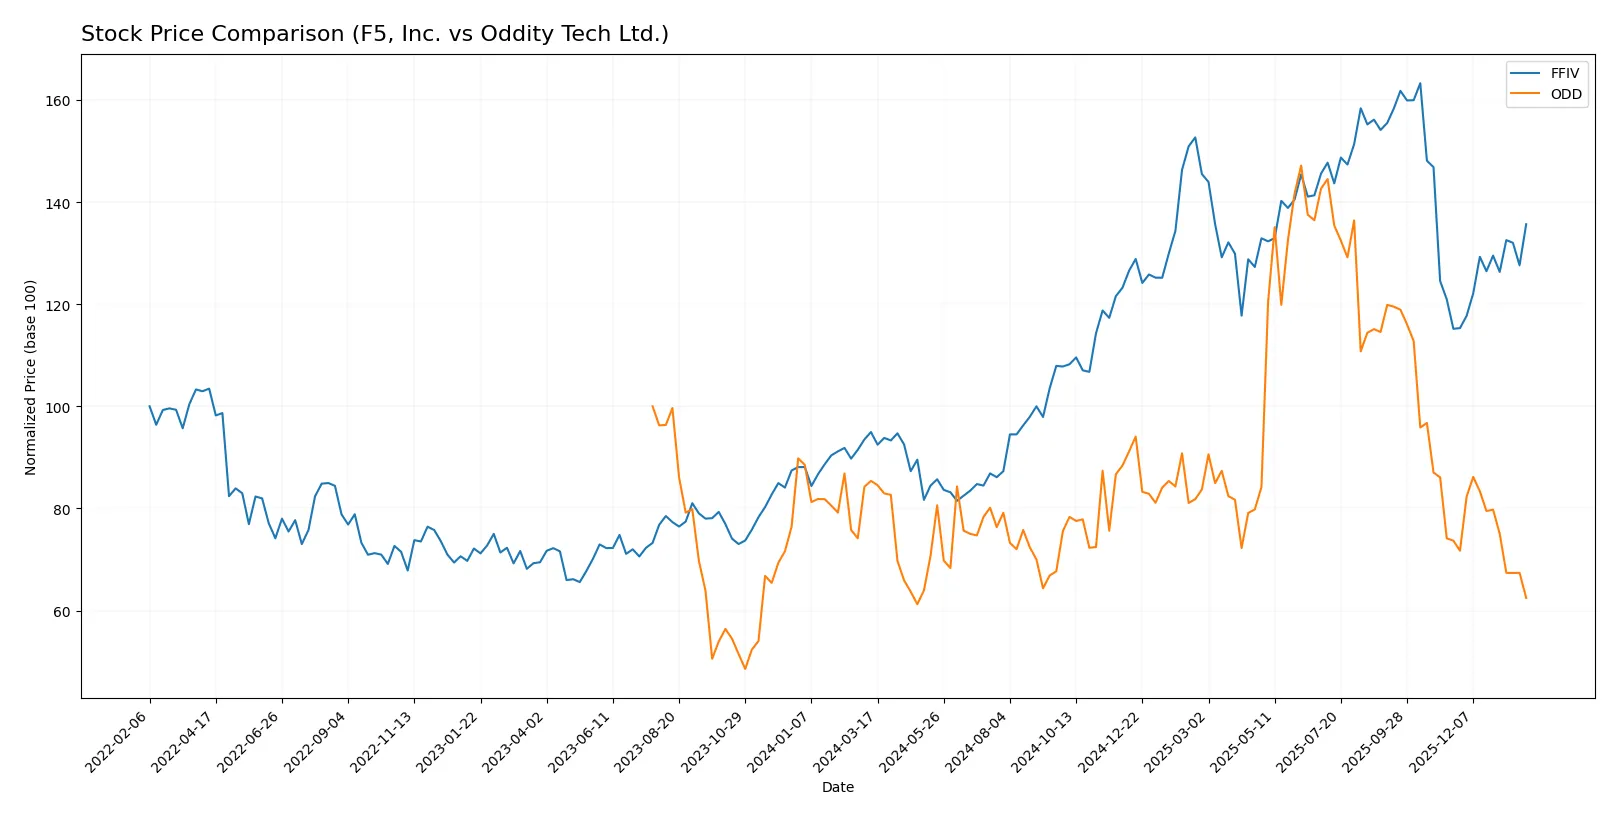
Trend Comparison
F5, Inc. posts a bullish 42.85% gain over 12 months, with accelerating momentum and a high volatility of 48.51. Its price ranges from 165.57 to 331.75, reflecting growing investor confidence.
Oddity Tech Ltd. suffers a bearish 26.83% decline over the same period, with decelerating losses and lower volatility at 11.87. The stock fell from a high of 77.35 to a low of 32.19, showing weakening support.
F5, Inc. outperforms Oddity Tech Ltd. significantly in market returns, driven by strong buyer activity and positive price acceleration.
Target Prices
Analysts present a confident target consensus for both F5, Inc. and Oddity Tech Ltd.
| Company | Target Low | Target High | Consensus |
|---|---|---|---|
| F5, Inc. | 295 | 352 | 330.67 |
| Oddity Tech Ltd. | 40 | 80 | 66.33 |
F5, Inc.’s target consensus exceeds its current price by nearly 20%, signaling strong upside potential. Oddity Tech Ltd. shows even greater expected gains, with consensus roughly double its current price, reflecting high growth anticipation.

Don’t Let Luck Decide Your Entry Point
Optimize your entry points with our advanced ProRealTime indicators. You’ll get efficient buy signals with precise price targets for maximum performance. Start outperforming now!
How do institutions grade them?
Here are the latest institutional grades for F5, Inc. and Oddity Tech Ltd.:
F5, Inc. Grades
This table summarizes recent grade updates from reputable financial institutions for F5, Inc.
| Grading Company | Action | New Grade | Date |
|---|---|---|---|
| Needham | Maintain | Hold | 2026-01-28 |
| Piper Sandler | Maintain | Overweight | 2026-01-28 |
| Goldman Sachs | Maintain | Neutral | 2026-01-28 |
| Barclays | Maintain | Equal Weight | 2026-01-28 |
| RBC Capital | Maintain | Outperform | 2026-01-28 |
| JP Morgan | Upgrade | Overweight | 2026-01-15 |
| Piper Sandler | Upgrade | Overweight | 2026-01-05 |
| RBC Capital | Upgrade | Outperform | 2026-01-05 |
| Morgan Stanley | Maintain | Equal Weight | 2025-12-17 |
| Morgan Stanley | Maintain | Equal Weight | 2025-10-28 |
Oddity Tech Ltd. Grades
This table presents recent grade assessments from credible firms for Oddity Tech Ltd.
| Grading Company | Action | New Grade | Date |
|---|---|---|---|
| Keybanc | Maintain | Overweight | 2026-01-08 |
| JP Morgan | Maintain | Overweight | 2025-12-12 |
| Barclays | Maintain | Equal Weight | 2025-11-21 |
| JP Morgan | Maintain | Overweight | 2025-11-21 |
| Morgan Stanley | Maintain | Equal Weight | 2025-11-21 |
| Needham | Maintain | Buy | 2025-11-20 |
| Keybanc | Maintain | Overweight | 2025-10-08 |
| JMP Securities | Maintain | Market Outperform | 2025-09-23 |
| Morgan Stanley | Maintain | Equal Weight | 2025-08-06 |
| JMP Securities | Maintain | Market Outperform | 2025-08-05 |
Which company has the best grades?
Oddity Tech Ltd. consistently holds stronger ratings, including Buy and Market Outperform grades. F5, Inc. shows a mix from Hold to Outperform. Investors may see Oddity Tech’s grades as signaling higher confidence from analysts.
Risks specific to each company
The following categories identify the critical pressure points and systemic threats facing both firms in the 2026 market environment:
1. Market & Competition
F5, Inc.
- Faces intense competition in multi-cloud application security from large cloud providers and niche specialists.
Oddity Tech Ltd.
- Operates in consumer-tech beauty with digital-first disruption but contends with established offline incumbents and volatile trends.
2. Capital Structure & Debt
F5, Inc.
- Maintains a very low debt-to-equity ratio (0.06), indicating financial conservatism and strong balance sheet.
Oddity Tech Ltd.
- Also low leverage (0.08 debt-to-equity) but higher WACC (18.64%) signals costlier capital and riskier financing.
3. Stock Volatility
F5, Inc.
- Exhibits modest beta (0.975), reflecting stable stock price movement near market average.
Oddity Tech Ltd.
- High beta (3.184) shows elevated stock volatility and sensitivity to market swings.
4. Regulatory & Legal
F5, Inc.
- Must navigate complex cybersecurity regulations globally, with potential fines for breaches.
Oddity Tech Ltd.
- Faces consumer product regulations and compliance risks internationally, especially in safety and data privacy.
5. Supply Chain & Operations
F5, Inc.
- Relies on hardware and software supply chains vulnerable to component shortages and geopolitical tensions.
Oddity Tech Ltd.
- Depends on global manufacturing and logistics for beauty products; sensitive to supply disruptions and raw material costs.
6. ESG & Climate Transition
F5, Inc.
- Technology sector pressures to reduce carbon footprint and improve data center efficiency.
Oddity Tech Ltd.
- Consumer brand under pressure to meet sustainability standards and ethical sourcing demands.
7. Geopolitical Exposure
F5, Inc.
- Global sales expose it to US-China tensions and sanctions impacting cloud partnerships.
Oddity Tech Ltd.
- Based in Israel with exposure to Middle East geopolitical risks and US market dependence.
Which company shows a better risk-adjusted profile?
F5, Inc. faces significant competitive and regulatory risks but benefits from a conservative capital structure and stable stock volatility. Oddity Tech Ltd. delivers higher returns but carries elevated volatility, a costly capital base, and geopolitical sensitivities. The most impactful risk for F5 is intense competition in cloud security, while for Oddity, it is stock volatility tied to market sentiment. Given these factors, F5 exhibits a stronger risk-adjusted profile, supported by its low leverage and safer Altman Z-Score of 5.3 versus Oddity’s 3.8, signaling superior financial stability despite sector headwinds.
Final Verdict: Which stock to choose?
F5, Inc. (FFIV) impresses with its unmatched capital efficiency and a durable moat reflected in a steadily growing ROIC well above its cost of capital. Its ability to generate strong free cash flow while maintaining a solid balance sheet is compelling. The point of vigilance lies in its relatively high valuation multiples, which may temper near-term upside. FFIV suits portfolios seeking stable, long-term growth with moderate risk tolerance.
Oddity Tech Ltd. (ODD) commands attention through its powerful return on equity and invested capital, signaling a strong strategic moat rooted in operational excellence. It offers a compelling growth narrative, albeit with a more volatile price trend and weaker valuation metrics compared to FFIV. ODD fits investors favoring growth-at-a-reasonable-price (GARP) profiles, balancing high returns with higher risk exposure.
If you prioritize consistent value creation and stable growth, F5, Inc. outshines as the compelling choice due to its proven capital allocation and resilience. However, if you seek aggressive growth with a focus on superior returns on equity and invested capital, Oddity Tech offers superior upside potential despite its recent price weakness and valuation caution. Both require careful risk management aligned with your investment horizon.
Disclaimer: Investment carries a risk of loss of initial capital. The past performance is not a reliable indicator of future results. Be sure to understand risks before making an investment decision.
Go Further
I encourage you to read the complete analyses of F5, Inc. and Oddity Tech Ltd. to enhance your investment decisions: