Home > Comparison > Technology > FFIV vs NTNX
The strategic rivalry between F5, Inc. and Nutanix, Inc. shapes the evolution of the software infrastructure sector. F5 operates as a capital-intensive provider of multi-cloud application security and delivery solutions, while Nutanix focuses on high-margin enterprise cloud platforms and hybrid cloud orchestration. This analysis pits established hardware-driven security against innovative cloud-native services, aiming to identify which model offers superior risk-adjusted returns for a diversified portfolio.
Table of contents
Companies Overview
F5, Inc. and Nutanix, Inc. both command critical roles in the infrastructure software industry, shaping enterprise cloud and application delivery landscapes.
F5, Inc.: Multi-Cloud Application Security Leader
F5, Inc. dominates the multi-cloud application security and delivery market. It generates revenue through hardware appliances and software modules that secure and optimize network applications. In 2026, F5 focuses on integrating cloud-native architectures with legacy systems, enhancing performance and security across hybrid environments.
Nutanix, Inc.: Enterprise Cloud Platform Innovator
Nutanix, Inc. leads in enterprise cloud platforms, offering converged virtualization, storage, and hybrid cloud management solutions. Its revenue stems from software subscriptions and enterprise services. The company’s 2026 strategy emphasizes automation of Kubernetes clusters and multi-cloud orchestration to simplify hybrid cloud adoption.
Strategic Collision: Similarities & Divergences
Both firms operate in software infrastructure but diverge in approach: F5 prioritizes application delivery and security in a hybrid cloud ecosystem, while Nutanix champions cloud platform unification with a strong focus on automation. Their primary battleground is the hybrid cloud market, contending over enterprise workloads. F5’s hardware-software blend contrasts with Nutanix’s software-centric model, creating distinct investment profiles driven by differing capital intensity and growth vectors.
Income Statement Comparison
This data dissects the core profitability and scalability of both corporate engines to reveal who dominates the bottom line:
| Metric | F5, Inc. (FFIV) | Nutanix, Inc. (NTNX) |
|---|---|---|
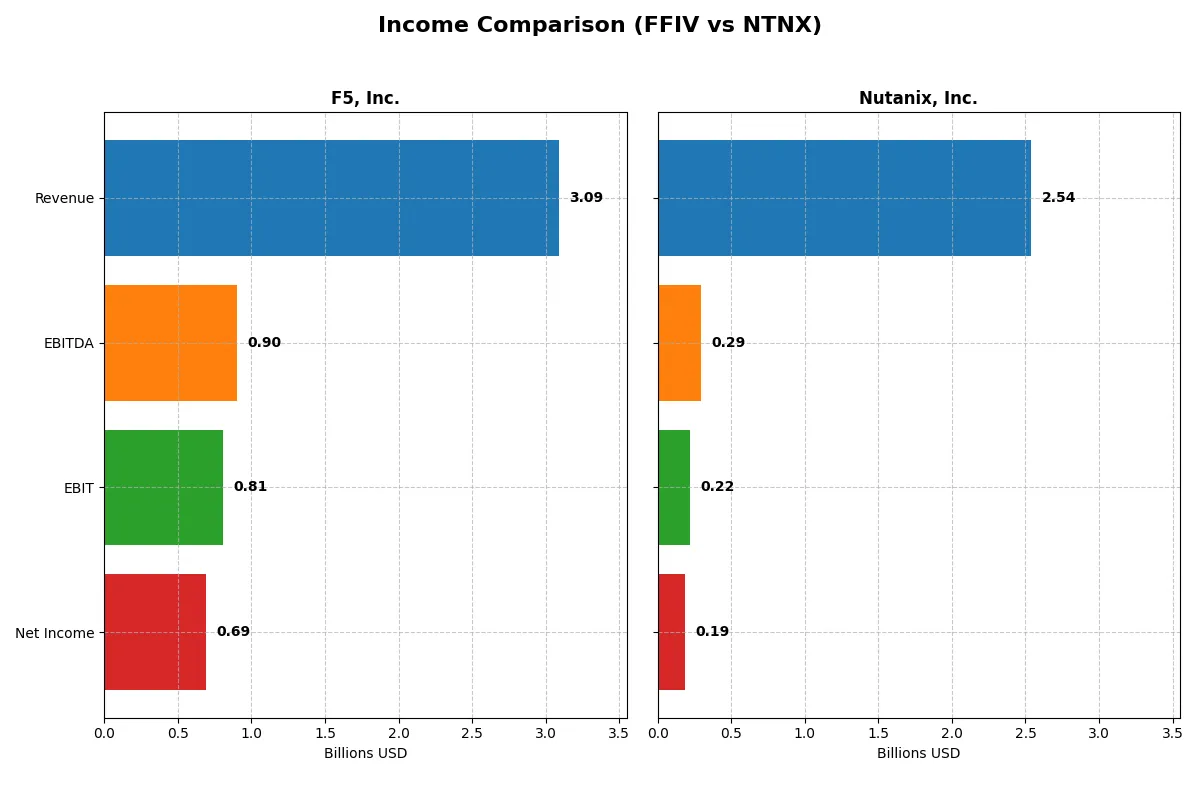
| Revenue | 3.09B | 2.54B |
| Cost of Revenue | 564M | 335M |
| Operating Expenses | 1.76B | 2.03B |
| Gross Profit | 2.52B | 2.20B |
| EBITDA | 901M | 293M |
| EBIT | 808M | 220M |
| Interest Expense | 0 | 20M |
| Net Income | 692M | 188M |
| EPS | 11.95 | 0.7 |
| Fiscal Year | 2025 | 2025 |
Income Statement Analysis: The Bottom-Line Duel
This income statement comparison reveals which company runs a more efficient and profitable corporate engine through recent financial performance.
F5, Inc. Analysis
F5, Inc. shows steady revenue growth, reaching $3.1B in 2025 with net income rising to $692M. Its gross margin remains strong at 81.7%, and net margin at 22.4%, reflecting robust profitability. The latest fiscal year demonstrates solid momentum with a 9.7% revenue increase and 11.4% net margin expansion, underscoring operational efficiency.
Nutanix, Inc. Analysis
Nutanix, Inc. delivered rapid revenue growth, surging 18.1% to $2.5B in 2025, with net income recovering to $188M. It boasts a higher gross margin of 86.8%, yet a more modest net margin of 7.4%. The company’s sharp EBIT and net margin growth over the past year signals accelerating operational leverage and improving bottom-line health.
Margin Power vs. Revenue Scale
F5 leads with superior net margins and consistent profitability, generating more income per dollar of sales. Nutanix impresses with faster revenue growth and expanding margins but still trails in absolute net income. For investors prioritizing stable profit generation, F5’s profile appears more attractive, while Nutanix suits those favoring growth momentum.
Financial Ratios Comparison
These vital ratios act as a diagnostic tool to expose the underlying fiscal health, valuation premiums, and capital efficiency of the companies compared below:
| Ratios | F5, Inc. (FFIV) | Nutanix, Inc. (NTNX) |
|---|---|---|
| ROE | 19.3% | -27.1% |
| ROIC | 14.0% | 8.1% |
| P/E | 26.9 | 106.7 |
| P/B | 5.19 | -28.95 |
| Current Ratio | 1.56 | 1.72 |
| Quick Ratio | 1.51 | 1.72 |
| D/E | 0.064 | -2.14 |
| Debt-to-Assets | 3.65% | 45.16% |
| Interest Coverage | 0 | 8.75 |
| Asset Turnover | 0.49 | 0.77 |
| Fixed Asset Turnover | 9.02 | 9.15 |
| Payout ratio | 0 | 0 |
| Dividend yield | 0% | 0% |
| Fiscal Year | 2025 | 2025 |
Efficiency & Valuation Duel: The Vital Signs
Ratios act as a company’s DNA, revealing hidden risks and operational excellence that raw numbers alone cannot capture.
F5, Inc.
F5 exhibits strong profitability with a 19.3% ROE and a commanding 22.4% net margin, signaling operational efficiency. Its valuation metrics, including a P/E of 26.9 and P/B of 5.2, suggest a stretched premium. The company returns value through reinvestment in R&D rather than dividends, fueling growth and innovation.
Nutanix, Inc.
Nutanix shows weaker core profitability, with a negative 27.1% ROE and a modest 7.4% net margin, reflecting operational challenges. Its elevated P/E of 106.7 signals an expensive stock, offset by a favorable P/B ratio. The firm prioritizes heavy R&D investment over dividends, aiming to improve future returns despite near-term losses.
Premium Valuation vs. Operational Safety
F5 balances solid profitability and operational strength but trades at a premium valuation. Nutanix carries higher risk with negative returns and stretched multiples but invests aggressively for growth. Investors seeking stable, efficient returns may prefer F5, while those favoring growth at risk align better with Nutanix’s profile.
Which one offers the Superior Shareholder Reward?
F5, Inc. (FFIV) and Nutanix, Inc. (NTNX) both forgo dividends, focusing on reinvesting free cash flow to fuel growth. FFIV delivers stronger free cash flow per share (15.7 vs. 2.8) and maintains a robust buyback-friendly balance sheet with low debt. NTNX shows high leverage and volatile margins, limiting sustainable buybacks. Historically, FFIV’s capital allocation prioritizes shareholder return through buybacks, supported by healthy operating cash flow coverage and zero dividend payout risk. NTNX’s reinvestment strategy targets growth but bears elevated financial risk. I conclude FFIV offers a more attractive total return profile in 2026 due to its disciplined cash returns and stronger financial footing.
Comparative Score Analysis: The Strategic Profile
The radar chart reveals the fundamental DNA and trade-offs of F5, Inc. and Nutanix, Inc., highlighting their core financial strengths and vulnerabilities:
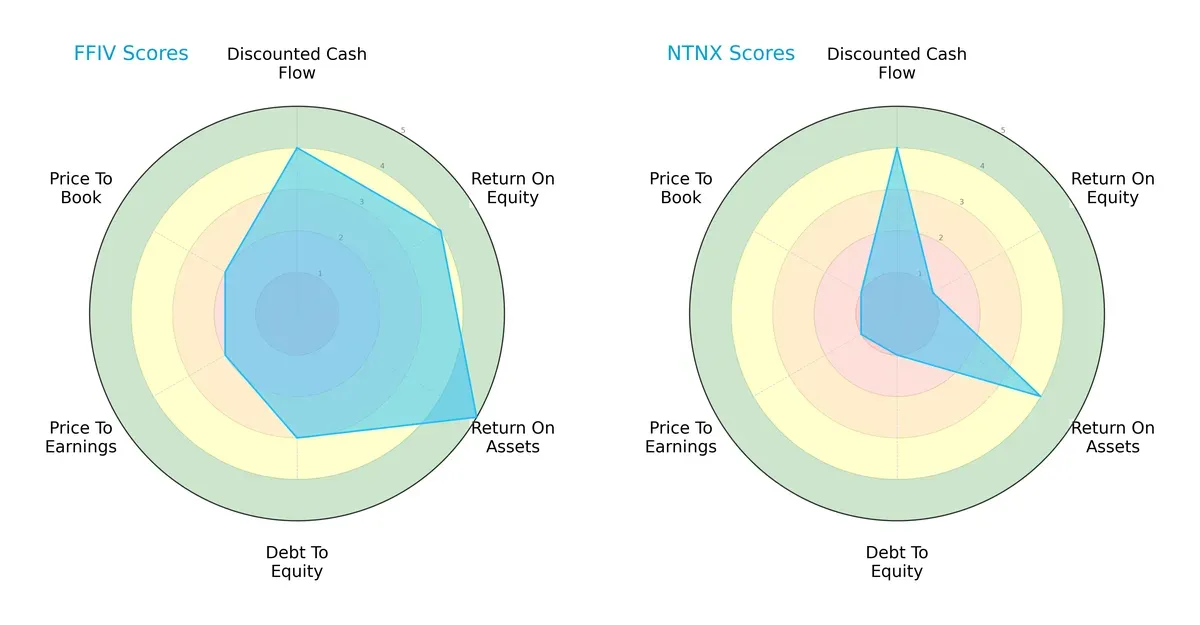
F5 dominates in return on assets (5 vs. 4) and maintains a balanced capital structure with moderate debt-to-equity (3 vs. 1). Nutanix matches F5’s discounted cash flow score (4 each) but lags sharply in return on equity (1 vs. 4) and valuation metrics (PE and PB scores of 1 versus F5’s 2). F5 delivers a more balanced profile, while Nutanix relies heavily on asset efficiency and undervaluation signals.
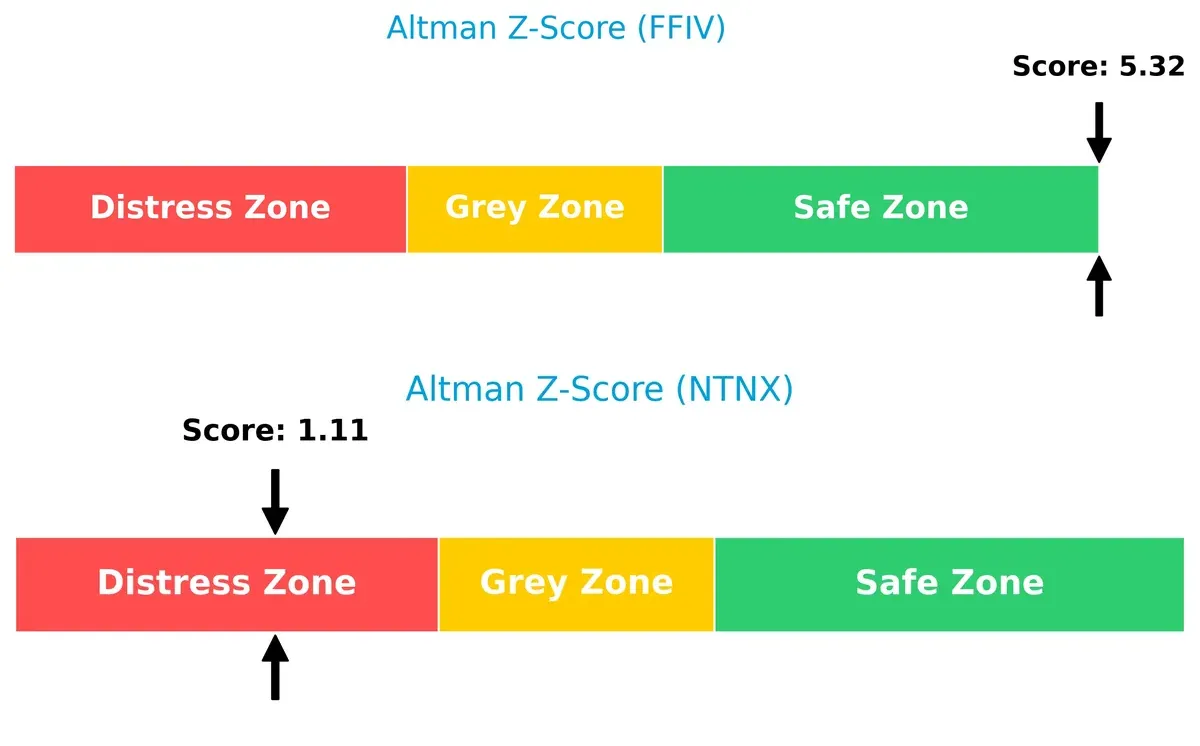
Bankruptcy Risk: Solvency Showdown
F5’s Altman Z-Score of 5.3 places it firmly in the safe zone, signaling strong long-term solvency. Nutanix’s score of 1.1 flags it in the distress zone, highlighting substantial bankruptcy risk in this cycle:
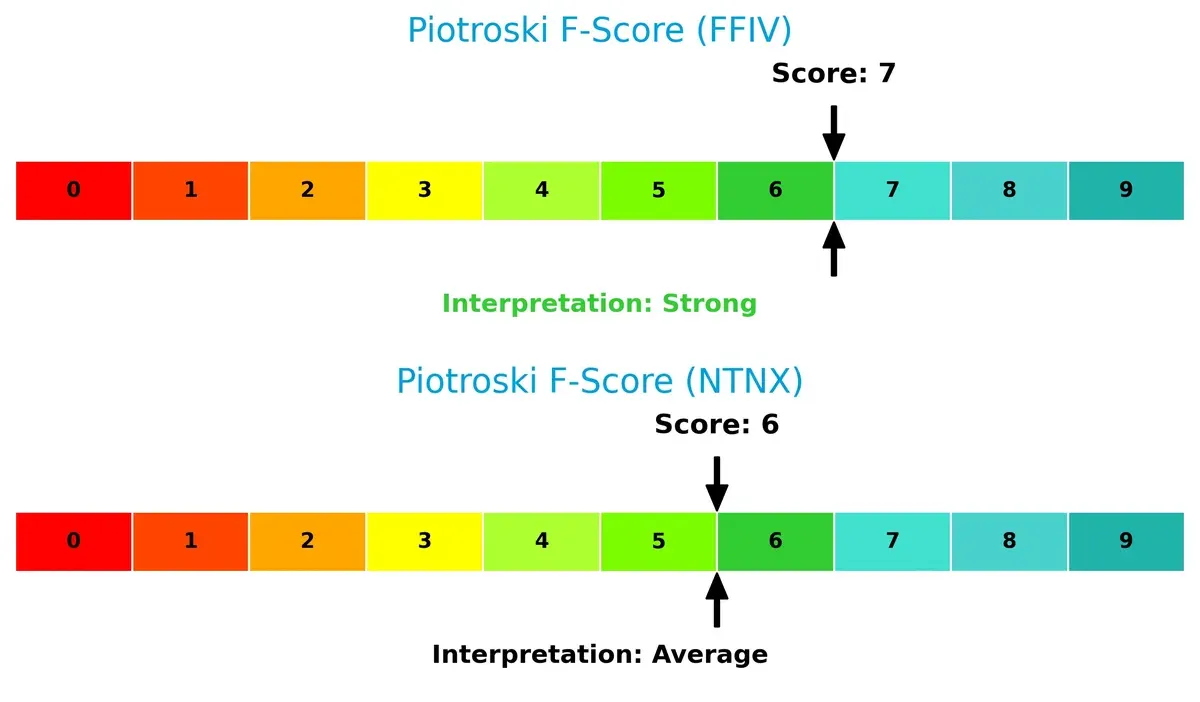
Financial Health: Quality of Operations
F5 scores a robust 7 on the Piotroski scale, reflecting strong financial health. Nutanix’s 6 indicates average strength with potential red flags in internal metrics compared to F5’s superior quality:
How are the two companies positioned?
This section dissects the operational DNA of F5 and Nutanix by comparing their revenue distribution and internal dynamics. The goal is to confront their economic moats to identify which model offers the most resilient competitive advantage today.
Revenue Segmentation: The Strategic Mix
The following visual comparison dissects how both firms diversify their income streams and where their primary sector bets lie:
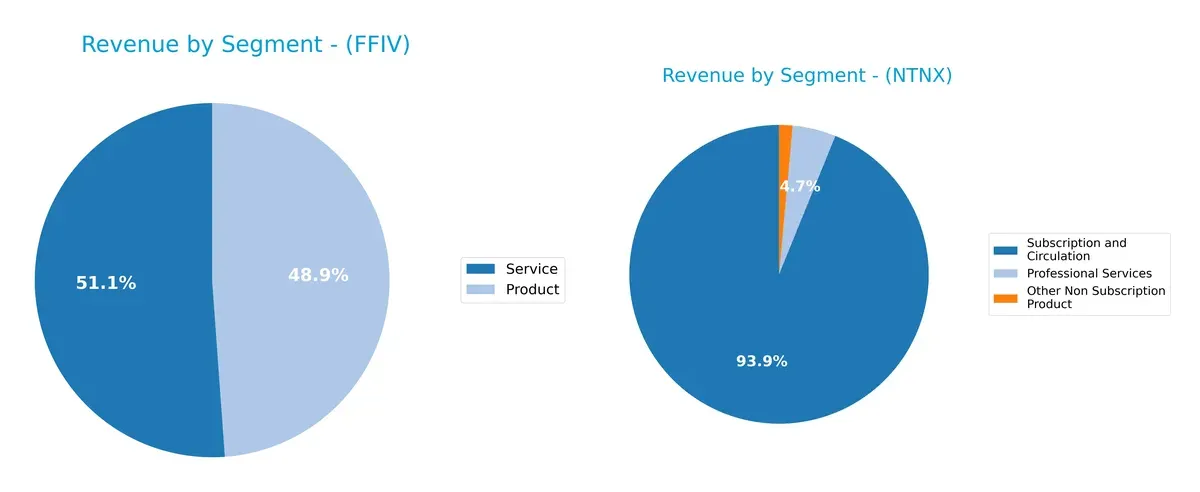
F5, Inc. balances its revenue between Products at $1.51B and Services at $1.58B, showing a well-diversified mix. Nutanix, Inc. leans heavily on Subscription and Circulation, with $2.02B in 2024, dwarfing its Professional Services and Other Non Subscription Product segments. F5’s balanced segmentation reduces concentration risk, while Nutanix pivots around subscription dominance, anchoring its ecosystem but increasing dependency on recurring revenue stability.
Strengths and Weaknesses Comparison
This table compares the strengths and weaknesses of F5, Inc. and Nutanix, Inc. based on diversification, profitability, financials, innovation, global presence, and market share:
F5 Strengths
- Balanced revenue split between products (1.5B) and services (1.6B)
- Strong profitability with net margin 22.4% and ROE 19.3%
- Conservative leverage with debt-to-assets 3.7% and interest coverage infinite
- Solid liquidity ratios current 1.56 and quick 1.51
- High fixed asset turnover 9.02 indicates efficient asset use
- Global presence strong in Americas (1.8B), EMEA (827M), and Asia Pacific (537M)
Nutanix Strengths
- Subscription-centric revenue (2.0B) with growing professional services
- Favorable WACC 5.8% supports capital efficiency
- Strong liquidity with current and quick ratios at 1.72
- Positive interest coverage 11.15 reflects ability to service debt
- High fixed asset turnover 9.15
- Expanding global footprint led by US (1.2B) and EMEA (563M)
F5 Weaknesses
- Asset turnover low at 0.49 compared to peers, indicating lower sales efficiency
- High P/B ratio 5.19 and P/E 26.9 suggest expensive valuation
- No dividend yield limits income appeal
- Moderate reliance on Americas region limits geographic diversification
Nutanix Weaknesses
- Negative ROE at -27.1% signals profitability challenges
- High P/E 106.7 reflects market skepticism on earnings
- Debt/equity ratio negative, indicating complex capital structure
- High debt-to-assets 45.2% may constrain financial flexibility
- No dividend yield reduces shareholder returns
F5 demonstrates strong profitability and balanced revenue streams with conservative leverage. Nutanix benefits from subscription focus and liquidity but faces profitability and capital structure headwinds. Each company’s financial profile suggests different strategic priorities.
The Moat Duel: Analyzing Competitive Defensibility
A structural moat is the only reliable shield protecting long-term profits from relentless competition erosion. Let’s dissect the moats of two leaders in software infrastructure:
F5, Inc.: Hardware-Software Integration Moat
F5’s moat hinges on unique hardware-software synergy, delivering high ROIC (5.7% above WACC) and stable 26% EBIT margins. Their multi-cloud security products deepen this moat amid rising cloud adoption in 2026.
Nutanix, Inc.: Cloud-Native Platform Network Effects
Nutanix rides network effects from its hybrid cloud platform, showing rapid ROIC growth (+117%) and expanding revenue (+82% over five years). Its software automation suite offers opportunities to disrupt traditional infrastructure in 2026.
Legacy Architecture vs. Cloud-Native Network Effects
F5’s moat is wider due to integrated hardware advantages, but Nutanix’s rapidly expanding ROIC signals a deepening competitive edge. Nutanix appears better positioned to capture future market share in cloud-native infrastructure.
Which stock offers better returns?
The past year reveals distinct trajectories: F5, Inc. surges with accelerating gains, while Nutanix, Inc. faces continued declines marked by deceleration.
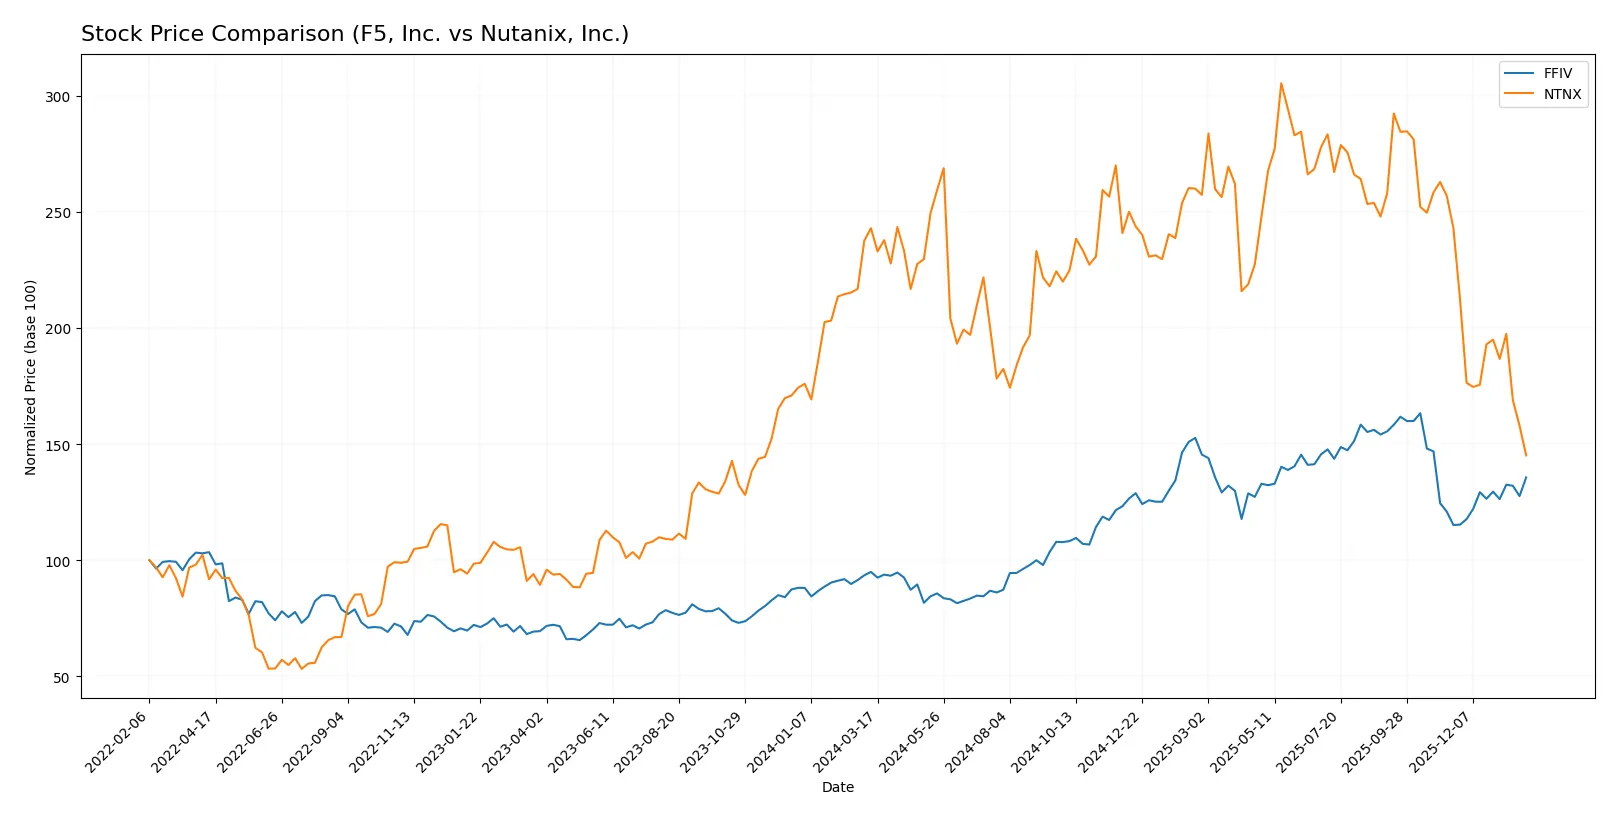
Trend Comparison
F5, Inc. shows a strong bullish trend with a 42.85% price increase over 12 months, accelerating momentum, and high volatility marked by a 48.51 standard deviation. Its price ranged from 165.57 to 331.75.
Nutanix, Inc. exhibits a bearish trend, declining 40.27% over the same period with decelerating losses and lower volatility at 9.26 standard deviation. The stock fell from 82.77 to 39.33.
F5, Inc. outperforms Nutanix, Inc. by delivering robust gains versus sharp declines, making it the superior market performer in this timeframe.
Target Prices
Analysts set a bullish target consensus for both F5, Inc. and Nutanix, Inc., signaling upside potential versus current prices.
| Company | Target Low | Target High | Consensus |
|---|---|---|---|
| F5, Inc. | 295 | 352 | 330.67 |
| Nutanix, Inc. | 53 | 90 | 64.67 |
F5’s target consensus at 330.67 exceeds its current price of 275.61, implying a 20% upside. Nutanix’s consensus at 64.67 also suggests significant appreciation from its 39.33 price.

Don’t Let Luck Decide Your Entry Point
Optimize your entry points with our advanced ProRealTime indicators. You’ll get efficient buy signals with precise price targets for maximum performance. Start outperforming now!
How do institutions grade them?
Here are the latest institutional grades assigned to F5, Inc. and Nutanix, Inc.:
F5, Inc. Grades
The table below summarizes recent grades from key financial institutions for F5, Inc.
| Grading Company | Action | New Grade | Date |
|---|---|---|---|
| Needham | Maintain | Hold | 2026-01-28 |
| Piper Sandler | Maintain | Overweight | 2026-01-28 |
| Goldman Sachs | Maintain | Neutral | 2026-01-28 |
| Barclays | Maintain | Equal Weight | 2026-01-28 |
| RBC Capital | Maintain | Outperform | 2026-01-28 |
| JP Morgan | Upgrade | Overweight | 2026-01-15 |
| Piper Sandler | Upgrade | Overweight | 2026-01-05 |
| RBC Capital | Upgrade | Outperform | 2026-01-05 |
| Morgan Stanley | Maintain | Equal Weight | 2025-12-17 |
| Morgan Stanley | Maintain | Equal Weight | 2025-10-28 |
Nutanix, Inc. Grades
Below are recent institutional grades issued for Nutanix, Inc. by established firms.
| Grading Company | Action | New Grade | Date |
|---|---|---|---|
| Barclays | Downgrade | Equal Weight | 2026-01-15 |
| Morgan Stanley | Downgrade | Equal Weight | 2026-01-12 |
| RBC Capital | Maintain | Outperform | 2026-01-05 |
| Goldman Sachs | Maintain | Buy | 2025-11-28 |
| JP Morgan | Maintain | Overweight | 2025-11-26 |
| B of A Securities | Maintain | Buy | 2025-11-26 |
| Keybanc | Maintain | Overweight | 2025-11-26 |
| Needham | Maintain | Buy | 2025-11-26 |
| Wells Fargo | Maintain | Equal Weight | 2025-11-26 |
| Morgan Stanley | Maintain | Overweight | 2025-11-26 |
Which company has the best grades?
F5, Inc. has a mixed consensus with multiple “Hold” and “Equal Weight” ratings but recent upgrades to “Overweight” and “Outperform.” Nutanix, Inc. holds stronger “Buy” and “Overweight” ratings despite recent downgrades to “Equal Weight.” Investors may weigh Nutanix’s higher bullish sentiment against F5’s more cautious outlook.
Risks specific to each company
The following categories identify critical pressure points and systemic threats facing F5, Inc. and Nutanix, Inc. in the 2026 market environment:
1. Market & Competition
F5, Inc.
- Strong market presence with mature product suite but faces intense competition from cloud-native security vendors.
Nutanix, Inc.
- Faces fierce competition from hyperscale cloud providers and established virtualization players, struggling to maintain growth momentum.
2. Capital Structure & Debt
F5, Inc.
- Low debt-to-equity (0.06) and strong interest coverage indicate a very conservative capital structure.
Nutanix, Inc.
- Higher debt-to-assets (45%) and negative debt-to-equity reflect leveraged balance sheet and potential financial risk.
3. Stock Volatility
F5, Inc.
- Beta near 1 (0.975) aligns with market volatility, signaling moderate price swings.
Nutanix, Inc.
- Low beta (0.49) suggests lower market risk but may also indicate limited investor confidence or liquidity issues.
4. Regulatory & Legal
F5, Inc.
- Operates globally with exposure to data privacy and cybersecurity regulations, but robust compliance mitigates risk.
Nutanix, Inc.
- Similar regulatory environment; however, rapid product innovation increases risk of compliance gaps.
5. Supply Chain & Operations
F5, Inc.
- Hardware reliance exposes it to supply chain disruptions, though diversified software offerings reduce impact.
Nutanix, Inc.
- Primarily software-based, less vulnerable to hardware supply constraints but dependent on cloud infrastructure partners.
6. ESG & Climate Transition
F5, Inc.
- Moderate ESG risks; technology sector scrutiny on energy consumption and data center emissions.
Nutanix, Inc.
- Faces similar ESG challenges; cloud efficiency initiatives offer opportunities but require capital investment.
7. Geopolitical Exposure
F5, Inc.
- Global operations expose it to trade tensions and export controls, especially in security products.
Nutanix, Inc.
- Also exposed globally but heightened risk in emerging markets sensitive to political instability.
Which company shows a better risk-adjusted profile?
F5’s strongest risk is supply chain exposure due to hardware components, while Nutanix’s capital structure risk dominates given its leveraged balance sheet and distress-level Altman Z-score. F5’s solid financial health and conservative leverage yield a superior risk-adjusted profile. Nutanix’s financial distress signals heightened vulnerability despite lower market volatility. The stark contrast in Altman Z-scores (5.3 for F5 vs. 1.1 for Nutanix) underscores my concern about Nutanix’s solvency risks in 2026.
Final Verdict: Which stock to choose?
F5, Inc. stands out as a cash-generating powerhouse with a durable competitive moat. Its consistent value creation, marked by growing ROIC above WACC, underpins operational efficiency. A point of vigilance remains its relatively high valuation multiples. It suits portfolios aiming for disciplined, long-term growth with moderate risk tolerance.
Nutanix, Inc. leverages a strategic moat in cloud infrastructure and recurring revenues, which supports robust revenue growth. Its safety profile, however, lags behind F5’s due to weaker profitability and financial distress signals. Nutanix fits investors targeting growth at a reasonable price with a tolerance for higher volatility and turnaround potential.
If you prioritize stable capital efficiency and a proven economic moat, F5 outshines as the compelling choice due to its strong financial health and consistent profitability. However, if you seek high-growth exposure with a focus on cloud innovation, Nutanix offers superior top-line momentum but demands acceptance of elevated risk and valuation uncertainty.
Disclaimer: Investment carries a risk of loss of initial capital. The past performance is not a reliable indicator of future results. Be sure to understand risks before making an investment decision.
Go Further
I encourage you to read the complete analyses of F5, Inc. and Nutanix, Inc. to enhance your investment decisions: