Home > Comparison > Technology > MDB vs FFIV
The strategic rivalry between MongoDB, Inc. and F5, Inc. shapes the evolution of the technology sector’s infrastructure landscape. MongoDB operates as a cloud-agnostic database platform with a strong developer focus. In contrast, F5 delivers multi-cloud application security and delivery solutions targeting enterprise clients. This head-to-head pits innovative software scalability against robust security services. This analysis aims to identify which business model offers superior risk-adjusted returns for a diversified portfolio in 2026.
Table of contents
Companies Overview
MongoDB, Inc. and F5, Inc. stand as pivotal players in the software infrastructure market, shaping enterprise cloud and security landscapes.
MongoDB, Inc.: Cloud-First Database Innovator
MongoDB, Inc. leads as a general purpose database platform provider with a focus on multi-cloud and hybrid environments. Its core revenue stems from commercial database servers like MongoDB Enterprise Advanced and the cloud-hosted MongoDB Atlas service. In 2026, MongoDB sharpens its competitive edge by expanding cloud capabilities and professional services to support enterprise digital transformations.
F5, Inc.: Multi-Cloud Security and Delivery Specialist
F5, Inc. dominates the multi-cloud application security and delivery arena, offering integrated hardware and software solutions to secure and optimize network applications. Its revenue depends heavily on product suites like BIG-IP appliances and NGINX software, alongside professional services. The company’s 2026 strategy emphasizes partnerships with cloud providers and innovation in cybersecurity to protect hybrid infrastructures.
Strategic Collision: Similarities & Divergences
Both firms operate within software infrastructure but diverge sharply: MongoDB champions a platform-centric open database approach, while F5 pursues a closed ecosystem of security and delivery solutions. Their primary battleground lies in serving enterprises migrating to hybrid and multi-cloud architectures. MongoDB presents a growth-driven profile with cloud scalability, whereas F5 offers a more defensive investment appeal through established security footholds.
Income Statement Comparison
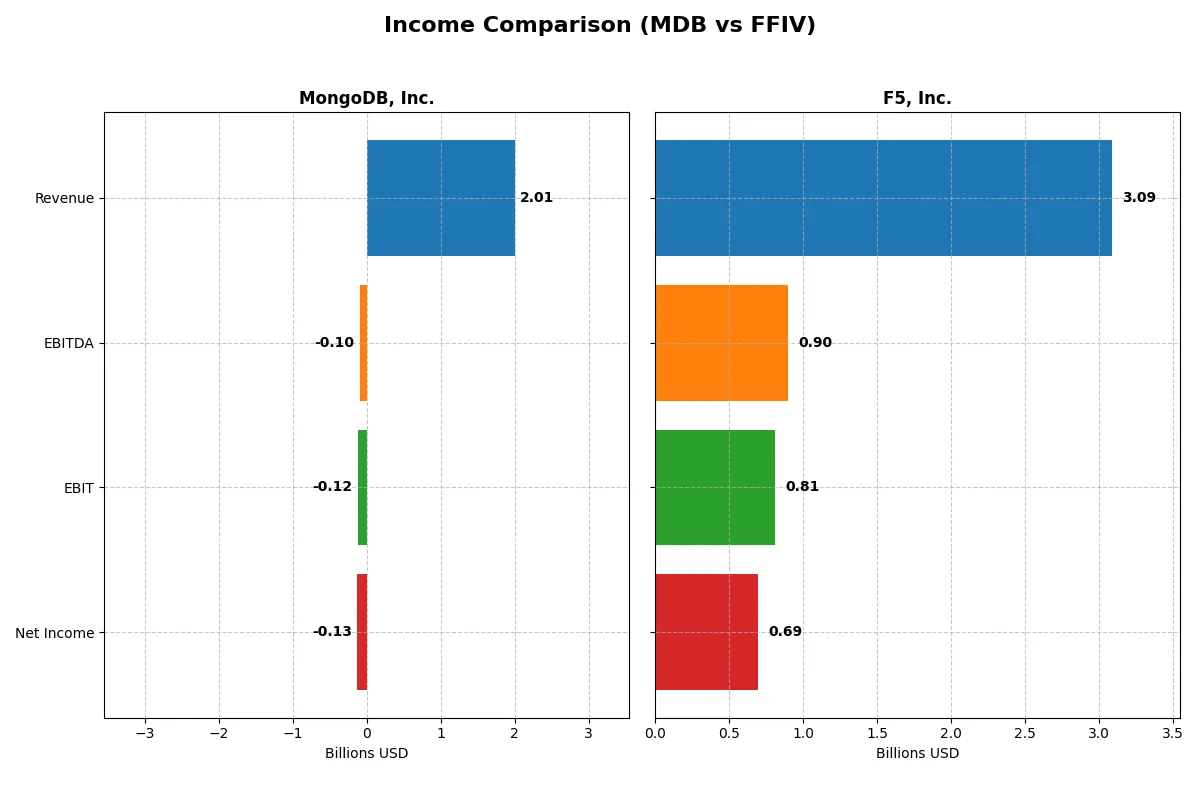
This data dissects the core profitability and scalability of both corporate engines to reveal who dominates the bottom line:
| Metric | MongoDB, Inc. (MDB) | F5, Inc. (FFIV) |
|---|---|---|
| Revenue | 2.01B | 3.09B |
| Cost of Revenue | 535M | 564M |
| Operating Expenses | 1.69B | 1.76B |
| Gross Profit | 1.47B | 2.52B |
| EBITDA | -97M | 901M |
| EBIT | -124M | 808M |
| Interest Expense | 8.1M | 0 |
| Net Income | -129M | 692M |
| EPS | -1.73 | 11.95 |
| Fiscal Year | 2025 | 2025 |
Income Statement Analysis: The Bottom-Line Duel
This income statement comparison reveals each company’s operational efficiency and profitability dynamics over recent years.
MongoDB, Inc. Analysis
MongoDB’s revenue surged from 590M in 2021 to 2.01B in 2025, showing strong top-line growth. Despite a robust gross margin of 73.3%, the company remains unprofitable with a negative net margin of -6.4%. Recent years show narrowing losses and improving net margin momentum, signaling progress but ongoing operational challenges.
F5, Inc. Analysis
F5’s revenue climbed steadily from 2.6B in 2021 to 3.09B in 2025, supporting a robust gross margin near 81.7%. The company sustains a healthy net margin of 22.4%, reflecting high operational efficiency and scalability. Profitability and EPS growth remain strong, driven by disciplined expense control and solid EBIT expansion.
Margin Power vs. Revenue Scale
F5 dominates in profitability with a strong net margin and consistent earnings growth, while MongoDB impresses with rapid revenue expansion but still struggles with losses. For investors, F5’s stable profit profile offers reliability, whereas MongoDB’s growth focus entails higher risk but potential upside.
Financial Ratios Comparison
These vital ratios act as a diagnostic tool to expose the underlying fiscal health, valuation premiums, and capital efficiency of the companies compared below:
| Ratios | MongoDB, Inc. (MDB) | F5, Inc. (FFIV) |
|---|---|---|
| ROE | -4.6% | 19.3% |
| ROIC | -7.4% | 14.0% |
| P/E | -158x | 27x |
| P/B | 7.32 | 5.19 |
| Current Ratio | 5.20 | 1.56 |
| Quick Ratio | 5.20 | 1.51 |
| D/E | 0.013 | 0.064 |
| Debt-to-Assets | 1.1% | 3.7% |
| Interest Coverage | -26.7x | 0x |
| Asset Turnover | 0.58 | 0.49 |
| Fixed Asset Turnover | 24.78 | 9.02 |
| Payout ratio | 0 | 0 |
| Dividend yield | 0% | 0% |
| Fiscal Year | 2025 | 2025 |
Efficiency & Valuation Duel: The Vital Signs
Ratios serve as a company’s DNA, uncovering hidden risks and operational strengths crucial for informed investment decisions.
MongoDB, Inc.
MongoDB shows negative returns on equity (-4.6%) and invested capital (-7.4%), signaling unprofitable core operations. Its P/E ratio is negative but reflects losses, while P/B at 7.3 marks a stretched valuation. The company pays no dividend, reinvesting heavily in R&D (29.7% of revenue) to fuel growth despite unfavorable financial health.
F5, Inc.
F5 posts strong profitability with a 19.3% ROE and 14.0% ROIC, indicating efficient capital use. The P/E of 26.9 suggests a premium valuation in line with its solid financials. F5 maintains a conservative balance sheet and does not pay dividends, instead generating robust free cash flow for potential shareholder returns or reinvestment.
Premium Valuation vs. Operational Safety
F5 offers a better balance of profitability and financial stability despite a higher valuation multiple. MongoDB’s stretched valuation contrasts with its negative returns, presenting higher risk. Investors prioritizing operational safety and consistent returns may find F5’s profile more fitting.
Which one offers the Superior Shareholder Reward?
MongoDB, Inc. (MDB) does not pay dividends or conduct share buybacks, reinvesting heavily in growth and R&D despite negative net margins and high valuation multiples (P/FCF ~169x in 2025). F5, Inc. (FFIV) also pays no dividends but returns capital via aggressive buybacks, supported by strong profitability (22% net margin) and solid free cash flow (15.7/share in 2025) at a reasonable P/FCF of ~21x. I see FFIV’s disciplined buyback program and sustainable cash flows as offering superior shareholder rewards compared to MDB’s unproven reinvestment strategy and persistent losses.
Comparative Score Analysis: The Strategic Profile
The radar chart reveals the fundamental DNA and trade-offs of MongoDB, Inc. and F5, Inc., highlighting their distinct strategic strengths and financial balances:
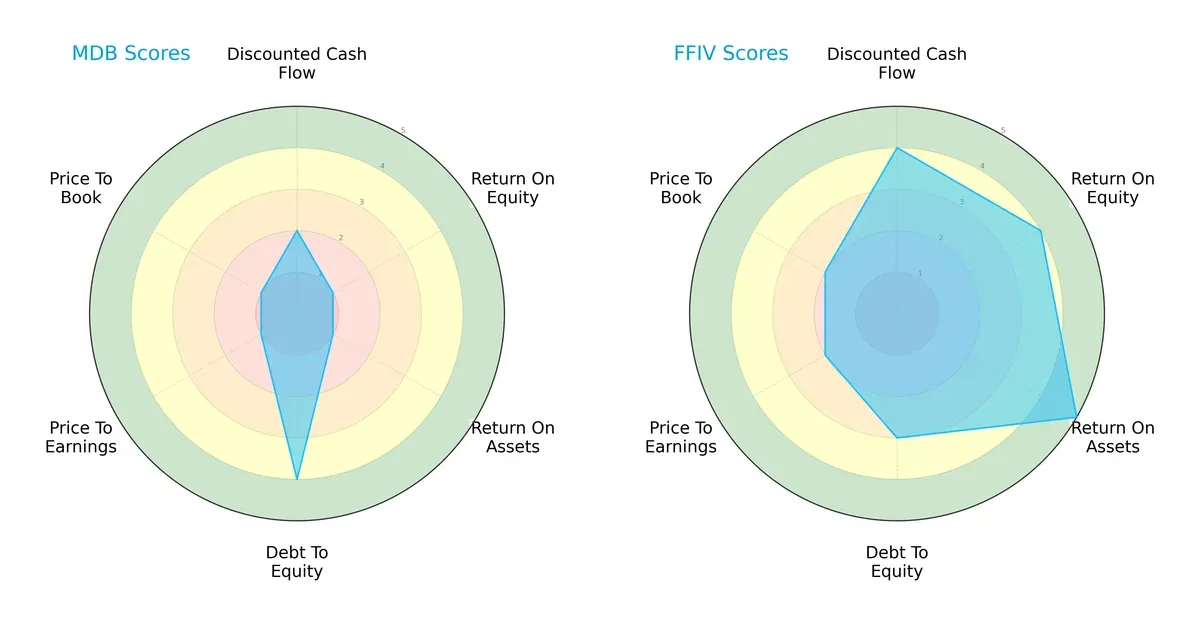
F5, Inc. shows a more balanced profile with strong DCF (4), ROE (4), and ROA (5) scores, reflecting efficient capital allocation and asset utilization. MongoDB, Inc. relies heavily on a low debt load (Debt/Equity score 4) but suffers from poor profitability and valuation metrics (ROE 1, ROA 1, PE/PB 1). This suggests F5 maintains consistent operational strength, while MongoDB depends on cautious leverage management amid weaker earnings.
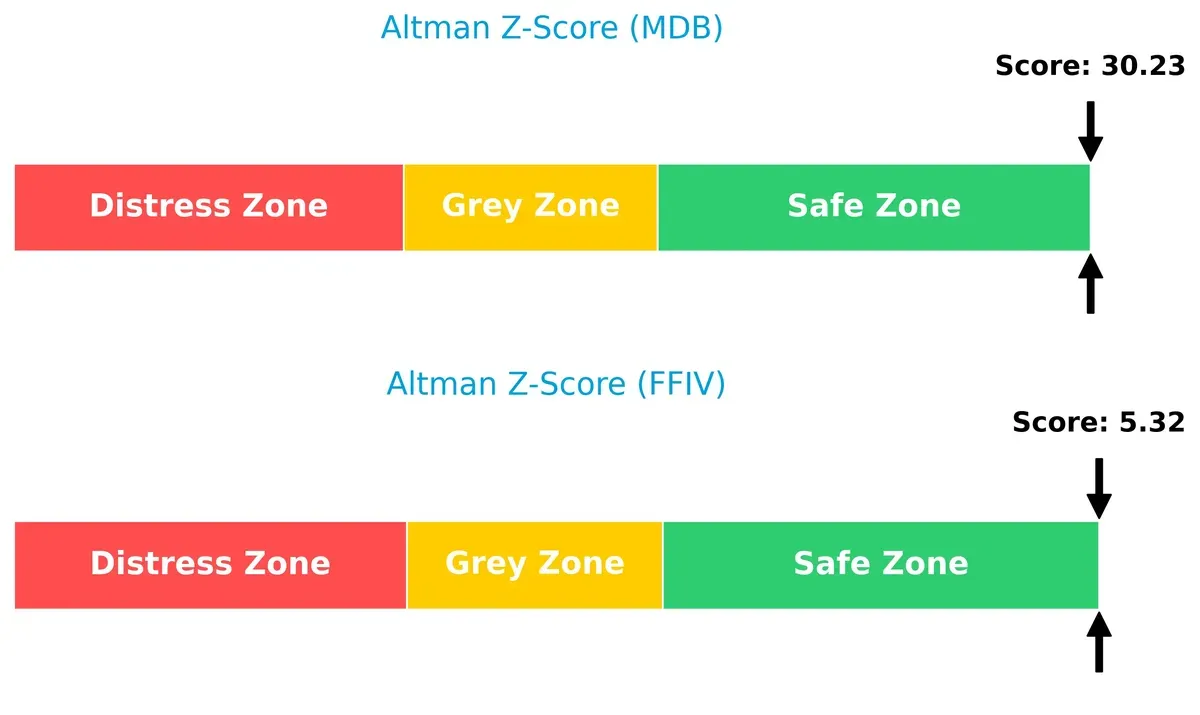
Bankruptcy Risk: Solvency Showdown
F5’s Altman Z-Score of 5.3 versus MongoDB’s 30.2 places both firms safely above distress levels; however, MongoDB’s extremely high score signals exceptional financial stability beyond typical industry norms:
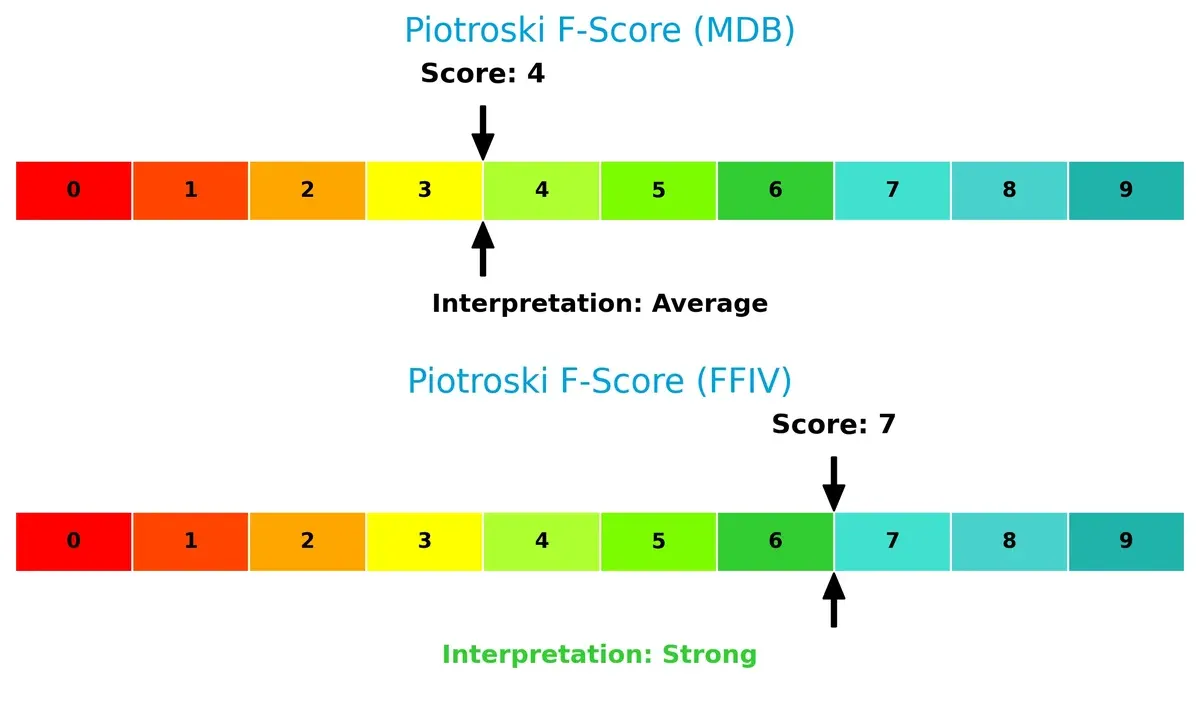
Financial Health: Quality of Operations
F5’s Piotroski F-Score of 7 indicates strong financial health, contrasting with MongoDB’s average score of 4, which raises red flags about internal operational efficiency and profitability metrics:
How are the two companies positioned?
This section dissects the operational DNA of MongoDB and F5 by comparing their revenue distribution and internal strengths and weaknesses. The goal is to confront their economic moats and identify which business model delivers the most resilient competitive advantage today.
Revenue Segmentation: The Strategic Mix
The following comparison dissects how MongoDB and F5 diversify their income streams and reveals their primary sector bets for 2025:
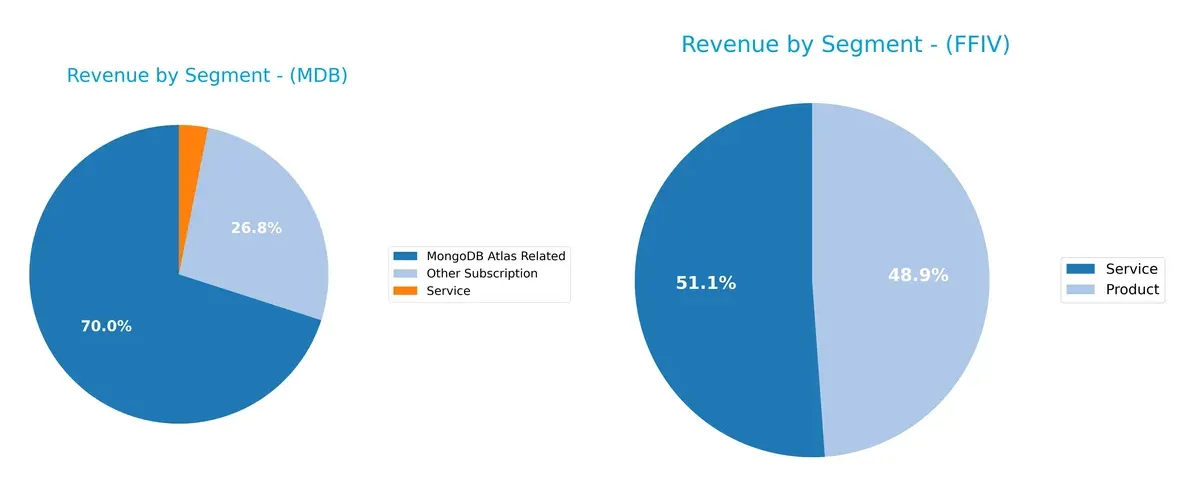
MongoDB leans heavily on its MongoDB Atlas Related segment, generating $1.41B, which dwarfs its Other Subscription ($539M) and Service ($63M) revenues. This concentration anchors MongoDB’s cloud-native database strategy but introduces concentration risk. By contrast, F5 balances its $1.51B Product and $1.58B Service revenues, reflecting a diversified model that pivots on infrastructure and managed services, reducing dependency on a single segment and enhancing ecosystem lock-in.
Strengths and Weaknesses Comparison
This table compares the Strengths and Weaknesses of MongoDB, Inc. and F5, Inc.:
MongoDB, Inc. Strengths
- High fixed asset turnover at 24.78
- Very low debt to equity and debt to assets ratios
- Strong quick ratio at 5.2
- Significant revenue growth in MongoDB Atlas segment
- Diversified revenue streams across subscriptions and services
- Expanding global presence with growing Americas and EMEA sales
F5, Inc. Strengths
- Strong profitability with net margin of 22.42% and ROE of 19.28%
- Favorable ROIC exceeding WACC at 13.99%
- Balanced product and service revenue near 1.5B USD each
- Healthy current and quick ratios near 1.5
- Global reach with large Americas and Asia Pacific sales
- Low leverage and infinite interest coverage
MongoDB, Inc. Weaknesses
- Negative net margin, ROE, and ROIC indicating profitability issues
- Unfavorable high WACC at 10.32%
- Negative interest coverage signal financial strain
- High price-to-book ratio at 7.32
- Current ratio flagged unfavorable despite high value
- Zero dividend yield limits income appeal
F5, Inc. Weaknesses
- Unfavorable price-to-earnings and price-to-book ratios
- Asset turnover below 0.5 suggests lower operational efficiency
- Zero dividend yield limits investor income
- Moderate leverage higher than MongoDB
- Slightly lower fixed asset turnover at 9.02
MongoDB shows strengths in asset utilization and low leverage but struggles with profitability and valuation metrics. F5 demonstrates robust profitability and financial health but faces valuation and asset efficiency challenges. These profiles reflect distinct strategic positions in their markets.
The Moat Duel: Analyzing Competitive Defensibility
A structural moat protects long-term profits from relentless competitive pressure. Its presence signals sustainable economic profits and market resilience:
MongoDB, Inc.: Network Effects and Developer Ecosystem
MongoDB’s moat stems from strong network effects and widespread developer adoption. Despite negative ROIC versus WACC, improving profitability signals growing economic value. Expansion into multi-cloud services could deepen this moat in 2026.
F5, Inc.: Cost Advantage and Integrated Security Solutions
F5’s moat relies on cost advantage through integrated hardware-software security solutions. It consistently generates ROIC above WACC, reflecting efficient capital use. Continued cloud partnerships position F5 to disrupt legacy players and expand market reach.
Network Effects vs. Cost Leadership: The Moat Showdown
F5 holds a wider moat with sustained ROIC above WACC and steady profitability growth. MongoDB’s rising margins show potential but still lag in value creation. F5 is better equipped to defend its market share amid intensifying competition.
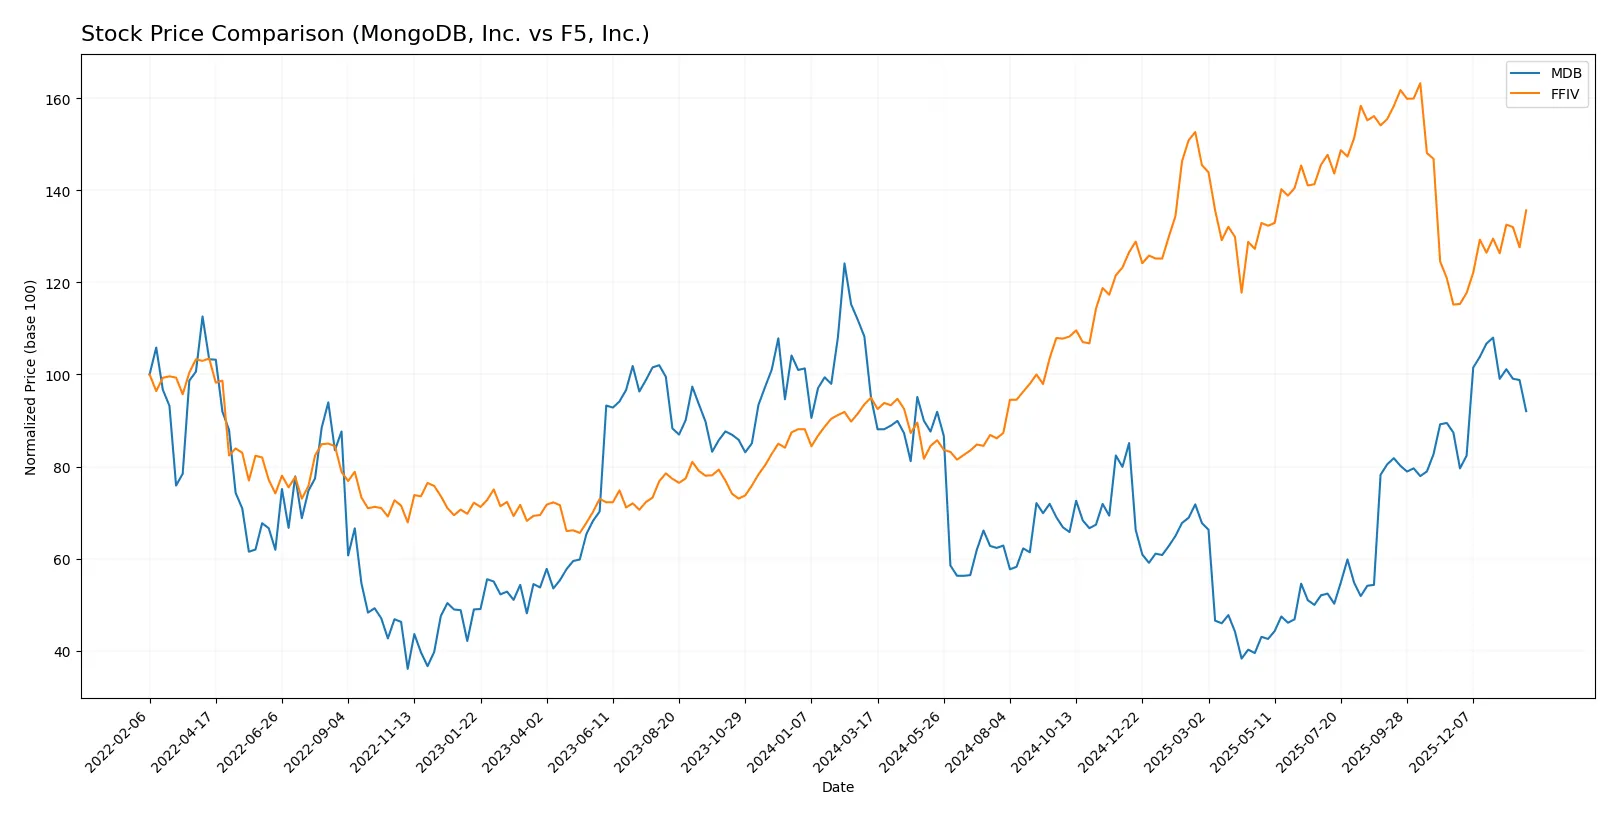
Which stock offers better returns?
Over the past year, MongoDB, Inc. experienced a bearish trend with accelerating decline, while F5, Inc. posted a strong and accelerating bullish rally, reflecting sharper gains and higher buyer dominance.
Trend Comparison
MongoDB, Inc. shows a 3.15% price decline over 12 months, marking a bearish trend with acceleration. The stock ranged from 154.39 to 435.85 with high volatility (std dev 70.31).
F5, Inc. delivered a robust 42.85% price increase over 12 months, signaling a bullish trend with acceleration. Its price fluctuated between 165.57 and 331.75, with moderate volatility (std dev 48.51).
F5, Inc. clearly outperformed MongoDB, Inc. in market returns, showing stronger price appreciation and sustained buyer dominance across the period.
Target Prices
Analysts set confident target ranges for MongoDB, Inc. and F5, Inc., indicating upside potential from current prices.
| Company | Target Low | Target High | Consensus |
|---|---|---|---|
| MongoDB, Inc. | 375 | 500 | 445.2 |
| F5, Inc. | 295 | 352 | 330.67 |
Both stocks trade below their consensus targets, implying analyst optimism. MongoDB’s target consensus exceeds its current 371.33 price by nearly 20%. F5’s consensus target sits roughly 20% above the 275.61 current price.

Don’t Let Luck Decide Your Entry Point
Optimize your entry points with our advanced ProRealTime indicators. You’ll get efficient buy signals with precise price targets for maximum performance. Start outperforming now!
How do institutions grade them?
The following tables summarize recent institutional grades for MongoDB, Inc. and F5, Inc.:
MongoDB, Inc. Grades
Here are the latest grades assigned by reputable institutions to MongoDB, Inc.:
| Grading Company | Action | New Grade | Date |
|---|---|---|---|
| Needham | Maintain | Buy | 2026-01-20 |
| Barclays | Maintain | Overweight | 2026-01-12 |
| Needham | Maintain | Buy | 2026-01-12 |
| Truist Securities | Maintain | Buy | 2026-01-07 |
| Needham | Maintain | Buy | 2026-01-06 |
| RBC Capital | Maintain | Outperform | 2026-01-05 |
| Argus Research | Maintain | Buy | 2025-12-04 |
| Goldman Sachs | Maintain | Buy | 2025-12-03 |
| Citigroup | Maintain | Buy | 2025-12-03 |
| Bernstein | Maintain | Outperform | 2025-12-02 |
F5, Inc. Grades
This table lists recent institutional grades for F5, Inc. from verified sources:
| Grading Company | Action | New Grade | Date |
|---|---|---|---|
| Needham | Maintain | Hold | 2026-01-28 |
| Piper Sandler | Maintain | Overweight | 2026-01-28 |
| Goldman Sachs | Maintain | Neutral | 2026-01-28 |
| Barclays | Maintain | Equal Weight | 2026-01-28 |
| RBC Capital | Maintain | Outperform | 2026-01-28 |
| JP Morgan | Upgrade | Overweight | 2026-01-15 |
| Piper Sandler | Upgrade | Overweight | 2026-01-05 |
| RBC Capital | Upgrade | Outperform | 2026-01-05 |
| Morgan Stanley | Maintain | Equal Weight | 2025-12-17 |
| Morgan Stanley | Maintain | Equal Weight | 2025-10-28 |
Which company has the best grades?
MongoDB, Inc. consistently receives Buy and Outperform ratings from top firms, while F5, Inc.’s grades range from Hold to Outperform. MongoDB’s stronger grades may indicate greater institutional confidence, influencing investor sentiment.
Risks specific to each company
The following categories identify the critical pressure points and systemic threats facing both firms in the 2026 market environment:
1. Market & Competition
MongoDB, Inc.
- Faces intense competition in cloud database services with rapid innovation cycles.
F5, Inc.
- Competes in multi-cloud application security with established cloud provider partnerships.
2. Capital Structure & Debt
MongoDB, Inc.
- Virtually debt-free with a low debt-to-assets ratio, minimizing financial risk.
F5, Inc.
- Maintains low debt levels with favorable debt metrics but slightly higher leverage than MongoDB.
3. Stock Volatility
MongoDB, Inc.
- High beta (1.38) indicates greater price volatility and sensitivity to market swings.
F5, Inc.
- Beta near 1 (0.98) suggests moderate volatility aligned with broader market movements.
4. Regulatory & Legal
MongoDB, Inc.
- Subject to evolving data privacy and cloud regulations impacting global operations.
F5, Inc.
- Faces regulatory scrutiny in cybersecurity and data protection across multiple jurisdictions.
5. Supply Chain & Operations
MongoDB, Inc.
- Operates primarily cloud-based services with lower physical supply chain risks.
F5, Inc.
- Relies on hardware and software integration, exposing it to component supply constraints.
6. ESG & Climate Transition
MongoDB, Inc.
- Increasing pressure to reduce carbon footprint in data centers and cloud infrastructure.
F5, Inc.
- Faces ESG demands related to energy consumption and sustainable product lifecycle management.
7. Geopolitical Exposure
MongoDB, Inc.
- Global cloud presence exposes it to geopolitical tensions affecting data sovereignty laws.
F5, Inc.
- Broad international operations increase risk from trade restrictions and geopolitical conflicts.
Which company shows a better risk-adjusted profile?
MongoDB’s most impactful risk is its high stock volatility and unfavorable profitability metrics, raising concerns about consistent earnings. F5’s greatest risk lies in supply chain dependencies and moderate leverage but benefits from stable profitability and lower volatility. F5 presents a stronger risk-adjusted profile, supported by a safer Altman Z-score and robust Piotroski score, reflecting better financial health and operational resilience amid 2026’s challenges.
Final Verdict: Which stock to choose?
MongoDB’s superpower lies in its rapid revenue growth and expanding gross margins, signaling strong market demand and innovation. However, its consistent value destruction and weak profitability remain points of vigilance. It suits investors chasing aggressive growth with a tolerance for operational risks.
F5 stands out with a durable moat driven by solid return on invested capital surpassing its cost of capital, reflecting efficient capital deployment and competitive strength. Its robust profitability and financial stability offer a safer profile compared to MongoDB. This makes it appealing for those seeking growth at a reasonable price with better downside protection.
If you prioritize high-growth opportunities with a willingness to endure volatility, MongoDB could be compelling due to its accelerating revenue and innovation runway. However, if you seek superior stability and proven value creation, F5 outshines as the more prudent choice, commanding a premium for its consistent profitability and financial health.
Disclaimer: Investment carries a risk of loss of initial capital. The past performance is not a reliable indicator of future results. Be sure to understand risks before making an investment decision.
Go Further
I encourage you to read the complete analyses of MongoDB, Inc. and F5, Inc. to enhance your investment decisions: