Home > Comparison > Technology > FFIV vs INFA
The strategic rivalry between F5, Inc. and Informatica Inc. shapes the evolution of the technology sector’s software infrastructure landscape. F5, a multi-cloud application security and delivery powerhouse, contrasts with Informatica’s AI-driven data management platform. This head-to-head pits hardware-accelerated security against cloud-native data integration innovation. This analysis will determine which trajectory offers a superior risk-adjusted return for a diversified portfolio amid ongoing digital transformation.
Table of contents
Companies Overview
F5, Inc. and Informatica Inc. stand as pivotal players in the software infrastructure market, shaping enterprise technology landscapes.
F5, Inc.: Multi-cloud Application Security Leader
F5, Inc. dominates as a provider of multi-cloud application security and delivery solutions. It generates revenue primarily by selling hardware and software that enhance the security, performance, and availability of network applications. In 2026, its strategic focus sharpened on integrating advanced cloud partnerships with Amazon, Microsoft, and Google, reinforcing its edge in hybrid and public cloud architectures.
Informatica Inc.: AI-Powered Data Management Specialist
Informatica Inc. excels in developing an AI-driven platform that unifies data across multi-cloud and hybrid environments. Its core revenue derives from a suite of interoperable data management products that enable data integration, governance, and quality improvements. The company’s 2026 strategy emphasized expanding its data governance and privacy offerings to meet growing regulatory demands and enhance enterprise data trustworthiness.
Strategic Collision: Similarities & Divergences
Both companies operate within software infrastructure but diverge sharply in focus—F5 pursues a security-centric, application delivery model, while Informatica champions data management and AI integration. Their primary battleground lies in serving enterprises navigating cloud complexity, yet their products address different layers of IT infrastructure. This distinction carves unique investment profiles: F5’s moat is in network security hardware/software synergy; Informatica’s strength is in AI-powered data orchestration and governance.
Income Statement Comparison
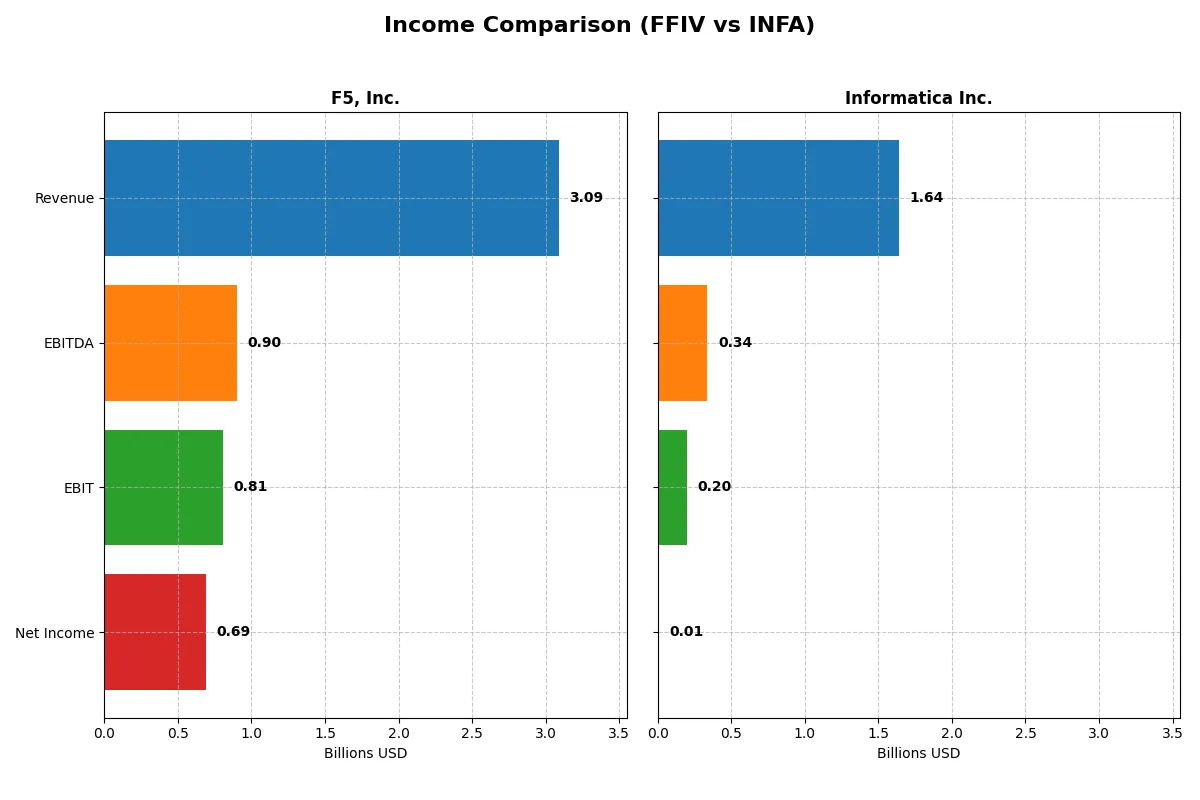
This data dissects the core profitability and scalability of both corporate engines to reveal who dominates the bottom line:
| Metric | F5, Inc. (FFIV) | Informatica Inc. (INFA) |
|---|---|---|
| Revenue | 3.09B | 1.64B |
| Cost of Revenue | 564M | 326M |
| Operating Expenses | 1.76B | 1.19B |
| Gross Profit | 2.52B | 1.31B |
| EBITDA | 901M | 339M |
| EBIT | 808M | 199M |
| Interest Expense | 0 | 146M |
| Net Income | 692M | 10M |
| EPS | 11.95 | 0.03 |
| Fiscal Year | 2025 | 2024 |
Income Statement Analysis: The Bottom-Line Duel
This income statement comparison reveals which company operates with superior efficiency and margin discipline in their respective markets.
F5, Inc. Analysis
F5, Inc. shows a consistent revenue rise from 2.6B in 2021 to 3.1B in 2025, with net income surging from 331M to 692M. The company maintains strong gross margins above 81% and net margins of 22%, reflecting excellent cost control. In 2025, F5’s earnings momentum accelerates, with net income growing 22% year-over-year, signaling robust operational efficiency.
Informatica Inc. Analysis
Informatica’s revenue grows steadily from 1.3B in 2020 to 1.64B in 2024, but net income remains near break-even, only reaching 10M in 2024 after losses in prior years. Gross margins hold at a healthy 80%, yet net margins linger around 0.6%, weighed down by significant interest expenses. The 2024 year shows improving EBIT and net margin growth, but profitability remains fragile.
Margin Strength vs. Profitability Scale
F5, Inc. clearly outperforms with higher absolute profits and superior margin expansion. Its 22% net margin dwarfs Informatica’s near breakeven results, underlining stronger operational leverage and capital allocation. For investors prioritizing consistent profitability and margin resilience, F5 presents a more compelling fundamental profile.
Financial Ratios Comparison
These vital ratios act as a diagnostic tool to expose the underlying fiscal health, valuation premiums, and capital efficiency of the companies compared below:
| Ratios | F5, Inc. (FFIV) | Informatica Inc. (INFA) |
|---|---|---|
| ROE | 19.3% | 0.4% |
| ROIC | 14.0% | 0.6% |
| P/E | 26.9 | 787.9 |
| P/B | 5.19 | 3.39 |
| Current Ratio | 1.56 | 1.82 |
| Quick Ratio | 1.51 | 1.82 |
| D/E | 0.06 | 0.81 |
| Debt-to-Assets | 3.7% | 35.2% |
| Interest Coverage | 0 | 0.87 |
| Asset Turnover | 0.49 | 0.31 |
| Fixed Asset Turnover | 9.02 | 8.75 |
| Payout Ratio | 0 | 0.12% |
| Dividend Yield | 0 | 0.00015% |
| Fiscal Year | 2025 | 2024 |
Efficiency & Valuation Duel: The Vital Signs
Financial ratios act as a company’s DNA, uncovering hidden risks and operational strengths invisible in headline figures alone.
F5, Inc.
F5 shows robust profitability with a 19.3% ROE and a strong 22.4% net margin, signaling operational efficiency. The stock trades at a stretched 26.9 P/E and 5.2 P/B, indicating premium valuation. It pays no dividend, instead channeling cash into sustained R&D investment, supporting future growth.
Informatica Inc.
No recent ratio data is available for Informatica, limiting clear assessment. Without these metrics, evaluating profitability, valuation, or shareholder returns remains incomplete. The absence of updated financial ratios restricts the ability to benchmark its operational or market performance.
Premium Valuation vs. Data Gap
F5 delivers a favorable operational profile with solid returns and manageable risks despite a high valuation. Informatica’s lack of current ratio data complicates risk-reward analysis. Investors seeking transparency and proven efficiency may lean toward F5, while those comfortable with uncertainty face a more speculative profile.
Which one offers the Superior Shareholder Reward?
F5, Inc. (FFIV) offers a superior shareholder reward compared to Informatica Inc. (INFA). FFIV pays no dividends but aggressively repurchases shares, leveraging strong free cash flow (15.7/share in 2025) and maintaining a zero dividend payout ratio. The buyback intensity supports capital return and sustainable value creation. In contrast, INFA pays a negligible dividend yield (~0.00015%) with a tiny payout ratio, signaling minimal cash returned to shareholders. Its free cash flow per share is modest (1.35/share in 2024), and high leverage (debt/equity ~0.81) raises sustainability concerns. FFIV’s robust cash flow, low debt (debt/assets ~3.6%), and active buyback program create a more attractive total return profile for 2026 investors.
Bankruptcy Risk: Solvency Showdown
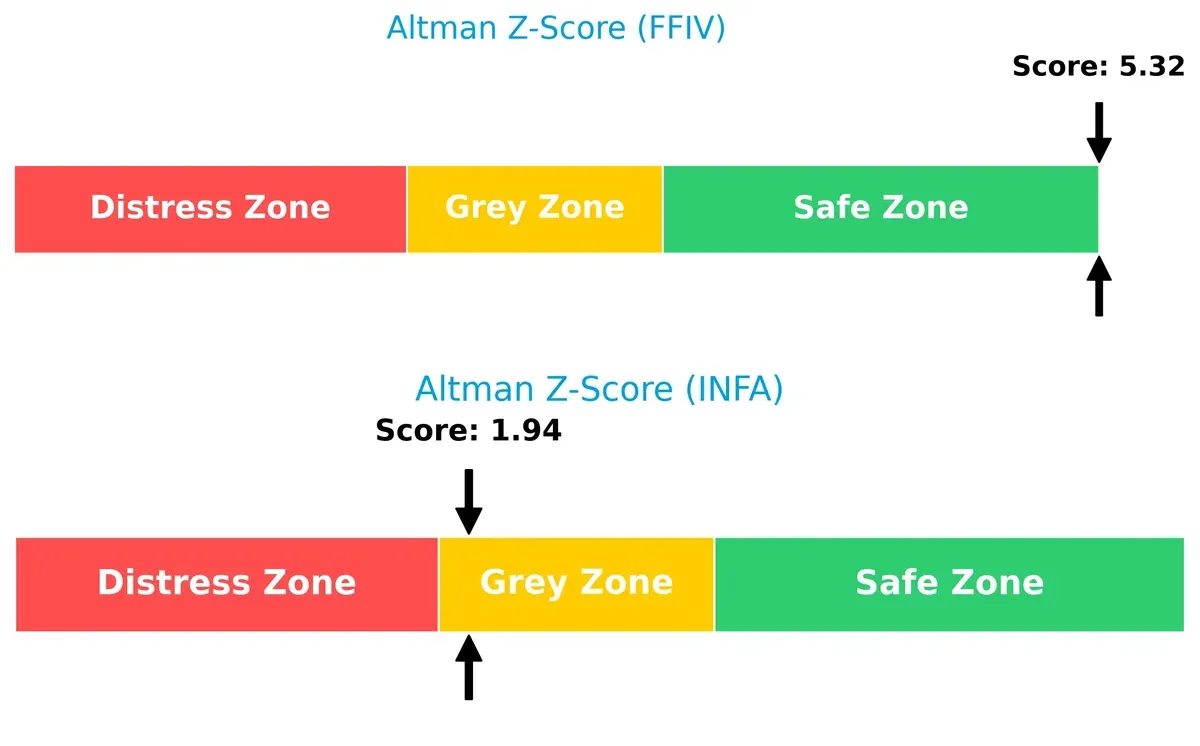
I see a clear solvency gap between F5, Inc. and Informatica Inc. F5’s Altman Z-Score of 5.3 places it firmly in the safe zone, signaling strong long-term survival potential. Informatica’s 1.9 score, however, sits in the grey zone, indicating moderate bankruptcy risk in this market cycle:
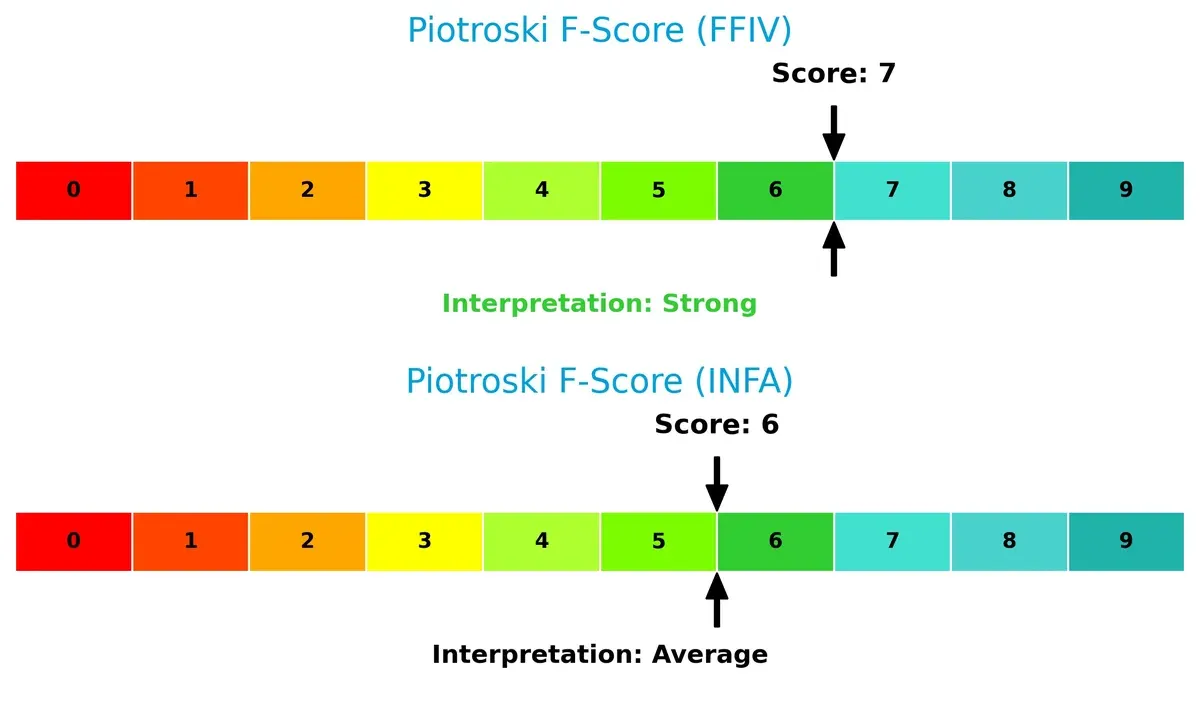
Financial Health: Quality of Operations
F5, Inc. also outperforms in operational quality with a Piotroski F-Score of 7, suggesting strong internal financial metrics and efficient management. Informatica’s score of 6 is decent but flags some weaknesses relative to F5, hinting at less robust financial health:
How are the two companies positioned?
This section dissects the operational DNA of F5 and Informatica by comparing their revenue distribution and internal strengths and weaknesses. The goal is to confront their economic moats and reveal which business model offers the most resilient, sustainable competitive advantage today.
Revenue Segmentation: The Strategic Mix
This visual comparison dissects how F5, Inc. and Informatica Inc. diversify their revenue streams and where their primary sector bets lie:
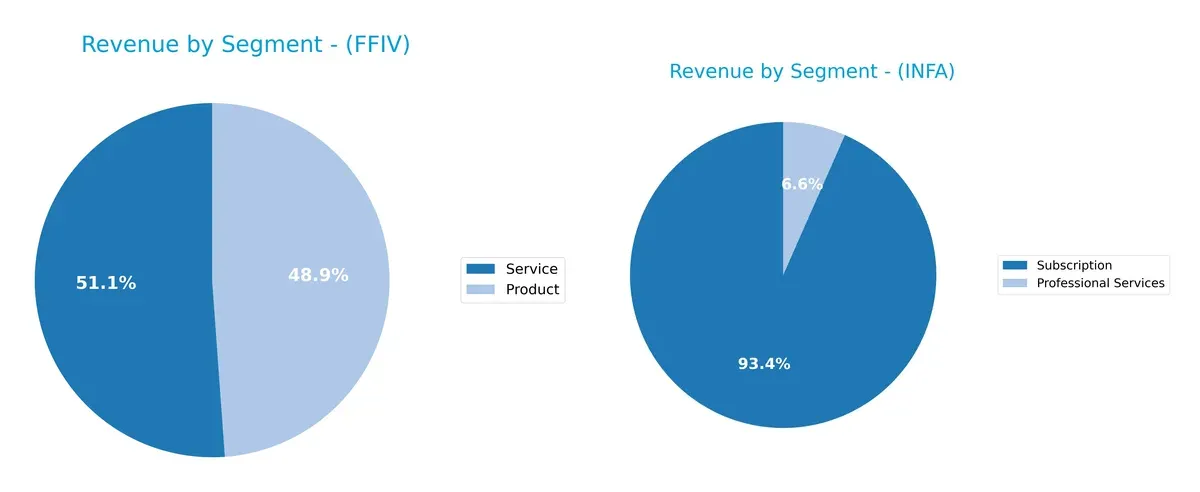
F5, Inc. pivots evenly between Product ($1.5B) and Service ($1.58B), showing a balanced dual-revenue model. Informatica leans heavily on Subscription ($1.1B) versus smaller Professional Services ($78M), signaling strong recurring revenue but higher concentration risk. F5’s mix suggests infrastructure dominance with ecosystem lock-in, while Informatica’s focus on subscription reflects a SaaS-driven growth strategy vulnerable to churn fluctuations.
Strengths and Weaknesses Comparison
This table compares the Strengths and Weaknesses of F5, Inc. and Informatica Inc.:
F5, Inc. Strengths
- High net margin of 22.42%
- Strong ROE at 19.28%
- Favorable ROIC of 13.99%
- Conservative leverage with 3.65% debt to assets
- Solid current and quick ratios above 1.5
- Diverse revenue from products and services
- Broad global presence across Americas, EMEA, Asia Pacific
Informatica Inc. Strengths
- Significant subscription revenue exceeding 1B USD
- Growing professional services segment
- Geographic diversification including North America, EMEA, Asia Pacific, Latin America
F5, Inc. Weaknesses
- Unfavorable valuation multiples: PE 26.91 and PB 5.19
- Zero dividend yield
- Low asset turnover at 0.49
- Lack of data on market share or innovation metrics
Informatica Inc. Weaknesses
- Absence of detailed financial ratio data limits assessment
- Reliance on subscription and license revenues may affect diversification visibility
F5, Inc. demonstrates strong profitability and financial stability with a well-diversified product and geographic mix. Informatica shows strength in subscription revenues and geographic reach but lacks comprehensive financial ratio data, restricting full analysis of operational efficiency and valuation.
The Moat Duel: Analyzing Competitive Defensibility
A structural moat is the only thing protecting long-term profits from the erosion of competition. Let’s break down the core competitive advantages:
F5, Inc.: Hardware-Integrated Application Security Moat
F5’s moat stems from its unique hardware-software architecture, creating high switching costs and stable 26% EBIT margins. Its multi-cloud expansion deepens this advantage in 2026.
Informatica Inc.: Data Integration and AI-Driven Platform Moat
Informatica’s moat relies on AI-powered data management and integration, contrasting F5’s hardware focus. Its recent strong EBIT growth signals expanding market relevance and platform scalability.
Moat Battle: Hardware Integration vs. AI-Driven Data Platforms
F5 commands a wider moat with a 5.7% ROIC premium over WACC and durable profitability. Informatica’s moat is promising but less proven. F5 is better equipped to defend market share long-term.
Which stock offers better returns?
The past year shows contrasting price movements: F5, Inc. surged with accelerating momentum, while Informatica Inc. declined sharply before flattening recently.
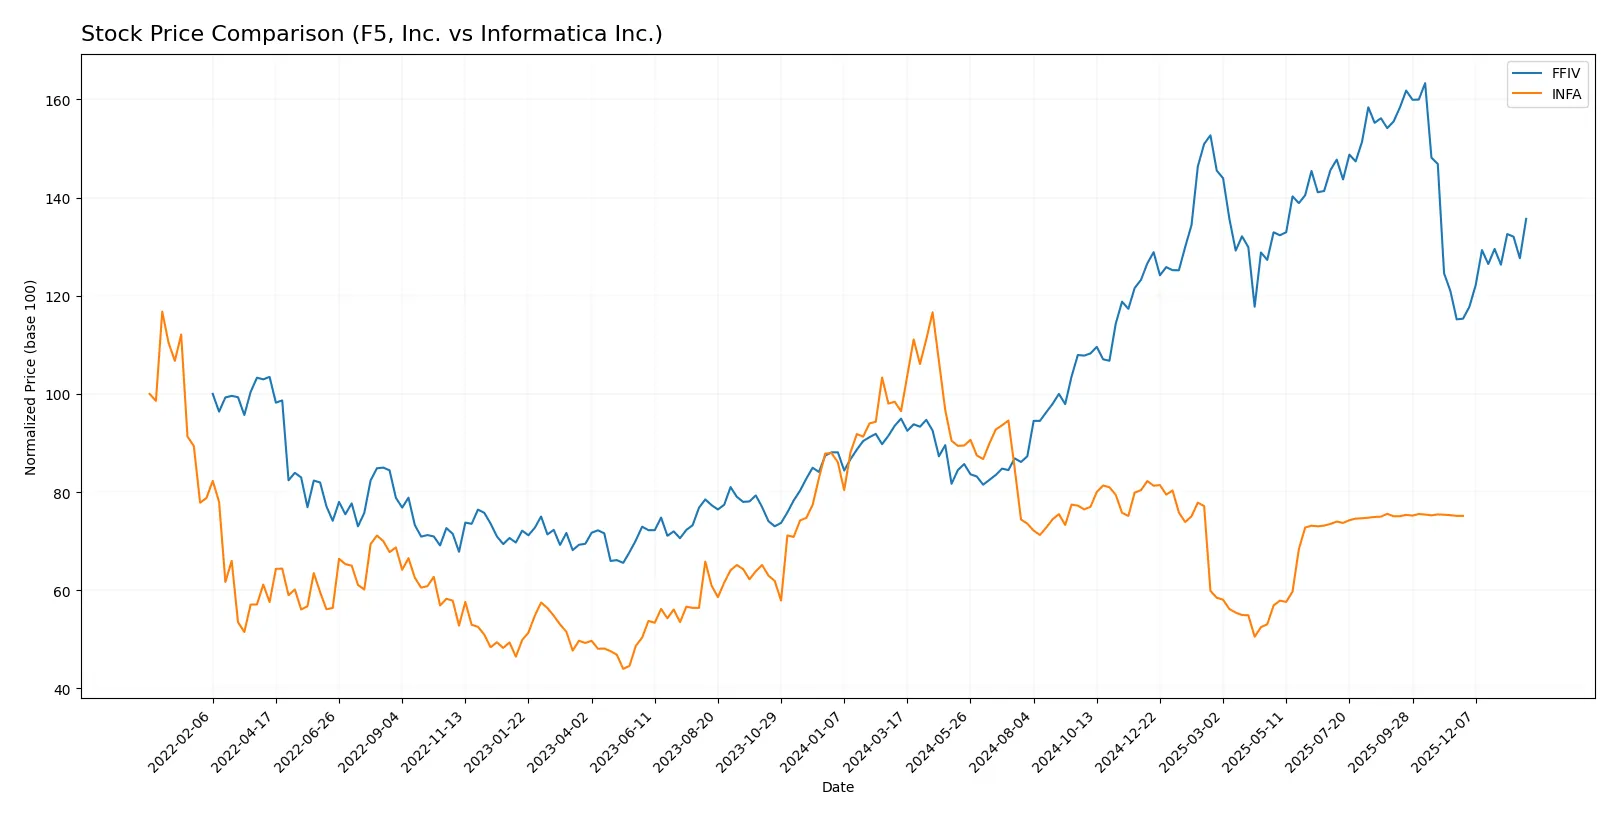
Trend Comparison
F5, Inc. displays a strong bullish trend with a 42.85% price increase over 12 months, marked by accelerating gains and heightened volatility. Its high of 331.75 and low of 165.57 reflect wide price swings.
Informatica Inc.’s stock fell 12.68% over the same period, signaling a bearish trend despite recent stabilization. The trend shows accelerating decline but with low volatility and a narrow range between 38.48 and 16.67.
F5 outperformed Informatica decisively, delivering the highest market returns with sustained upward momentum and buyer dominance throughout the year.
Target Prices
Analysts present a clear consensus on target prices for F5, Inc. and Informatica Inc.
| Company | Target Low | Target High | Consensus |
|---|---|---|---|
| F5, Inc. | 295 | 352 | 330.67 |
| Informatica Inc. | 27 | 27 | 27 |
The consensus target for F5, Inc. sits about 20% above its current price of $275.61, signaling solid upside potential. Informatica’s consensus target equals its high and median at $27, modestly above its current $24.79, indicating limited near-term gains.

Don’t Let Luck Decide Your Entry Point
Optimize your entry points with our advanced ProRealTime indicators. You’ll get efficient buy signals with precise price targets for maximum performance. Start outperforming now!
How do institutions grade them?
This section compares the recent institutional grades assigned to F5, Inc. and Informatica Inc.:
F5, Inc. Grades
Here is a summary of F5, Inc.’s latest analyst grades from notable firms:
| Grading Company | Action | New Grade | Date |
|---|---|---|---|
| Needham | maintain | Hold | 2026-01-28 |
| Piper Sandler | maintain | Overweight | 2026-01-28 |
| Goldman Sachs | maintain | Neutral | 2026-01-28 |
| Barclays | maintain | Equal Weight | 2026-01-28 |
| RBC Capital | maintain | Outperform | 2026-01-28 |
| JP Morgan | upgrade | Overweight | 2026-01-15 |
| Piper Sandler | upgrade | Overweight | 2026-01-05 |
| RBC Capital | upgrade | Outperform | 2026-01-05 |
| Morgan Stanley | maintain | Equal Weight | 2025-12-17 |
| Morgan Stanley | maintain | Equal Weight | 2025-10-28 |
Informatica Inc. Grades
Below are the most recent analyst grades for Informatica Inc. from established institutions:
| Grading Company | Action | New Grade | Date |
|---|---|---|---|
| Guggenheim | downgrade | Neutral | 2025-08-07 |
| UBS | maintain | Neutral | 2025-08-07 |
| Baird | maintain | Neutral | 2025-05-28 |
| JP Morgan | downgrade | Neutral | 2025-05-28 |
| RBC Capital | maintain | Sector Perform | 2025-05-28 |
| Wolfe Research | downgrade | Peer Perform | 2025-05-28 |
| Wells Fargo | maintain | Equal Weight | 2025-05-28 |
| Truist Securities | downgrade | Hold | 2025-05-28 |
| RBC Capital | maintain | Sector Perform | 2025-05-27 |
| UBS | maintain | Neutral | 2025-05-16 |
Which company has the best grades?
F5, Inc. holds generally stronger grades with multiple upgrades and Outperform ratings. Informatica Inc.’s grades show several downgrades and predominantly Neutral or Hold ratings. This difference could influence investor confidence and perceived growth prospects.
Risks specific to each company
In the challenging 2026 market environment, these categories identify critical pressure points and systemic threats facing both firms:
1. Market & Competition
F5, Inc.
- Faces intense competition in multi-cloud security solutions; established brand supports resilience.
Informatica Inc.
- Competes in AI-powered data management; newer IPO status may limit market presence and scale.
2. Capital Structure & Debt
F5, Inc.
- Very low debt-to-equity (0.06) and strong interest coverage indicate solid financial stability.
Informatica Inc.
- Lacks disclosed debt metrics; Altman Z-score in grey zone implies moderate financial risk.
3. Stock Volatility
F5, Inc.
- Beta near 1 (0.975) shows average market volatility exposure.
Informatica Inc.
- Higher beta (1.135) suggests greater sensitivity to market swings and higher risk.
4. Regulatory & Legal
F5, Inc.
- Operates globally with exposure to data security regulations; mature compliance frameworks in place.
Informatica Inc.
- Faces complex data privacy laws due to AI focus; younger company may have evolving regulatory challenges.
5. Supply Chain & Operations
F5, Inc.
- Dependence on hardware/software integration requires robust supply chain management.
Informatica Inc.
- Primarily software-based platform reduces physical supply risks but depends on cloud infrastructure stability.
6. ESG & Climate Transition
F5, Inc.
- Larger scale likely entails more formal ESG reporting and initiatives; potential transition risks.
Informatica Inc.
- Smaller scale and newer public status may limit ESG transparency and resource allocation.
7. Geopolitical Exposure
F5, Inc.
- Global operations expose it to geopolitical tensions, especially in cloud partnerships across regions.
Informatica Inc.
- US-centric focus with cloud reliance could face risks from trade policies and international data laws.
Which company shows a better risk-adjusted profile?
F5, Inc. exhibits a stronger risk-adjusted profile due to its solid capital structure, safer Altman Z-score (5.32), and moderate market volatility. Informatica’s higher financial uncertainty and beta (1.135) raise caution. The critical risk for F5 lies in intensifying competition in cloud security, while Informatica’s main threat is financial stability amidst regulatory and market pressures. F5’s robust debt metrics and safe-zone bankruptcy score justify my confidence despite a premium valuation.
Final Verdict: Which stock to choose?
F5, Inc. (FFIV) demonstrates a clear superpower in operational efficiency and value creation, consistently delivering high returns on invested capital well above its cost of capital. Its disciplined capital allocation and robust income growth position it as a strong cash machine. The main point of vigilance is its premium valuation multiples, which could temper upside in volatile markets. FFIV suits an Aggressive Growth portfolio focused on durable competitive advantages.
Informatica Inc. (INFA) boasts a strategic moat rooted in its recurring revenue streams and data management expertise, offering a safety cushion compared to FFIV’s more aggressive profile. However, its financial health shows some fragility, with a grey-zone bankruptcy risk score and modest profitability. INFA fits a GARP (Growth at a Reasonable Price) portfolio that balances growth potential with moderate risk tolerance.
If you prioritize durable value creation and operational strength, FFIV is the compelling choice due to its accelerating earnings and strong moat. However, if you seek stability via recurring revenues and a less stretched valuation, INFA offers better downside protection despite its weaker profitability. Each company aligns with distinct investor profiles, underscoring the importance of strategy in portfolio construction.
Disclaimer: Investment carries a risk of loss of initial capital. The past performance is not a reliable indicator of future results. Be sure to understand risks before making an investment decision.
Go Further
I encourage you to read the complete analyses of F5, Inc. and Informatica Inc. to enhance your investment decisions: