Home > Comparison > Technology > GDDY vs FFIV
The strategic rivalry between GoDaddy Inc. and F5, Inc. shapes the competitive landscape of the technology sector’s software infrastructure industry. GoDaddy operates as a customer-focused cloud services provider, emphasizing scalable web presence and e-commerce solutions. In contrast, F5 delivers specialized multi-cloud application security and delivery systems tailored for large enterprises. This analysis weighs their divergent operational models to identify which offers a superior risk-adjusted return for a diversified portfolio.

Table of contents
Companies Overview
GoDaddy Inc. and F5, Inc. stand as pivotal players in the software infrastructure market, each commanding significant influence.
GoDaddy Inc.: Digital Identity and Small Business Empowerment
GoDaddy Inc. is a leading provider in cloud-based technology products, primarily generating revenue through domain name registrations and diverse hosting services. Its strategic focus in 2026 centers on expanding digital presence tools for small businesses, including marketing, e-commerce, and security products that enhance online engagement and customer acquisition.
F5, Inc.: Multi-Cloud Application Security Leader
F5, Inc. specializes in multi-cloud application security and delivery solutions that ensure network performance and application availability. In 2026, the company emphasizes advancing its portfolio of security appliances, software modules, and cloud partnerships, targeting large enterprises and public sector clients to secure and optimize complex multi-cloud environments.
Strategic Collision: Similarities & Divergences
Both companies operate in software infrastructure but diverge sharply in focus. GoDaddy offers a broad digital platform tailored to small businesses and individuals, while F5 provides specialized, high-performance security for large enterprises across multi-cloud architectures. Their competition centers on capturing evolving cloud infrastructure demand but appeal to distinctly different customer bases, reflecting contrasting investment risk and growth profiles.
Income Statement Comparison
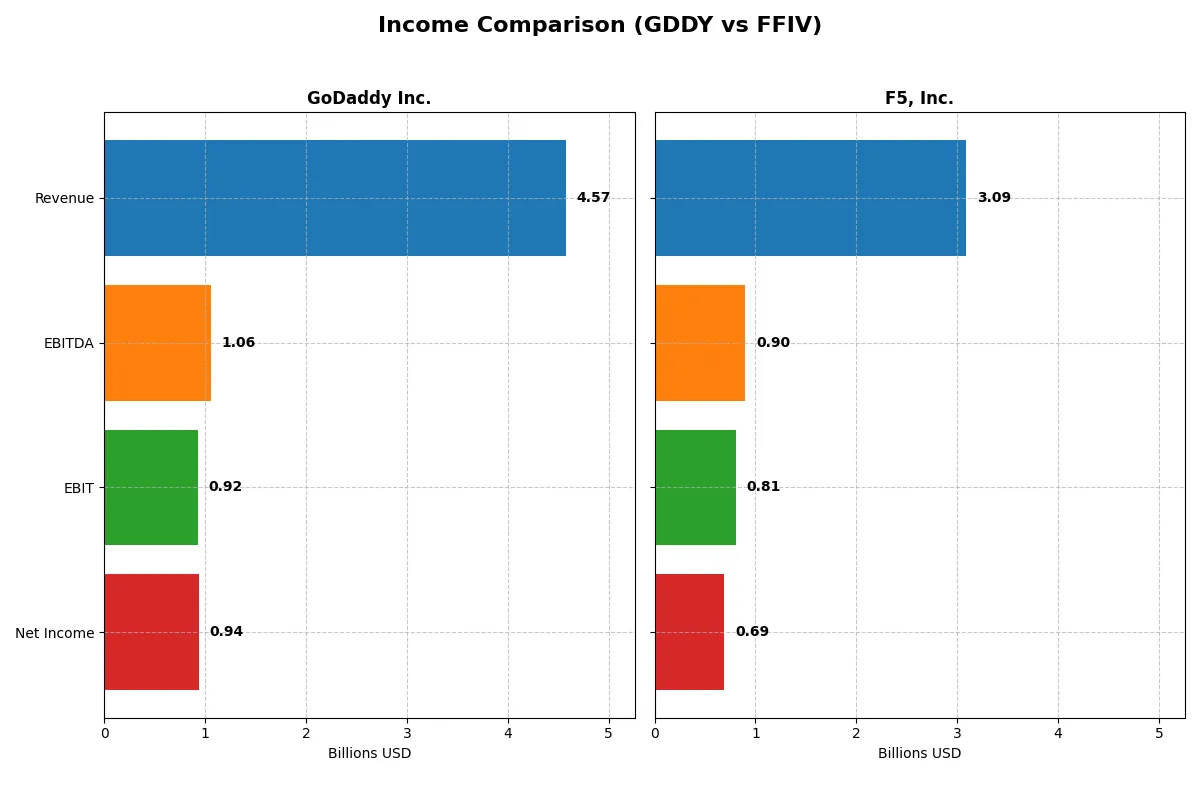
This data dissects the core profitability and scalability of both corporate engines to reveal who dominates the bottom line:
| Metric | GoDaddy Inc. (GDDY) | F5, Inc. (FFIV) |
|---|---|---|
| Revenue | 4.57B | 3.09B |
| Cost of Revenue | 1.65B | 564M |
| Operating Expenses | 2.03B | 1.76B |
| Gross Profit | 2.92B | 2.52B |
| EBITDA | 1.06B | 901M |
| EBIT | 924M | 808M |
| Interest Expense | 158M | 0 |
| Net Income | 937M | 692M |
| EPS | 6.63 | 11.95 |
| Fiscal Year | 2024 | 2025 |
Income Statement Analysis: The Bottom-Line Duel
This income statement comparison exposes which company runs a more efficient and profitable operating engine over recent years.
GoDaddy Inc. Analysis
GoDaddy’s revenue climbs steadily from $3.3B in 2020 to $4.6B in 2024, showcasing a 38% growth over five years. Gross margin remains strong near 64%, while net margin holds around 20%, highlighting good cost control. The latest year shows a solid EBIT surge of 58%, signaling operational momentum despite a net income drop.
F5, Inc. Analysis
F5 grows revenue by nearly 19% from 2021 to 2025, reaching $3.1B. It boasts an impressive 82% gross margin and a 22% net margin, reflecting superior pricing power and operational leverage. The latest fiscal year delivers double-digit growth in revenue, EBIT, and EPS, though operating expenses slightly outpace revenue growth.
Margin Power vs. Revenue Scale
F5 demonstrates higher margins and consistent profitability growth, outperforming GoDaddy on EBIT and net margin expansion. GoDaddy, however, delivers stronger revenue and net income growth over the longer term. For investors prioritizing margin dominance and steady earnings expansion, F5 presents a more attractive profile, while GoDaddy appeals to those seeking robust top-line scale and growth momentum.
Financial Ratios Comparison
These vital ratios act as a diagnostic tool to expose the underlying fiscal health, valuation premiums, and capital efficiency of the companies compared:
| Ratios | GoDaddy Inc. (GDDY) | F5, Inc. (FFIV) |
|---|---|---|
| ROE | 1.35 | 0.19 |
| ROIC | 0.16 | 0.14 |
| P/E | 29.8 | 26.9 |
| P/B | 40.3 | 5.19 |
| Current Ratio | 0.72 | 1.56 |
| Quick Ratio | 0.72 | 1.51 |
| D/E | 5.63 | 0.06 |
| Debt-to-Assets | 0.47 | 0.04 |
| Interest Coverage | 5.64 | 0 |
| Asset Turnover | 0.56 | 0.49 |
| Fixed Asset Turnover | 22.22 | 9.02 |
| Payout ratio | 0 | 0 |
| Dividend yield | 0 | 0 |
| Fiscal Year | 2024 | 2025 |
Efficiency & Valuation Duel: The Vital Signs
Financial ratios act as a company’s DNA, unveiling hidden operational strengths and risks that drive investment decisions.
GoDaddy Inc.
GoDaddy posts a stellar ROE of 135%, signaling exceptional profitability, supported by a strong 20.5% net margin. Its P/E ratio of 29.8 suggests the stock is somewhat expensive relative to earnings. The absence of dividends points to a reinvestment focus, notably on R&D, which fuels growth but raises short-term risk.
F5, Inc.
F5 delivers solid profitability with a 19.3% ROE and a 22.4% net margin, reflecting operational efficiency. Its P/E of 26.9 is more moderate but still on the higher side. The company maintains a healthy current ratio of 1.56 and reinvests earnings into R&D, favoring steady growth over shareholder payouts.
Valuation Stretch vs. Operational Strength
GoDaddy’s outsized ROE contrasts with a stretched valuation and weak liquidity, posing notable risks. F5 balances strong profitability with healthier liquidity and a more reasonable valuation. Investors seeking operational safety may prefer F5, while those chasing high-growth potential might consider GoDaddy’s aggressive profile.
Which one offers the Superior Shareholder Reward?
GoDaddy Inc. (GDDY) and F5, Inc. (FFIV) both skip dividends, favoring reinvestment and buybacks. I observe GoDaddy’s free cash flow per share at $8.9 with no dividend payout, but heavy debt leverage (debt/equity 5.6) raises sustainability concerns. Conversely, F5 boasts a stronger balance sheet with debt/equity near 0.06 and $15.7 free cash flow per share. Both execute buybacks, yet F5’s superior margins (26% EBIT vs. GoDaddy’s 20%) and healthier leverage underpin a more sustainable distribution model. I conclude F5 offers a more attractive total return profile in 2026 due to its robust capital allocation and lower financial risk.
Comparative Score Analysis: The Strategic Profile
The radar chart reveals the fundamental DNA and trade-offs of GoDaddy Inc. and F5, Inc. across key financial metrics:
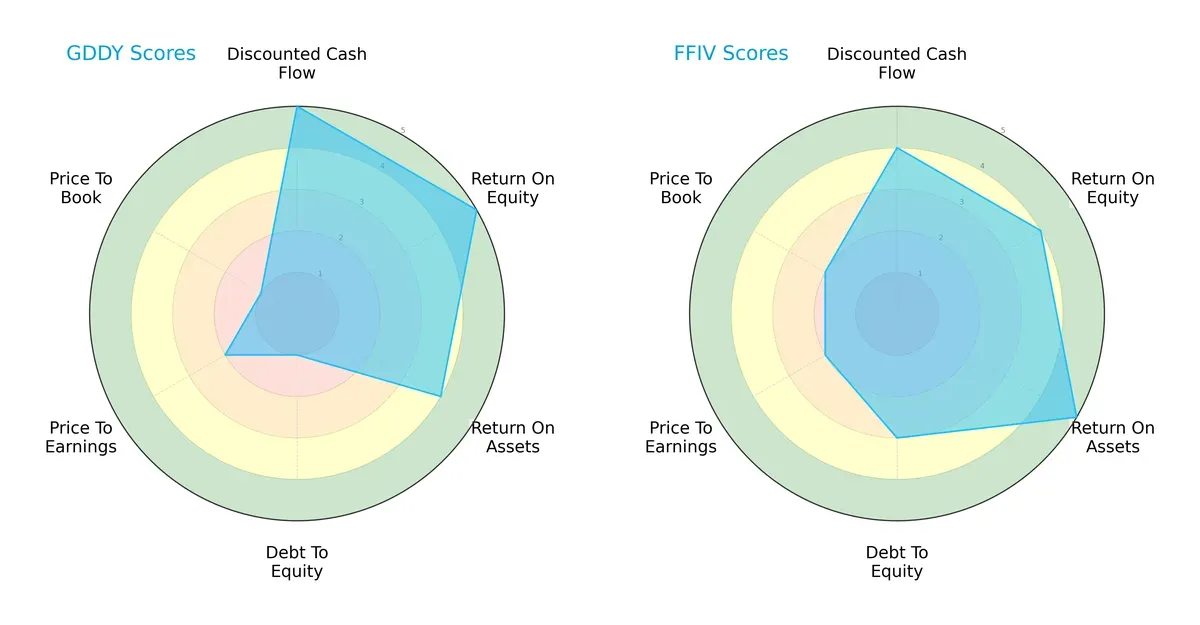
GoDaddy excels in DCF and ROE, signaling strong cash flow and equity returns but suffers from a weak debt profile and valuation metrics. F5 shows a more balanced scorecard with solid ROA and moderate leverage, indicating prudent capital management. Overall, F5 presents a steadier financial profile, while GoDaddy leans on operational efficiency but carries notable financial risk.
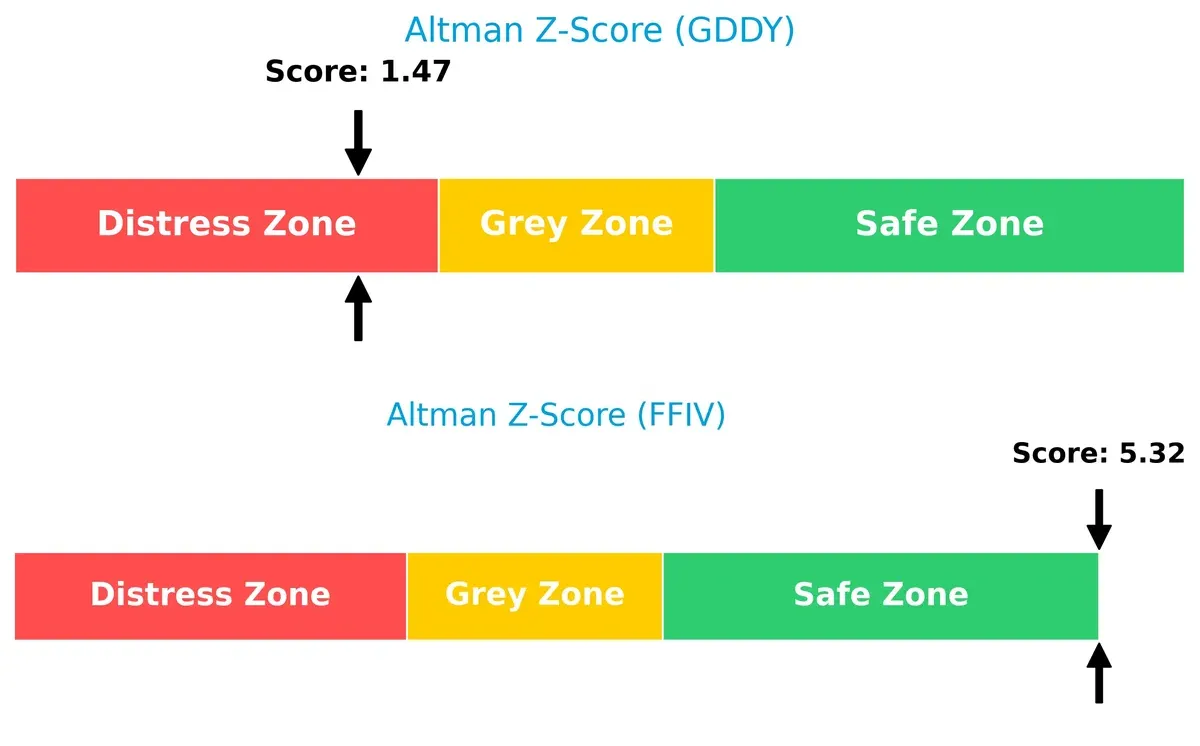
Bankruptcy Risk: Solvency Showdown
GoDaddy’s Altman Z-Score of 1.47 places it in the distress zone, while F5’s 5.32 sits comfortably in the safe zone. This wide gap signals a stark contrast in long-term survival prospects under current market conditions:
Financial Health: Quality of Operations
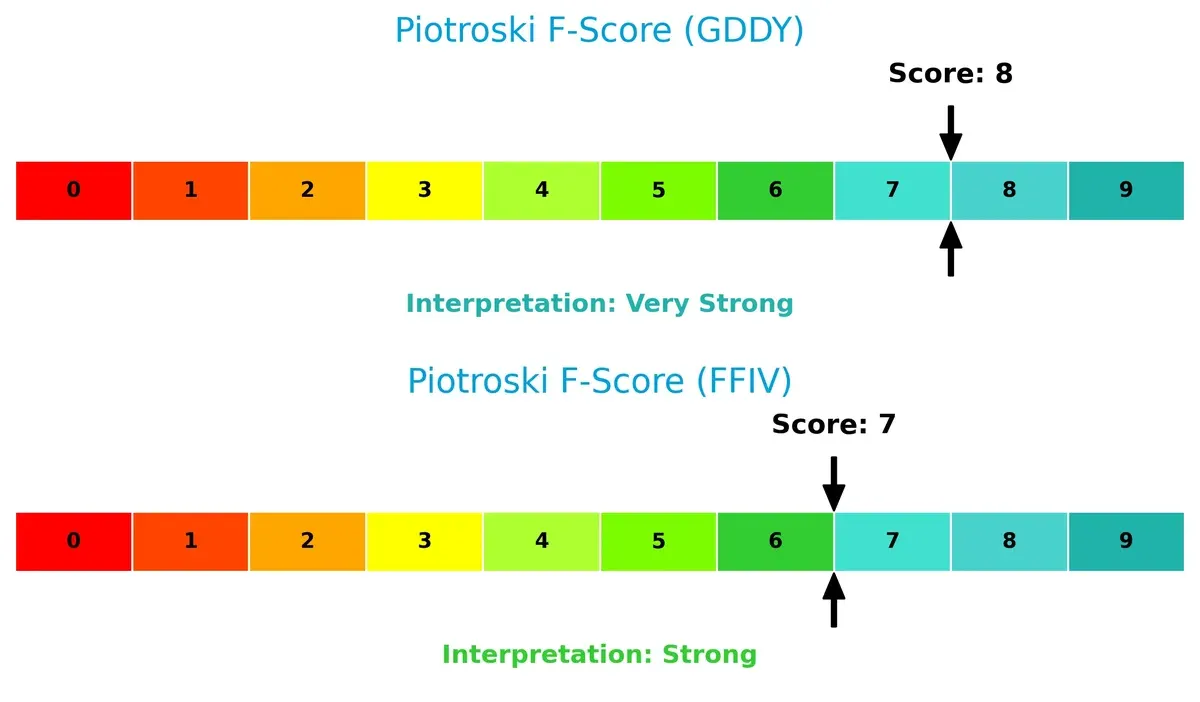
GoDaddy’s Piotroski F-Score of 8 reflects very strong financial health, outperforming F5’s score of 7, which is strong but slightly less robust. GoDaddy demonstrates superior internal metrics despite its solvency risks:
How are the two companies positioned?
This section dissects the operational DNA of GoDaddy and F5 by comparing their revenue distribution and internal dynamics. The goal is to confront their economic moats and identify which model offers the most resilient competitive advantage.
Revenue Segmentation: The Strategic Mix
This visual comparison dissects how GoDaddy Inc. and F5, Inc. diversify their income streams and where their primary sector bets lie:
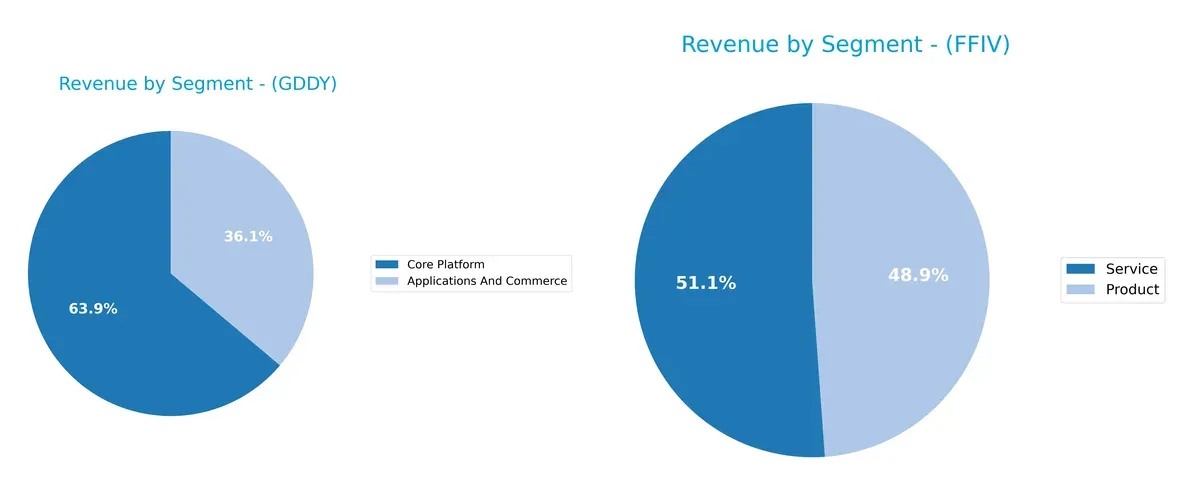
GoDaddy leans heavily on its Core Platform, generating $2.92B in 2024, with Applications and Commerce at $1.65B, showing moderate diversification. F5, by contrast, balances almost evenly between Product ($1.27B) and Service ($1.54B) revenues in 2024, demonstrating a more diversified mix. GoDaddy’s reliance on its platform anchors its ecosystem but raises concentration risk. F5’s split revenue model pivots on infrastructure and service integration, reducing dependency on a single segment.
Strengths and Weaknesses Comparison
This table compares the Strengths and Weaknesses of GoDaddy Inc. and F5, Inc.:
GoDaddy Inc. Strengths
- High net margin at 20.49%
- Exceptional ROE of 135.37%
- ROIC above WACC at 16.02%
- Strong fixed asset turnover at 22.22
- Growing US and Non-US revenues with diversification across platform and commerce segments
F5, Inc. Strengths
- Higher net margin at 22.42%
- Strong ROE at 19.28%
- ROIC above WACC at 13.99%
- Favorable liquidity ratios with current ratio 1.56
- Low debt-to-assets at 3.65%
- Balanced global presence across Americas, EMEA, Asia Pacific
GoDaddy Inc. Weaknesses
- Overvalued multiples with PE 29.76 and PB 40.28
- Weak liquidity with current and quick ratios at 0.72
- High debt-to-equity at 5.63
- No dividend yield
- Moderate debt-to-assets at 47.29%
- Asset turnover neutral at 0.56
F5, Inc. Weaknesses
- Overvalued PE at 26.91 and PB at 5.19
- Asset turnover below GoDaddy at 0.49
- No dividend yield
- WACC higher at 8.31%
- Smaller ROE compared to GoDaddy
GoDaddy shows remarkable profitability and asset efficiency but suffers from liquidity and valuation concerns. F5 maintains stronger liquidity and lower leverage, with a more balanced global footprint, though its valuation and asset turnover metrics signal areas for caution. Both must navigate these strengths and weaknesses carefully to sustain competitive advantage.
The Moat Duel: Analyzing Competitive Defensibility
A structural moat is the only shield protecting long-term profits from relentless competition and market entry pressures:
GoDaddy Inc.: Switching Costs Anchor Its Digital Identity Platform
GoDaddy’s moat stems from strong switching costs embedded in its domain registration and hosting services. Its stable 20%+ EBIT margin reflects efficient capital use. New marketing tools and e-commerce expansions in 2026 could deepen this advantage but face risks from cloud giants.
F5, Inc.: Technological Leadership in Multi-Cloud Security
F5’s moat relies on proprietary application delivery and security tech, contrasting with GoDaddy’s customer lock-in. It commands an 81.7% gross margin and growing ROIC, signaling robust innovation leverage. Expanding multi-cloud partnerships in 2026 may widen its competitive edge amid rising cybersecurity demand.
Verdict: Switching Costs vs. Technological Innovation
GoDaddy’s switching costs create a wider moat through entrenched customer relationships. F5’s deeper technological moat drives higher margins but faces faster innovation cycles. Overall, GoDaddy appears better positioned to defend its market share sustainably.
Which stock offers better returns?
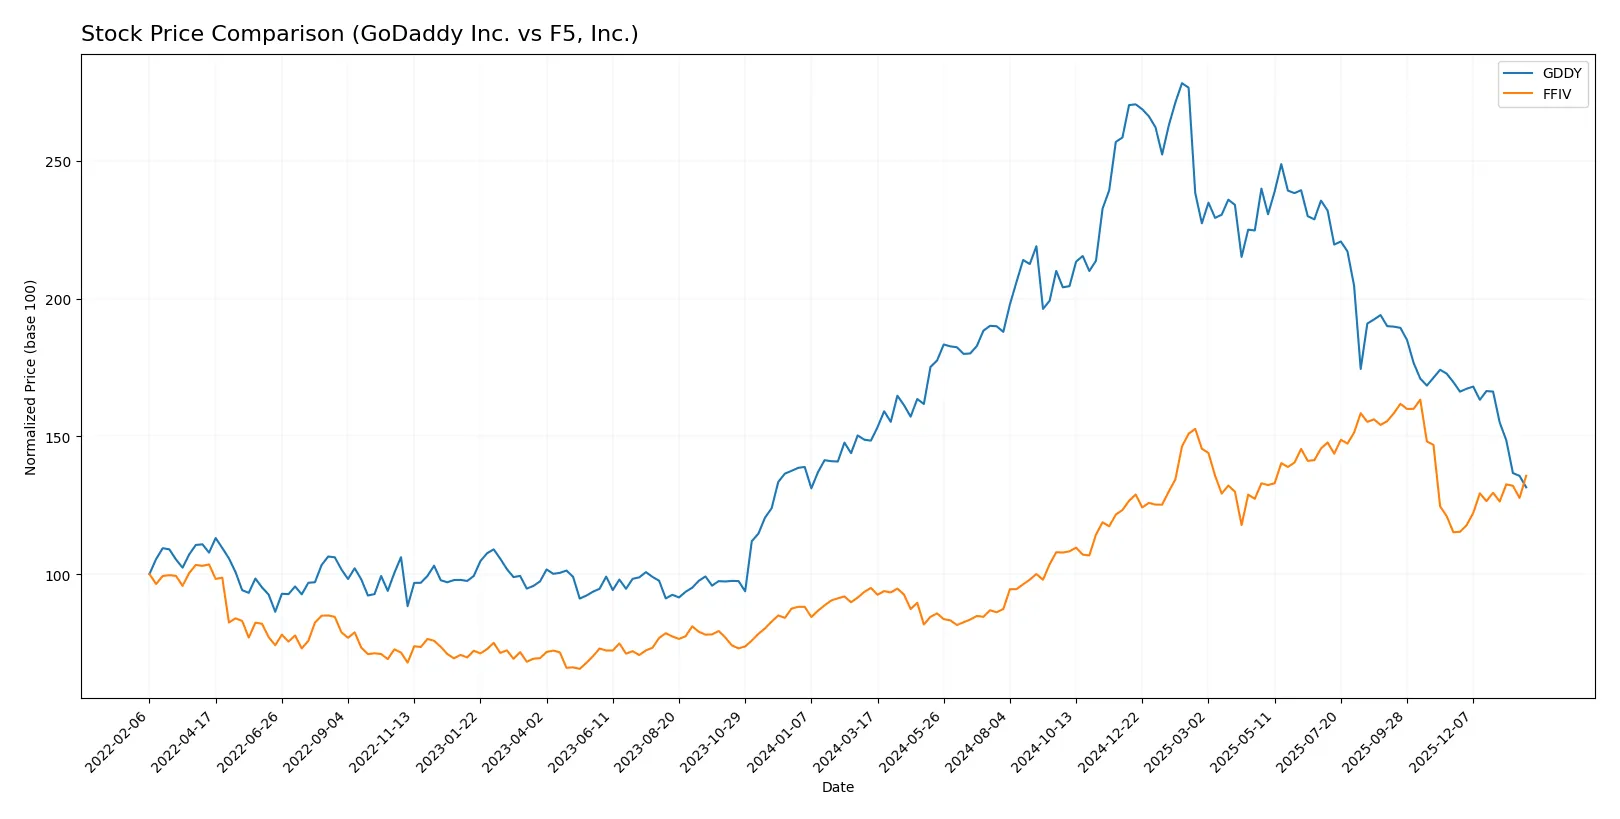
Over the past 12 months, GoDaddy Inc. showed significant price decline while F5, Inc. exhibited strong upward momentum with accelerating gains and higher volatility.
Trend Comparison
GoDaddy Inc. endured an 11.41% price decline over the past year, marking a bearish trend with decelerating losses and a high volatility of 27.77%. It peaked at 212.65 and bottomed near 100.52.
F5, Inc. gained 42.85% during the same period, reflecting a bullish trend with accelerating momentum and elevated volatility at 48.51%. The stock ranged between 165.57 and 331.75.
Comparing both, F5, Inc. delivered substantially higher returns with a bullish, accelerating trend, outperforming GoDaddy’s bearish, decelerating price movement.
Target Prices
Analysts present a bullish consensus for both GoDaddy Inc. and F5, Inc., signaling upside potential from current prices.
| Company | Target Low | Target High | Consensus |
|---|---|---|---|
| GoDaddy Inc. | 70 | 182 | 143.33 |
| F5, Inc. | 295 | 352 | 330.67 |
The consensus target for GoDaddy at 143.33 implies a 42% upside from its current 100.52 price. F5’s 330.67 target suggests a significant 20% gain from its 275.61 trading level.

Don’t Let Luck Decide Your Entry Point
Optimize your entry points with our advanced ProRealTime indicators. You’ll get efficient buy signals with precise price targets for maximum performance. Start outperforming now!
How do institutions grade them?
GoDaddy Inc. Grades
The following table summarizes recent institutional grades for GoDaddy Inc.:
| Grading Company | Action | New Grade | Date |
|---|---|---|---|
| Morgan Stanley | Maintain | Equal Weight | 2026-01-15 |
| Cantor Fitzgerald | Maintain | Neutral | 2026-01-08 |
| Jefferies | Maintain | Hold | 2026-01-05 |
| Evercore ISI Group | Maintain | In Line | 2025-10-31 |
| Benchmark | Maintain | Buy | 2025-10-31 |
| JP Morgan | Maintain | Overweight | 2025-10-31 |
| B. Riley Securities | Maintain | Buy | 2025-10-31 |
| UBS | Maintain | Neutral | 2025-10-31 |
| Citigroup | Maintain | Buy | 2025-10-31 |
| Wells Fargo | Maintain | Equal Weight | 2025-10-06 |
F5, Inc. Grades
The following table summarizes recent institutional grades for F5, Inc.:
| Grading Company | Action | New Grade | Date |
|---|---|---|---|
| Needham | Maintain | Hold | 2026-01-28 |
| Piper Sandler | Maintain | Overweight | 2026-01-28 |
| Goldman Sachs | Maintain | Neutral | 2026-01-28 |
| Barclays | Maintain | Equal Weight | 2026-01-28 |
| RBC Capital | Maintain | Outperform | 2026-01-28 |
| JP Morgan | Upgrade | Overweight | 2026-01-15 |
| Piper Sandler | Upgrade | Overweight | 2026-01-05 |
| RBC Capital | Upgrade | Outperform | 2026-01-05 |
| Morgan Stanley | Maintain | Equal Weight | 2025-12-17 |
| Morgan Stanley | Maintain | Equal Weight | 2025-10-28 |
Which company has the best grades?
F5, Inc. has received more upgrades and higher ratings such as Overweight and Outperform. GoDaddy’s ratings are more mixed, with several Buy and Overweight grades but also Neutral and Hold. Investors may interpret F5’s improving grades as stronger institutional confidence.
Risks specific to each company
The following categories identify critical pressure points and systemic threats facing GoDaddy Inc. and F5, Inc. in the 2026 market environment:
1. Market & Competition
GoDaddy Inc.
- Faces intense competition in cloud and domain services with pressure on pricing and customer retention.
F5, Inc.
- Competes in multi-cloud security and delivery with strong enterprise clients but risks from rapid tech shifts.
2. Capital Structure & Debt
GoDaddy Inc.
- High debt-to-equity ratio (5.63) signals financial risk and weaker balance sheet stability.
F5, Inc.
- Very low debt-to-equity (0.06) enhances financial flexibility and reduces default risk.
3. Stock Volatility
GoDaddy Inc.
- Slightly lower beta (0.948) implies marginally less sensitivity to market swings.
F5, Inc.
- Beta near 1 (0.975) shows typical market volatility exposure for the tech sector.
4. Regulatory & Legal
GoDaddy Inc.
- Subject to evolving internet and data privacy regulations impacting domain and hosting services.
F5, Inc.
- Faces compliance demands in cybersecurity and cloud sectors with potential legal exposure.
5. Supply Chain & Operations
GoDaddy Inc.
- Relies on global cloud infrastructure and third-party vendors, vulnerable to disruptions.
F5, Inc.
- Dependent on hardware-software integration and cloud partnerships, risking supply delays.
6. ESG & Climate Transition
GoDaddy Inc.
- ESG efforts less transparent; potential pressure from investors on sustainability practices.
F5, Inc.
- Increasingly prioritizes ESG initiatives aligned with large enterprise client expectations.
7. Geopolitical Exposure
GoDaddy Inc.
- International presence exposes it to trade tensions and data sovereignty risks.
F5, Inc.
- Global operations in sensitive sectors face geopolitical risks, especially in cloud and security.
Which company shows a better risk-adjusted profile?
GoDaddy’s most significant risk is its elevated financial leverage, reflected in debt-to-equity and liquidity weaknesses. F5’s main risk lies in technological disruption and geopolitical exposure despite a strong balance sheet. F5 exhibits a better risk-adjusted profile, supported by its safe-zone Altman Z-score (5.32) versus GoDaddy’s distress-zone score (1.47). This gap underscores F5’s superior financial stability and resilience in 2026 market conditions.
Final Verdict: Which stock to choose?
GoDaddy Inc. stands out as a value creator with a durable competitive advantage, driven by its strong ROIC growth and robust profitability. Its superpower lies in efficient capital allocation and high returns on equity. However, its weak liquidity ratios signal a point of vigilance. It fits an aggressive growth portfolio willing to navigate balance sheet risks.
F5, Inc. boasts a strategic moat rooted in consistent free cash flow generation and a conservative balance sheet with notably low leverage. Its cloud and network security dominance provide recurring revenue safety. Compared to GoDaddy, F5 offers better financial stability, suiting a GARP (Growth at a Reasonable Price) portfolio focused on steady income and controlled risk.
If you prioritize aggressive capital appreciation and can tolerate liquidity concerns, GoDaddy appears compelling due to its superior return on invested capital and growth trajectory. However, if you seek stability with solid cash flow and a lower-risk profile, F5 outshines by offering a more balanced financial position and a durable moat. Each presents a distinct analytical scenario aligned with different investor risk tolerances.
Disclaimer: Investment carries a risk of loss of initial capital. The past performance is not a reliable indicator of future results. Be sure to understand risks before making an investment decision.
Go Further
I encourage you to read the complete analyses of GoDaddy Inc. and F5, Inc. to enhance your investment decisions: