Home > Comparison > Technology > GEN vs FFIV
The strategic rivalry between Gen Digital Inc. and F5, Inc. shapes the software infrastructure landscape. Gen Digital focuses on consumer cyber safety with subscription services, while F5 delivers multi-cloud application security to enterprises. This head-to-head contrasts a consumer-centric growth model against an enterprise-focused value proposition. This analysis aims to identify which trajectory offers superior risk-adjusted returns for a diversified portfolio in technology’s evolving infrastructure sector.
Table of contents
Companies Overview
Gen Digital Inc. and F5, Inc. hold pivotal roles in the software infrastructure sector, shaping cybersecurity and application delivery markets.
Gen Digital Inc.: Cyber Safety Leader
Gen Digital Inc. dominates consumer cybersecurity with its Norton 360 platform, protecting devices against malware and identity theft. Its revenue relies heavily on subscription services spanning PCs, Macs, and mobiles. In 2026, the company prioritizes integrated cyber safety solutions, expanding privacy tools like Dark Web Monitoring and Social Media Monitoring to strengthen its consumer protection moat.
F5, Inc.: Multi-Cloud Application Security Specialist
F5, Inc. excels in multi-cloud application security and delivery, offering BIG-IP appliances and advanced software modules. It drives revenue through enterprise-grade hardware, software, and professional services focused on securing applications across on-premises and public clouds. Its 2026 strategy emphasizes deepening cloud partnerships and enhancing network application performance to capture large enterprise and public sector demand.
Strategic Collision: Similarities & Divergences
Both companies operate in software infrastructure but diverge sharply in target markets—Gen Digital targets consumers with integrated cyber safety, while F5 serves enterprise cloud security needs. Their battleground lies in cybersecurity but at different layers: endpoint protection versus application delivery. This distinction crafts unique investment profiles—Gen Digital offers a subscription-driven consumer safety play, whereas F5 presents a hardware-software hybrid with strong cloud integration.
Income Statement Comparison
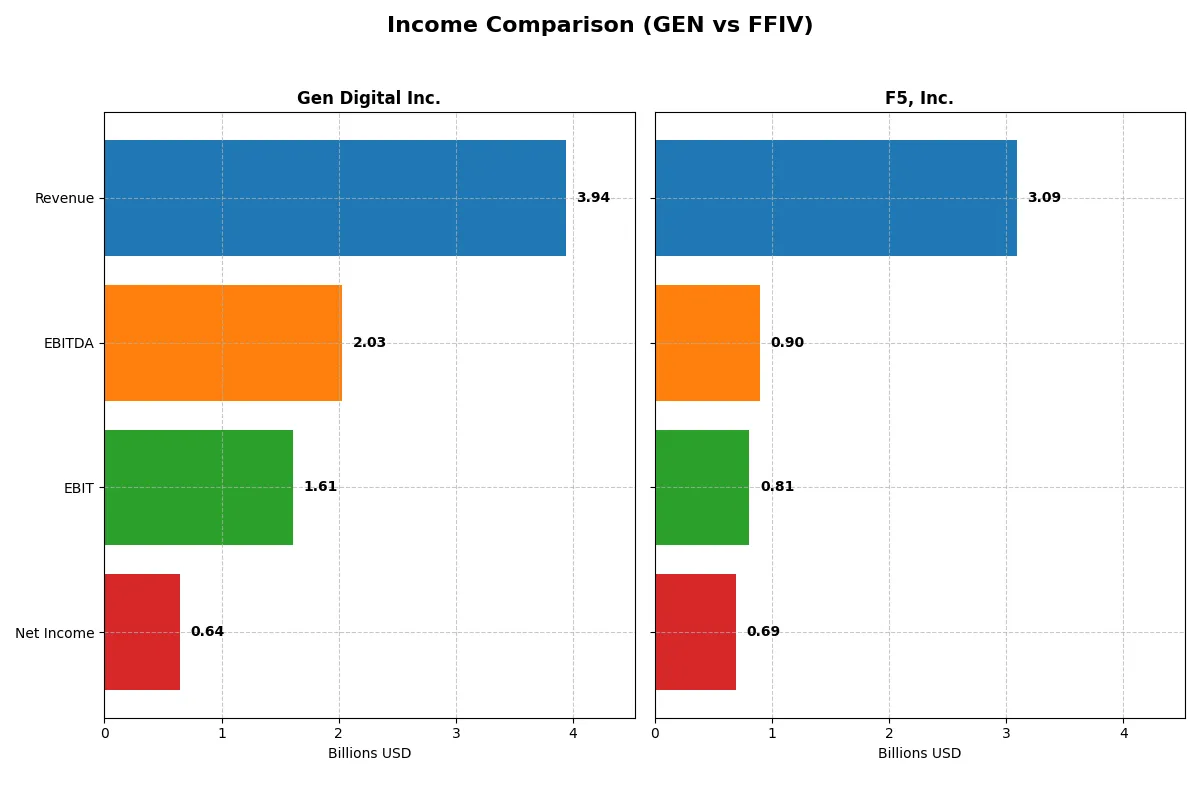
This data dissects the core profitability and scalability of both corporate engines to reveal who dominates the bottom line:
| Metric | Gen Digital Inc. (GEN) | F5, Inc. (FFIV) |
|---|---|---|
| Revenue | 3.94B | 3.09B |
| Cost of Revenue | 776M | 564M |
| Operating Expenses | 1.55B | 1.76B |
| Gross Profit | 3.16B | 2.52B |
| EBITDA | 2.03B | 901M |
| EBIT | 1.61B | 808M |
| Interest Expense | 578M | 0 |
| Net Income | 643M | 692M |
| EPS | 1.04 | 11.95 |
| Fiscal Year | 2025 | 2025 |
Income Statement Analysis: The Bottom-Line Duel
This income statement comparison reveals which company runs a more efficient and profitable business engine over recent years.
Gen Digital Inc. Analysis
Gen Digital’s revenue climbed steadily from 2.55B in 2021 to 3.94B in 2025, a 54% increase. Net income grew 16% overall but dipped sharply after 2023’s peak of 1.33B, settling at 643M in 2025. Gross margin remains robust near 80%, while net margin is moderate at 16%. The latest year shows improved EBIT margin at 40.8%, signaling operational leverage despite rising interest expenses.
F5, Inc. Analysis
F5’s revenue expanded by nearly 19% from 2.6B in 2021 to 3.1B in 2025, with net income surging 109% to 692M. Gross margin is a solid 81.7%, and net margin impresses at 22.4%. EBIT margin at 26.2% grew 21% year-over-year, reflecting healthy growth momentum. However, operating expenses rose slightly faster than revenue, creating a mild margin headwind.
Margin Power vs. Growth Momentum
Gen Digital posts higher EBIT margins, indicating stronger operational efficiency and cost control, but struggles with elevated interest costs that erode net income. F5 delivers superior net margin growth and EPS gains, driven by steady revenue growth and zero interest expense. For investors, Gen’s efficiency contrasts with F5’s dynamic growth profile, appealing respectively to value and growth-oriented strategies.
Financial Ratios Comparison
These vital ratios act as a diagnostic tool to expose the underlying fiscal health, valuation premiums, and capital efficiency of the companies analyzed:
| Ratios | Gen Digital Inc. (GEN) | F5, Inc. (FFIV) |
|---|---|---|
| ROE | 28.3% | 19.3% |
| ROIC | 7.8% | 14.0% |
| P/E | 25.4 | 26.9 |
| P/B | 7.19 | 5.19 |
| Current Ratio | 0.51 | 1.56 |
| Quick Ratio | 0.51 | 1.51 |
| D/E (Debt-to-Equity) | 3.66 | 0.06 |
| Debt-to-Assets | 53.7% | 3.7% |
| Interest Coverage | 2.79 | N/A |
| Asset Turnover | 0.25 | 0.49 |
| Fixed Asset Turnover | 36.1 | 9.02 |
| Payout ratio | 48.7% | 0% |
| Dividend yield | 1.92% | 0% |
| Fiscal Year | 2025 | 2025 |
Efficiency & Valuation Duel: The Vital Signs
Financial ratios act as a company’s DNA, unveiling hidden risks and operational excellence behind headline numbers.
Gen Digital Inc.
Gen Digital posts a strong ROE at 28.34% and a solid net margin of 16.34%, signaling robust profitability. However, its P/E of 25.36 and P/B of 7.19 suggest an expensive valuation. The company offers a modest 1.92% dividend yield, balancing shareholder returns with ongoing R&D investment.
F5, Inc.
F5 demonstrates favorable profitability with a 22.42% net margin and 19.28% ROE, supported by a higher ROIC of 13.99%. Its valuation is stretched with a P/E near 26.91 and no dividend payout. Instead, F5 focuses on reinvesting earnings into growth and innovation, maintaining a strong balance sheet with low leverage.
Premium Valuation vs. Operational Safety
F5 delivers superior operational efficiency and balance sheet strength, offset by a premium valuation and lack of dividends. Gen Digital offers higher shareholder yield but carries financial risks due to leverage and liquidity concerns. Risk-tolerant investors may prefer F5’s growth profile, while income-seekers might lean toward Gen Digital’s payout.
Which one offers the Superior Shareholder Reward?
Gen Digital Inc. pays a 1.9% dividend yield with a 49% payout ratio, well-covered by free cash flow at nearly 99%. Their buyback intensity is moderate but consistent, enhancing total return. F5, Inc. does not pay dividends but reinvests heavily, supported by strong free cash flow and minimal debt. F5’s robust buyback program, fueled by high cash per share and low leverage, offers flexible capital return. I believe F5’s distribution model, combining buybacks with reinvestment, is more sustainable and attractive for long-term total returns in 2026.
Comparative Score Analysis: The Strategic Profile
The radar chart exposes the fundamental DNA and trade-offs of Gen Digital Inc. and F5, Inc., highlighting their financial strengths and weaknesses:
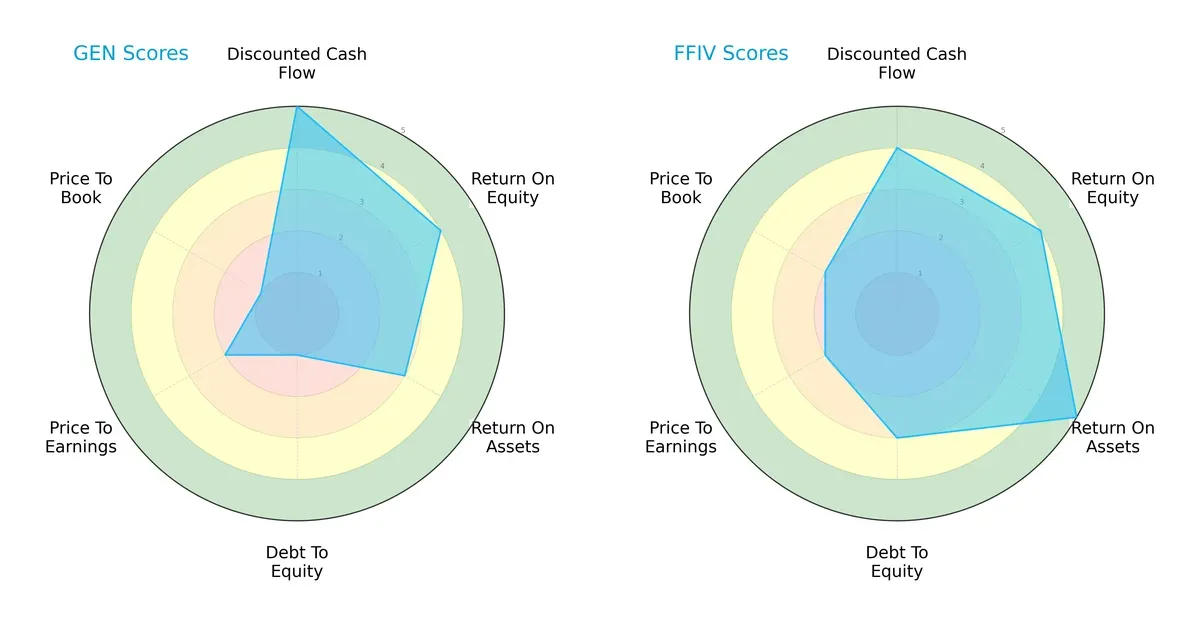
F5, Inc. demonstrates a more balanced profile with solid scores in ROA (5), ROE (4), and moderate debt-to-equity (3). Gen Digital excels in discounted cash flow (5) but suffers from a weak balance sheet, shown by very unfavorable debt-to-equity (1) and price-to-book (1) scores. Gen relies heavily on cash flow valuation, while F5 maintains consistent operational efficiency and financial stability.
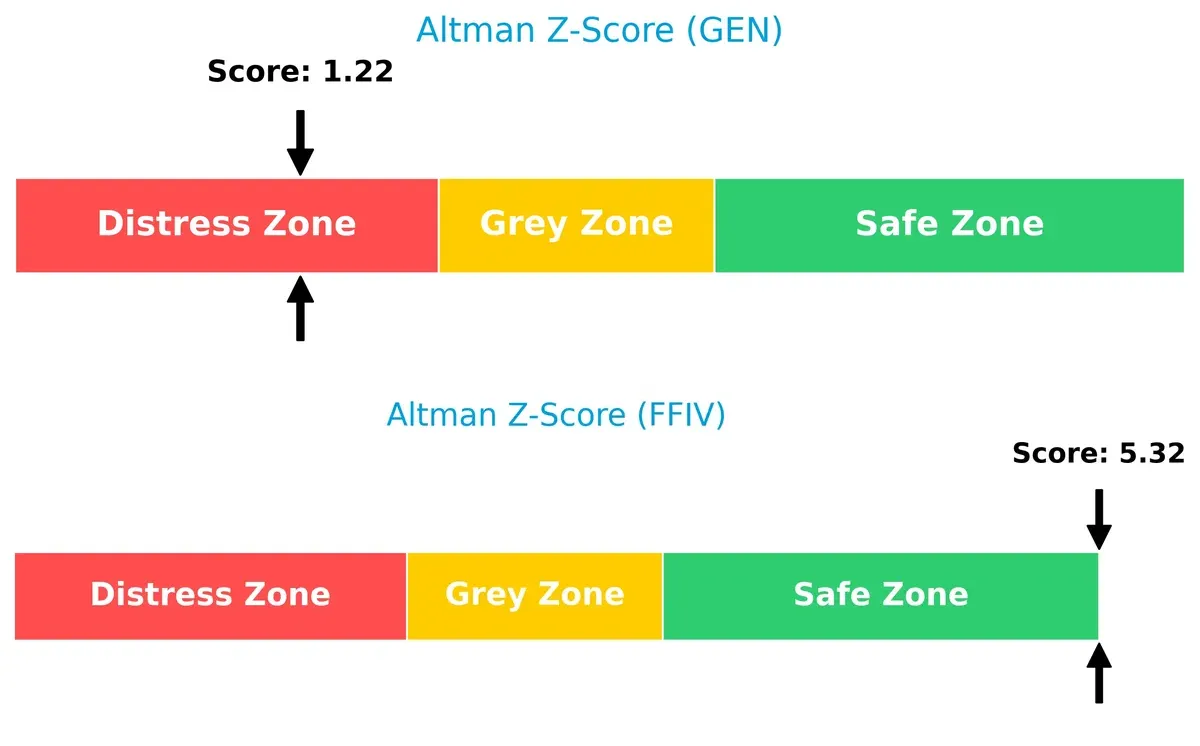
Bankruptcy Risk: Solvency Showdown
Gen’s Altman Z-Score of 1.22 signals significant bankruptcy risk, while F5’s 5.32 places it firmly in the safe zone, implying far stronger long-term survival prospects in this cycle:
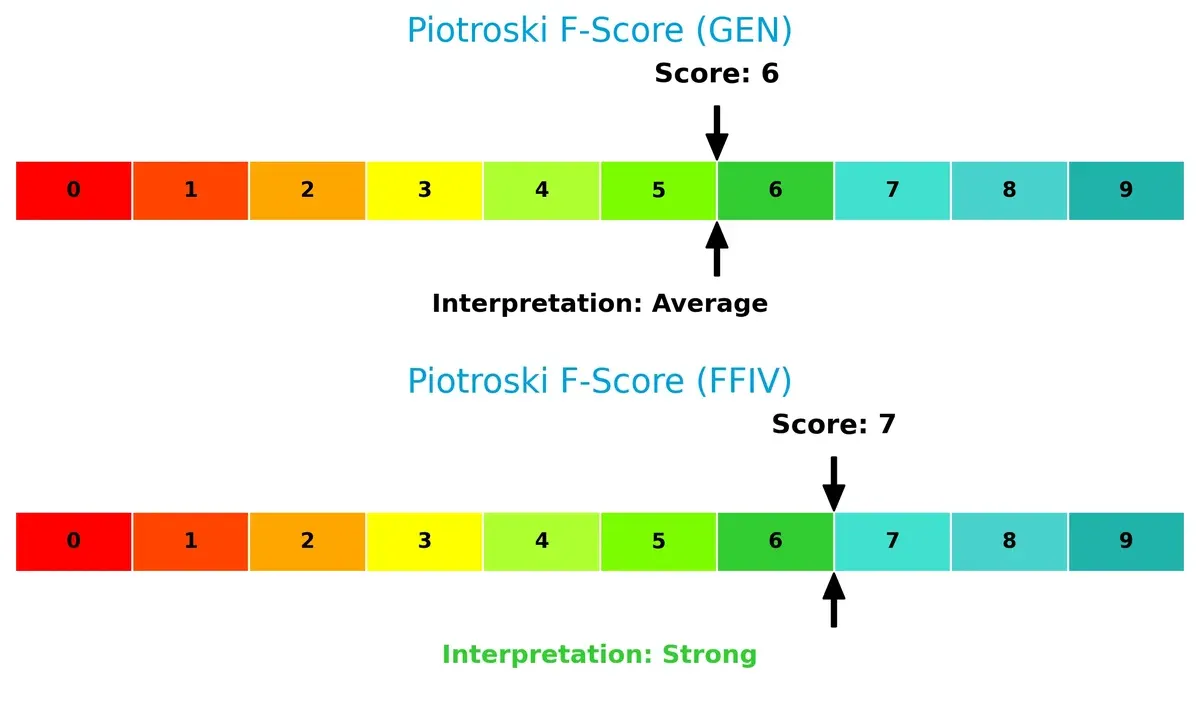
Financial Health: Quality of Operations
F5’s Piotroski F-Score of 7 indicates strong financial health, outperforming Gen’s average score of 6. Gen’s lower score flags some internal operational weaknesses compared to F5’s robust metrics:
How are the two companies positioned?
This section dissects GEN and FFIV’s operational DNA by comparing revenue distribution and internal dynamics, including strengths and weaknesses. The final objective confronts their economic moats to reveal which business model offers the most resilient, sustainable advantage today.
Revenue Segmentation: The Strategic Mix
This visual comparison dissects how Gen Digital Inc. and F5, Inc. diversify their income streams and where their primary sector bets lie:
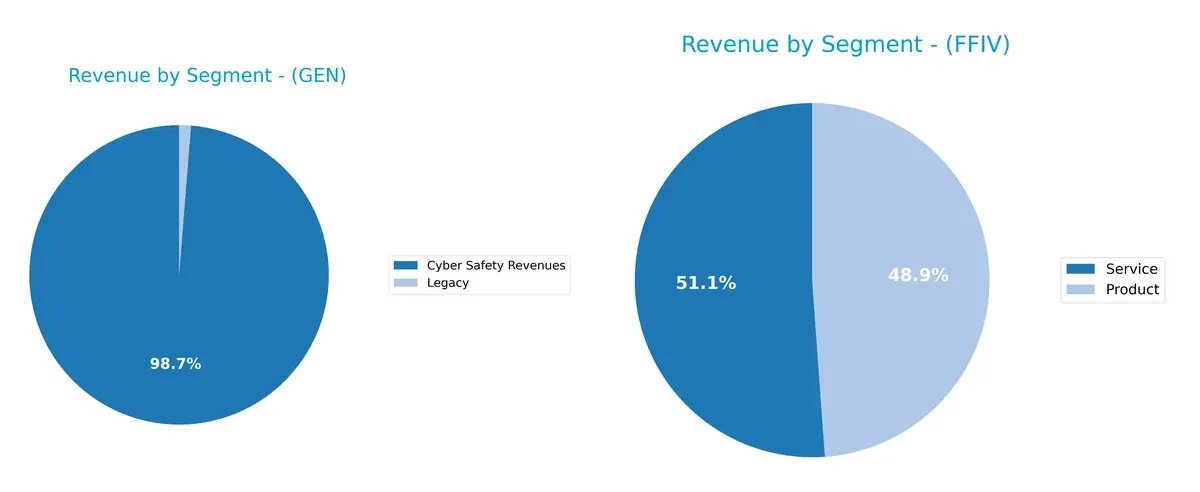
Gen Digital anchors revenue in Cyber Safety, generating $3.9B in 2025, with minimal Legacy income at $50M. This concentration signals a focused moat in cybersecurity. F5 balances $1.5B in Product and $1.6B in Service revenues, showing a more diversified mix. F5’s dual streams reduce concentration risk and indicate a broad infrastructure play, while Gen’s dominance in one segment risks overexposure but leverages ecosystem lock-in.
Strengths and Weaknesses Comparison
This table compares the Strengths and Weaknesses of Gen Digital Inc. and F5, Inc.:
Gen Digital Inc. Strengths
- Strong net margin at 16.34%
- High ROE of 28.34%
- Fixed asset turnover at 36.1
- Diverse revenue streams including Cyber Safety and Legacy products
- Significant Americas revenue at $2.59B
- Global presence across Americas, EMEA, Asia Pacific
F5, Inc. Strengths
- Higher net margin at 22.42%
- Favorable ROIC at 13.99% above WACC
- Strong current and quick ratios above 1.5
- Low debt-to-equity at 0.06 and low debt-to-assets at 3.65%
- Balanced revenue mix between Products and Services
- Broad geographic revenue with consistent growth in Americas, EMEA, Asia Pacific
Gen Digital Inc. Weaknesses
- Unfavorable liquidity ratios with current and quick ratios at 0.51
- High debt-to-equity ratio at 3.66 and debt to assets at 53.66%
- Unfavorable price multiples (PE 25.36, PB 7.19)
- Asset turnover low at 0.25
- Dividend yield moderate at 1.92%
- Limited product segmentation beyond core security and legacy
F5, Inc. Weaknesses
- PE ratio elevated at 26.91
- Price-to-book also high at 5.19
- Asset turnover below 0.5
- No dividend yield reported
- Lower ROE compared to Gen Digital
- Slightly less fixed asset turnover at 9.02
Both companies exhibit solid profitability but differ in financial structure and liquidity. Gen Digital carries higher leverage and weaker liquidity, which may constrain flexibility. F5 shows stronger balance sheet health and operational efficiency but trades at higher valuation multiples. Strategic focus on managing these financial risks will shape future competitive positioning.
The Moat Duel: Analyzing Competitive Defensibility
A structural moat is the only reliable defense protecting long-term profits from the relentless erosion of competition. Let’s examine how these two firms stand:
Gen Digital Inc.: Intangible Assets Driving Consumer Trust
Gen Digital’s moat stems from extensive brand recognition and subscription-based cyber safety services. Its high gross margin (~80%) and stable net margins reflect this intangible advantage. However, declining ROIC signals margin pressure, and innovation in AI-driven security could either deepen or threaten its moat in 2026.
F5, Inc.: Cost Advantage Anchored by Multi-Cloud Expertise
F5 leverages a cost advantage through specialized multi-cloud application delivery and security solutions. It commands strong net margins (22%) and shows accelerating revenue growth. Unlike Gen, F5’s ROIC outpaces WACC by over 5%, with a rising trend, suggesting a widening moat. Expansion into cloud-native services offers substantial upside.
Intangible Assets vs. Cost Leadership: The Moat Verdict
F5’s growing ROIC and superior margin expansion reveal a deeper, more durable moat than Gen’s eroding profitability. I view F5 as better equipped to defend and expand market share amid intensifying competition in software infrastructure.
Which stock offers better returns?
The 12-month price movements reveal contrasting dynamics: Gen Digital Inc. shows moderate gains with slowing momentum, while F5, Inc. posts strong, accelerating growth.
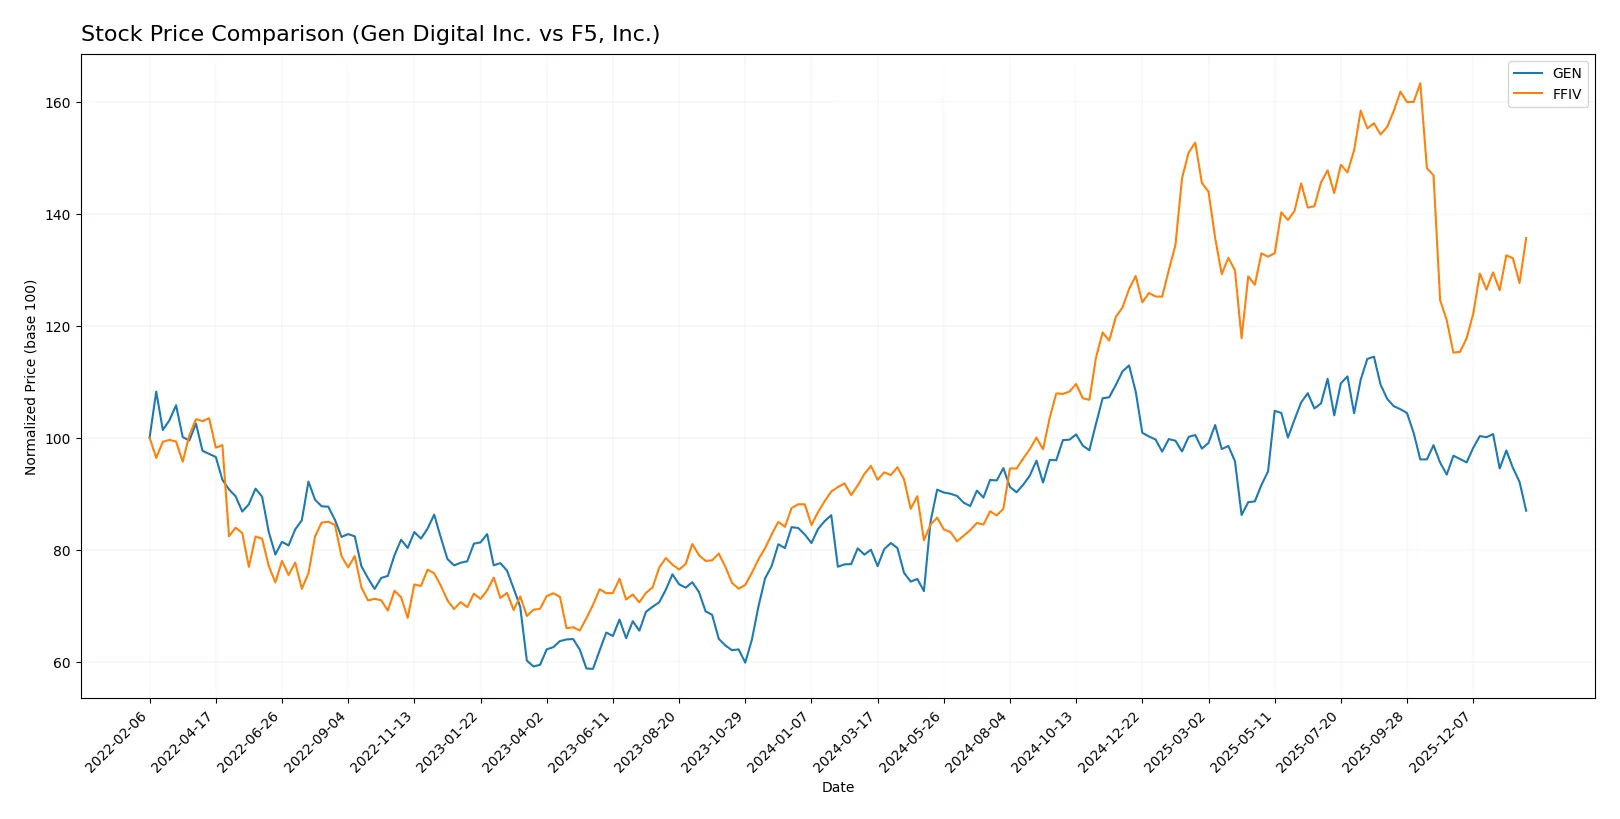
Trend Comparison
Gen Digital Inc. gained 8.7% over the past year, signaling a bullish trend with decelerating momentum. The stock peaked at 31.58 and bottomed at 20.03, showing moderate volatility (2.52 std dev).
F5, Inc. surged 42.85% over the same period, reflecting a bullish trend with accelerating momentum. It ranged between 165.57 and 331.75, exhibiting high volatility (48.51 std dev).
F5, Inc. delivered significantly higher returns with accelerating price gains, outperforming Gen Digital Inc. in market performance over the past year.
Target Prices
Analysts present a bullish consensus on both Gen Digital Inc. and F5, Inc. with clear upside potential.
| Company | Target Low | Target High | Consensus |
|---|---|---|---|
| Gen Digital Inc. | 31 | 32 | 31.5 |
| F5, Inc. | 295 | 352 | 330.67 |
Gen Digital’s consensus target sits about 31% above its current price of 24, signaling strong growth expectations. F5’s target consensus exceeds its present 276 price by approximately 20%, reflecting robust confidence in its market position.

Don’t Let Luck Decide Your Entry Point
Optimize your entry points with our advanced ProRealTime indicators. You’ll get efficient buy signals with precise price targets for maximum performance. Start outperforming now!
How do institutions grade them?
Gen Digital Inc. Grades
Here are the recent grades assigned to Gen Digital Inc. by major grading firms:
| Grading Company | Action | New Grade | Date |
|---|---|---|---|
| RBC Capital | Maintain | Sector Perform | 2025-11-07 |
| Evercore ISI Group | Maintain | Outperform | 2025-11-07 |
| Morgan Stanley | Maintain | Equal Weight | 2025-09-02 |
| Barclays | Maintain | Equal Weight | 2025-08-08 |
| Wells Fargo | Maintain | Overweight | 2025-08-08 |
| RBC Capital | Maintain | Sector Perform | 2025-08-08 |
| Barclays | Maintain | Equal Weight | 2025-07-14 |
| RBC Capital | Maintain | Sector Perform | 2025-05-07 |
| Morgan Stanley | Maintain | Equal Weight | 2025-04-16 |
| RBC Capital | Maintain | Sector Perform | 2025-01-31 |
F5, Inc. Grades
The following table presents F5, Inc.’s recent institutional grades from recognized firms:
| Grading Company | Action | New Grade | Date |
|---|---|---|---|
| Needham | Maintain | Hold | 2026-01-28 |
| Piper Sandler | Maintain | Overweight | 2026-01-28 |
| Goldman Sachs | Maintain | Neutral | 2026-01-28 |
| Barclays | Maintain | Equal Weight | 2026-01-28 |
| RBC Capital | Maintain | Outperform | 2026-01-28 |
| JP Morgan | Upgrade | Overweight | 2026-01-15 |
| Piper Sandler | Upgrade | Overweight | 2026-01-05 |
| RBC Capital | Upgrade | Outperform | 2026-01-05 |
| Morgan Stanley | Maintain | Equal Weight | 2025-12-17 |
| Morgan Stanley | Maintain | Equal Weight | 2025-10-28 |
Which company has the best grades?
F5, Inc. has received more upgrades and higher ratings, including multiple Overweight and Outperform designations. Gen Digital’s ratings cluster around Sector Perform and Equal Weight, suggesting F5 commands stronger institutional confidence. This difference may influence investor sentiment and portfolio positioning.
Risks specific to each company
The following categories identify the critical pressure points and systemic threats facing both firms in the 2026 market environment:
1. Market & Competition
Gen Digital Inc.
- Faces intense competition in cyber safety with evolving threats and numerous rivals in consumer cybersecurity.
F5, Inc.
- Competes in multi-cloud application security with large enterprise clients and heavy reliance on cloud partnerships.
2. Capital Structure & Debt
Gen Digital Inc.
- High debt levels with debt-to-assets at 53.66% and weak debt-to-equity score signals financial risk.
F5, Inc.
- Low debt burden with debt-to-assets at 3.65%, reflecting a solid balance sheet and strong financial flexibility.
3. Stock Volatility
Gen Digital Inc.
- Beta of 1.08 indicates slightly above-market volatility, which may amplify downside risk.
F5, Inc.
- Beta of 0.98 suggests near-market volatility, offering more stability in turbulent markets.
4. Regulatory & Legal
Gen Digital Inc.
- Cybersecurity sector faces evolving privacy laws and data protection regulations globally.
F5, Inc.
- Subject to regulations governing network security and cloud data compliance across multiple jurisdictions.
5. Supply Chain & Operations
Gen Digital Inc.
- Operations depend on software distribution through third parties and telecom providers, exposing it to channel risks.
F5, Inc.
- Relies on hardware-software integration and cloud partnerships, increasing operational complexity and supply chain exposure.
6. ESG & Climate Transition
Gen Digital Inc.
- ESG risks moderate; focus on privacy and data security aligns with evolving regulatory expectations.
F5, Inc.
- Increasing pressure to reduce carbon footprint and enhance sustainable practices in data center operations.
7. Geopolitical Exposure
Gen Digital Inc.
- Global operations in multiple regions expose it to geopolitical tensions and cyber warfare risks.
F5, Inc.
- Diverse international presence with significant exposure to U.S.-China tech tensions and cloud market regulations.
Which company shows a better risk-adjusted profile?
F5, Inc. exhibits a markedly stronger risk-adjusted profile. Its minimal leverage and superior Altman Z-score place it in the safe zone, unlike Gen Digital’s distress zone status. Gen Digital’s debt load and liquidity weakness pose the greatest risk. F5’s robust financial health and lower volatility offer a more prudent investment choice in 2026’s uncertain environment.
Final Verdict: Which stock to choose?
Gen Digital Inc. stands out for its robust profitability and impressive return on equity, signaling a cash machine that drives solid earnings. However, its heavy leverage and weak liquidity pose a point of vigilance. This stock suits investors with an appetite for aggressive growth willing to tolerate balance sheet risks.
F5, Inc. benefits from a durable competitive moat, reflected in its growing ROIC well above WACC, and a conservative balance sheet that offers better financial stability than Gen Digital. Its strong free cash flow and favorable income growth make it a fit for GARP investors seeking steady growth with reasonable risk.
If you prioritize aggressive earnings growth and can handle higher leverage, Gen Digital could be compelling due to its strong net margins and operational efficiency. However, if you seek a more stable financial profile with a proven economic moat, F5 offers better long-term durability and less balance sheet risk, though it commands a premium valuation.
Disclaimer: Investment carries a risk of loss of initial capital. The past performance is not a reliable indicator of future results. Be sure to understand risks before making an investment decision.
Go Further
I encourage you to read the complete analyses of Gen Digital Inc. and F5, Inc. to enhance your investment decisions: