Home > Comparison > Technology > FTNT vs FFIV
The strategic rivalry between Fortinet, Inc. and F5, Inc. defines the current trajectory of software infrastructure in technology. Fortinet operates as a cybersecurity powerhouse offering integrated hardware and software solutions, while F5 focuses on multi-cloud application security and delivery. This head-to-head pits Fortinet’s broad security platform against F5’s specialized application services. This analysis will determine which company’s model offers superior risk-adjusted returns for a diversified portfolio in 2026.
Table of contents
Companies Overview
Fortinet and F5 dominate the evolving cybersecurity and application delivery markets with distinct approaches and scale.
Fortinet, Inc.: Cybersecurity Infrastructure Powerhouse
Fortinet stands as a leading provider of integrated cybersecurity solutions globally. Its core revenue comes from hardware and software licenses for firewalls, VPNs, endpoint protection, and network security appliances. In 2026, Fortinet emphasizes broad, automated security with a diverse product suite, reinforcing its competitive edge in multi-layered defense and channel sales.
F5, Inc.: Multi-Cloud Application Security Specialist
F5 focuses on multi-cloud application delivery and security, enabling enterprises to secure and operate applications across various environments. It monetizes through high-performance hardware and software modules, including application security managers and DDoS protection. The company’s 2026 strategy centers on expanding cloud partnerships and delivering scalable solutions for hybrid infrastructures.
Strategic Collision: Similarities & Divergences
Both companies target infrastructure security but diverge in philosophy: Fortinet pursues a comprehensive security ecosystem, while F5 prioritizes application delivery across multi-cloud platforms. Their primary battleground is securing enterprise networks amid increasing cloud adoption. Fortinet’s extensive product breadth contrasts with F5’s specialized application focus, crafting distinct investment profiles shaped by scale and market scope.
Income Statement Comparison
This data dissects the core profitability and scalability of both corporate engines to reveal who dominates the bottom line:

| Metric | Fortinet, Inc. (FTNT) | F5, Inc. (FFIV) |
|---|---|---|
| Revenue | 6.8B | 3.1B |
| Cost of Revenue | 1.3B | 574M |
| Operating Expenses | 3.4B | 1.7B |
| Gross Profit | 5.5B | 2.5B |
| EBITDA | 2.4B | 884M |
| EBIT | 2.3B | 791M |
| Interest Expense | 20M | 0 |
| Net Income | 1.9B | 692M |
| EPS | 2.44 | 11.96 |
| Fiscal Year | 2025 | 2025 |
Income Statement Analysis: The Bottom-Line Duel
The income statement comparison will reveal which company’s financial engine runs more efficiently and delivers stronger profitability.
Fortinet, Inc. Analysis
Fortinet’s revenue surged from 3.3B in 2021 to nearly 6.8B in 2025, doubling over five years. Net income tripled from 607M to 1.85B, highlighting robust profit growth. The company maintains a commanding gross margin of 81% and a strong net margin near 27%, though net margin slightly dipped last year. Efficiency gains and expanding scale fuel its momentum in 2025.
F5, Inc. Analysis
F5’s revenue grew steadily from 2.6B in 2021 to 3.1B in 2025, a more modest increase than Fortinet. Net income more than doubled, reaching 692M in 2025. Gross margin holds firm at 81%, with net margin improving to 22%, reflecting solid cost control. Recent growth in EBIT and EPS shows accelerating profitability, driven by disciplined expense management and margin expansion.
Verdict: Rapid Growth vs. Margin Expansion
Fortinet outpaces F5 in revenue scale and net income magnitude, boasting a higher net margin and stronger overall growth rates. F5, however, delivers excellent margin expansion and EPS growth, indicating operational efficiency. For investors, Fortinet offers a high-growth profile, while F5 presents a steadier margin improvement story—each appealing depending on risk tolerance and growth preference.
Financial Ratios Comparison
These vital ratios act as a diagnostic tool to expose the underlying fiscal health, valuation premiums, and capital efficiency of the companies compared below:
| Ratios | Fortinet, Inc. (FTNT) | F5, Inc. (FFIV) |
|---|---|---|
| ROE | 1.50 | 0.19 |
| ROIC | 0.29 | 0.14 |
| P/E | 32.5 | 26.9 |
| P/B | 48.6 | 5.19 |
| Current Ratio | 1.17 | 1.56 |
| Quick Ratio | 1.09 | 1.51 |
| D/E | 0.81 | 0.07 |
| Debt-to-Assets | 0.096 | 0.041 |
| Interest Coverage | 104.0 | 0 |
| Asset Turnover | 0.65 | 0.49 |
| Fixed Asset Turnover | 4.20 | 9.02 |
| Payout Ratio | 0 | 0 |
| Dividend Yield | 0 | 0 |
| Fiscal Year | 2025 | 2025 |
Efficiency & Valuation Duel: The Vital Signs
Financial ratios act as a company’s DNA, revealing hidden risks and operational excellence crucial for investment decisions.
Fortinet, Inc.
Fortinet delivers exceptional profitability with a ROE at 150% and strong margins near 27%. The stock trades at a stretched P/E of 32.5 and a high P/B of 48.6, indicating expensive valuation. Fortinet does not pay dividends, instead reinvesting heavily in R&D to fuel growth and maintain its competitive moat.
F5, Inc.
F5 shows solid profitability, with a ROE of 19.3% and a net margin of 22.4%. Its valuation is less stretched, with a P/E of 26.9 and a modest P/B of 5.2. The company offers no dividend but demonstrates prudent capital allocation, balancing growth investments and maintaining a strong balance sheet with low leverage.
High Growth vs. Balanced Value: Weighing Risk and Reward
Fortinet’s superior profitability comes at a premium valuation and reinvestment focus, while F5 offers more moderate returns with a favorable financial structure. Investors seeking aggressive growth might lean toward Fortinet; those prioritizing balance and financial safety may favor F5.
Which one offers the Superior Shareholder Reward?
Fortinet and F5 both forgo dividends, focusing on reinvestment and buybacks for shareholder returns. Fortinet’s zero dividend yield pairs with a restrained buyback program, conserving FCF for R&D and growth, while F5 executes aggressive buybacks, enhancing shareholder value through capital return. I see F5’s model as more sustainable and rewarding in 2026 given its strong free cash flow coverage (95%) and disciplined payout, contrasting Fortinet’s cautious capital allocation. F5’s lower price-to-free-cash-flow ratio (20.6 vs. Fortinet’s 27) signals better value. I favor F5 for superior total return potential this year.
Comparative Score Analysis: The Strategic Profile
The radar chart reveals the fundamental DNA and trade-offs of Fortinet, Inc. and F5, Inc., illustrating their financial strengths and valuation nuances:
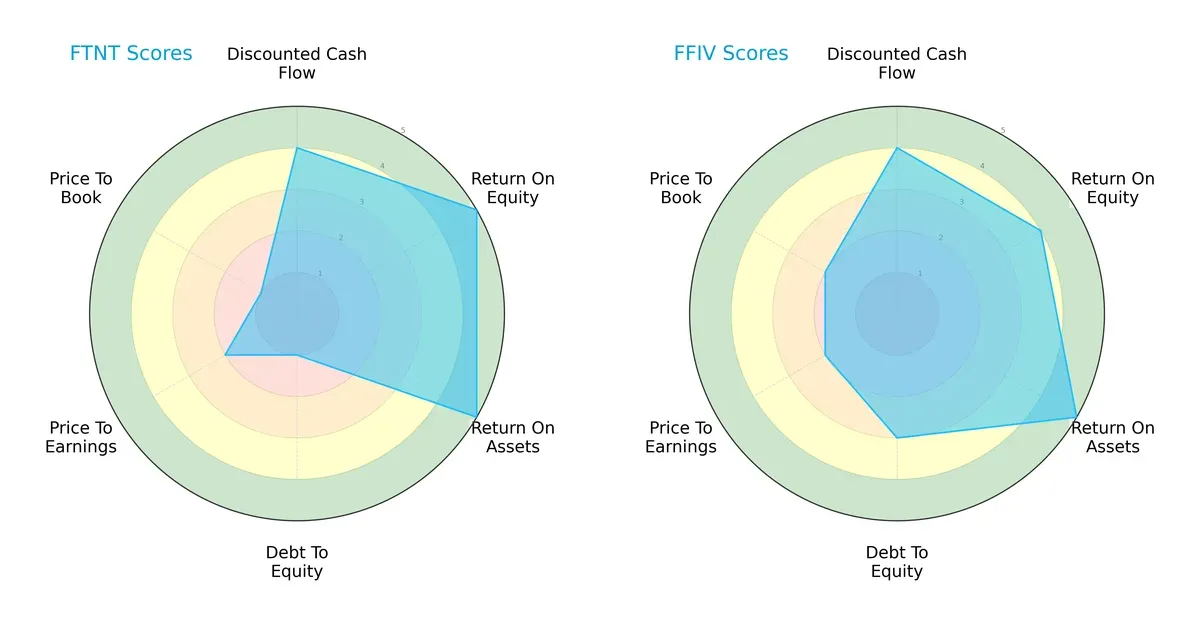
Fortinet excels in profitability metrics, boasting top scores in ROE and ROA, but suffers from a weak debt-to-equity profile and poor valuation scores. F5 offers a more balanced financial profile with moderate leverage and slightly better valuation metrics, though its profitability edges are less pronounced. F5’s overall score advantage reflects steadier capital structure management, while Fortinet leans heavily on operational efficiency.
Bankruptcy Risk: Solvency Showdown
The Altman Z-Scores for both firms place them comfortably in the safe zone, signaling low bankruptcy risk in the current economic cycle:
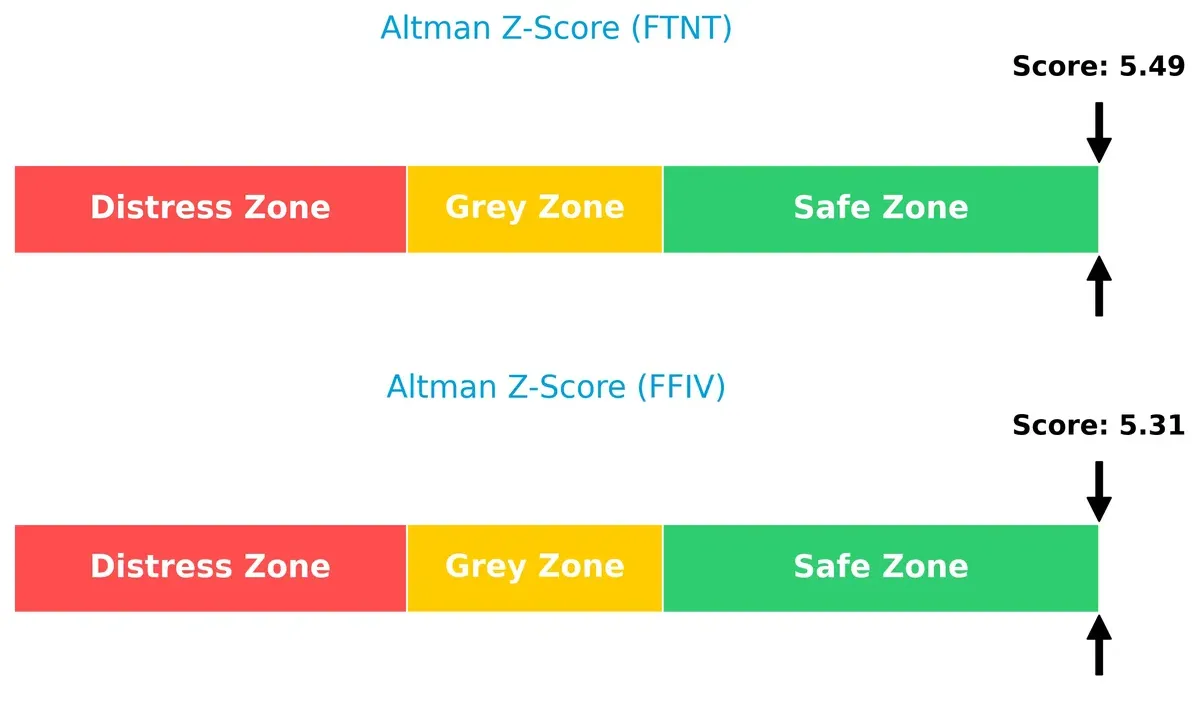
Fortinet’s slightly higher score (5.49) versus F5’s 5.31 suggests marginally better solvency, but both maintain strong buffers against financial distress.
Financial Health: Quality of Operations
Both companies register an identical Piotroski F-Score of 6, indicating average financial health with no glaring internal red flags:
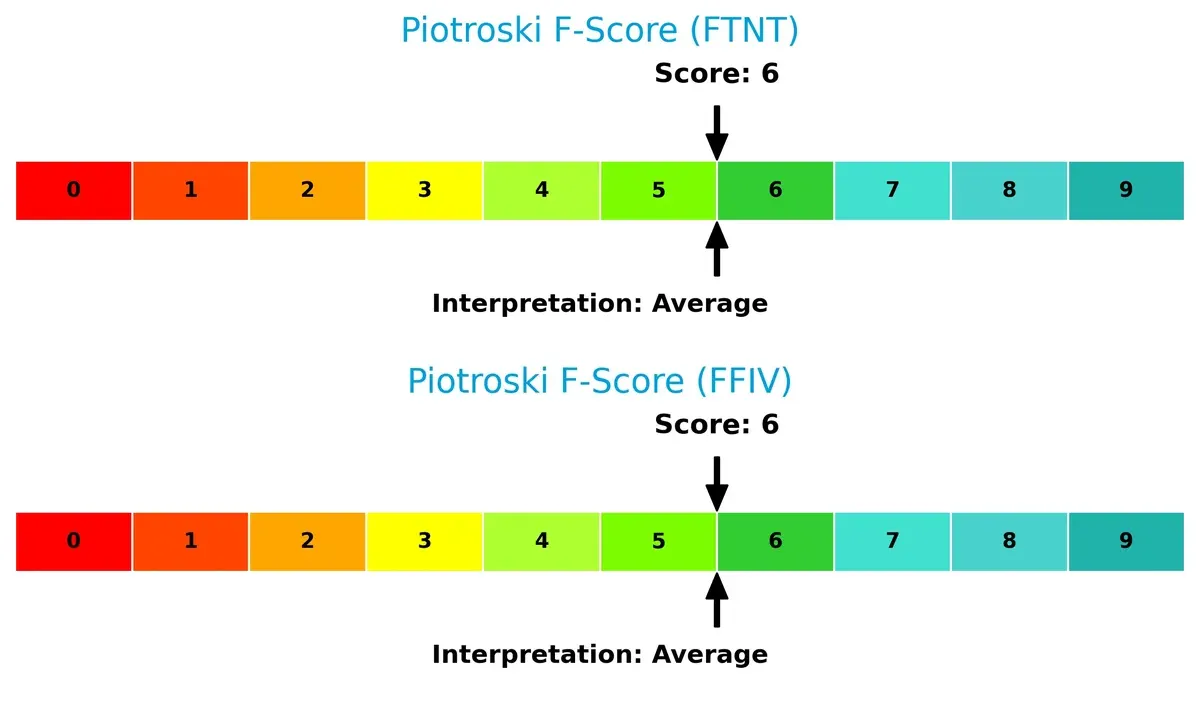
This parity suggests comparable operational quality, though neither demonstrates peak financial robustness. Investors should monitor for improvements in internal efficiency and profitability metrics going forward.
How are the two companies positioned?
This section dissects Fortinet and F5’s operational DNA by comparing their revenue distribution and internal strengths and weaknesses. The goal is to confront their economic moats and reveal which model offers the most resilient, sustainable competitive advantage today.
Revenue Segmentation: The Strategic Mix
This visual comparison dissects how Fortinet, Inc. and F5, Inc. diversify their income streams and highlights their primary sector bets for 2024:
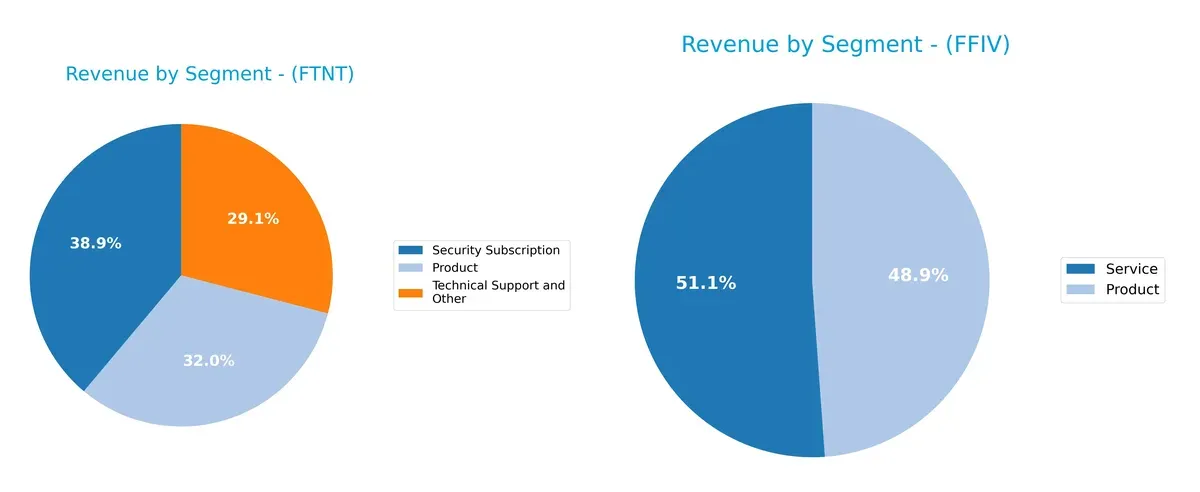
Fortinet anchors revenue in three segments: Security Subscription leads with $2.3B, followed by Product at $1.9B, and Technical Support at $1.7B. This mix shows strong subscription growth and ecosystem lock-in. F5 depends heavily on two segments, Product ($1.3B) and Service ($1.5B), with less diversification. Fortinet’s broader base reduces concentration risk, while F5’s reliance on service revenue highlights infrastructure dominance but potential volatility.
Strengths and Weaknesses Comparison
This table compares the Strengths and Weaknesses of Fortinet, Inc. and F5, Inc.:
Fortinet, Inc. Strengths
- Higher net margin at 27.26%
- Superior ROE of 149.77%
- Strong ROIC of 28.76%
- Favorable quick ratio at 1.09
- Low debt-to-assets at 9.59%
- Balanced global revenue across Americas, EMEA, and Asia Pacific
F5, Inc. Strengths
- Favorable net margin at 22.42%
- ROE of 19.28% supports profitability
- Favorable ROIC at 13.8%
- Strong liquidity with current ratio 1.56
- Very low debt-to-equity at 0.07
- High fixed asset turnover at 9.02
Fortinet, Inc. Weaknesses
- Unfavorable high PE at 32.48 and PB at 48.64
- Moderate current ratio at 1.17
- No dividend yield
- Asset turnover neutral at 0.65
F5, Inc. Weaknesses
- Unfavorable PE at 26.91 and PB at 5.19
- Asset turnover low at 0.49
- No dividend yield
- Slightly less diversified revenue, with service segment dominant
Fortinet’s strengths lie in superior profitability metrics and global diversification, though valuation ratios appear stretched. F5 shows solid liquidity and capital efficiency but faces challenges in asset turnover and valuation. These contrasts reflect differing strategic priorities in growth and capital structure.
The Moat Duel: Analyzing Competitive Defensibility
A structural moat protects long-term profits by fending off competition and preserving economic value in perpetuity. Let’s examine these companies’ moats:
Fortinet, Inc.: Network Effects and Integrated Security
Fortinet leverages network effects through its broad cybersecurity platform. Its very favorable moat shows in a 20% ROIC premium over WACC and margin stability. Expansion into AI-driven security deepens this moat in 2026.
F5, Inc.: Customizable Application Delivery Moat
F5’s moat stems from high switching costs in multi-cloud application delivery. It maintains strong profitability with a 5.4% ROIC premium over WACC but lags Fortinet’s scale. Cloud-native innovations offer growth but risk disruption.
Network Effects vs. Switching Costs: The Moat Faceoff
Fortinet’s wider moat benefits from integrated security and accelerating ROIC growth, outperforming F5’s switching-cost moat. Fortinet stands better equipped to defend and expand market share amid intensifying cybersecurity demand.
Which stock offers better returns?
The past year reveals distinct price dynamics: Fortinet, Inc. shows steady gains with decelerating momentum, while F5, Inc. demonstrates stronger acceleration and higher volatility.
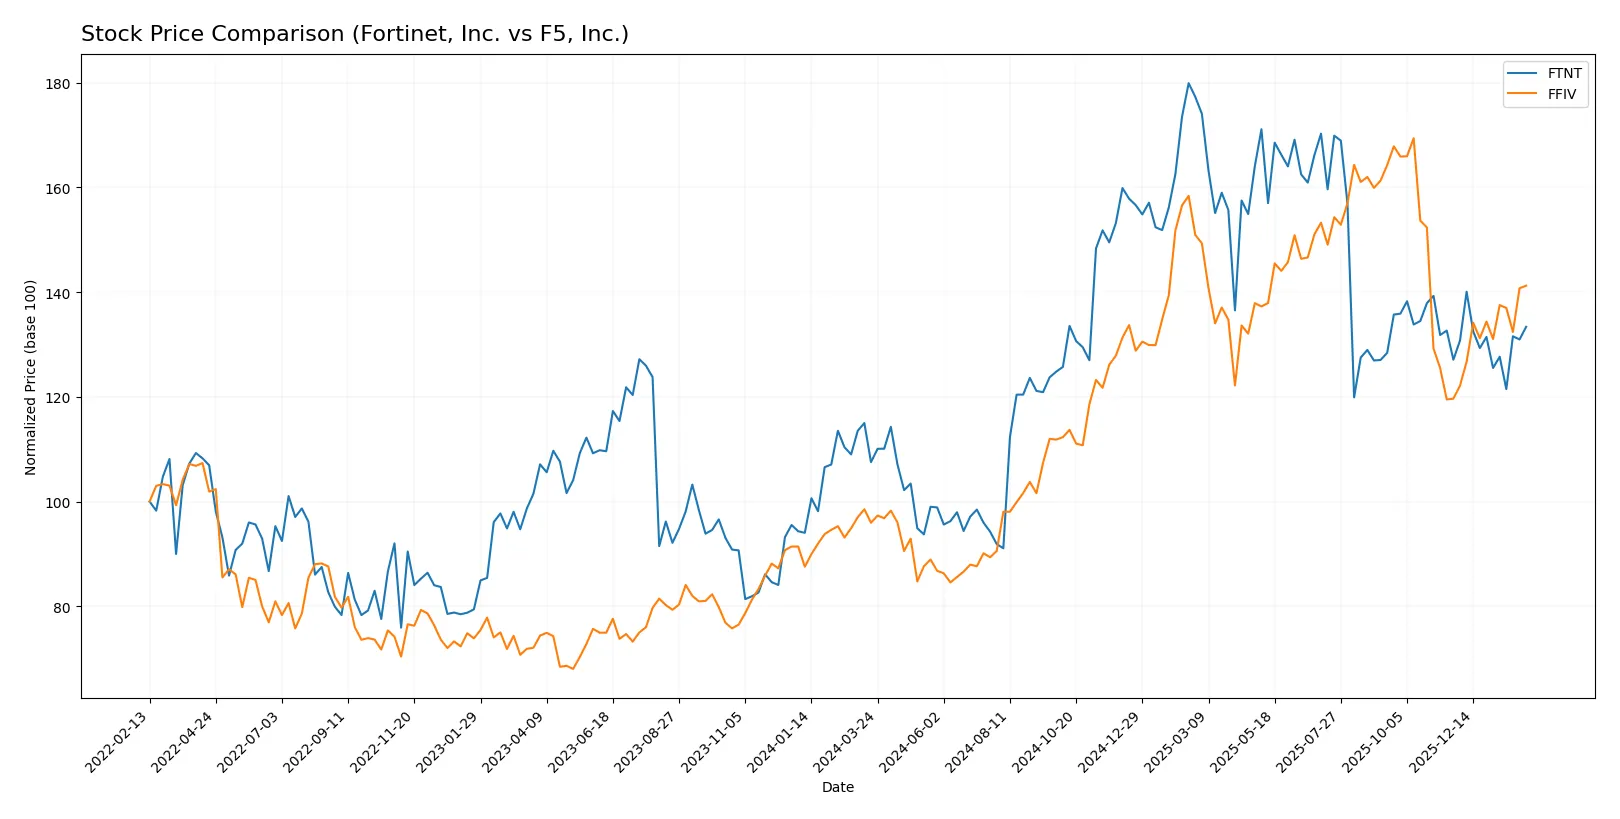
Trend Comparison
Fortinet, Inc. posted a 24.04% price increase over 12 months, marking a bullish trend with decelerating momentum and a moderate volatility level (std dev 15.07). The stock ranged between 56.51 and 111.64.
F5, Inc. surged 47.19% over the same period, reflecting a bullish trend with accelerating momentum and significant volatility (std dev 48.28). Its price fluctuated from 165.57 to 331.75.
Comparing both, F5, Inc. outperformed Fortinet with nearly double the price appreciation and stronger upward acceleration in 2026.
Target Prices
Analysts project solid upside for Fortinet, Inc. and F5, Inc., reflecting confidence in their sector positioning.
| Company | Target Low | Target High | Consensus |
|---|---|---|---|
| Fortinet, Inc. | 70 | 90 | 85 |
| F5, Inc. | 295 | 352 | 330.67 |
Fortinet’s consensus target sits about 3% above its current $82.76 price, signaling moderate upside. F5’s target consensus exceeds its $276.57 price by nearly 20%, showing stronger growth expectations.

Don’t Let Luck Decide Your Entry Point
Optimize your entry points with our advanced ProRealTime indicators. You’ll get efficient buy signals with precise price targets for maximum performance. Start outperforming now!
How do institutions grade them?
Fortinet, Inc. Grades
This table shows recent grades given to Fortinet, Inc. by major grading firms.
| Grading Company | Action | New Grade | Date |
|---|---|---|---|
| Rosenblatt | Maintain | Buy | 2026-02-06 |
| Mizuho | Maintain | Underperform | 2026-02-06 |
| JP Morgan | Maintain | Underweight | 2026-02-06 |
| RBC Capital | Maintain | Sector Perform | 2026-02-06 |
| Wedbush | Maintain | Outperform | 2026-02-06 |
| Scotiabank | Downgrade | Sector Perform | 2026-02-02 |
| JP Morgan | Maintain | Underweight | 2026-01-30 |
| Rosenblatt | Upgrade | Buy | 2026-01-29 |
| TD Cowen | Upgrade | Buy | 2026-01-23 |
| Citigroup | Maintain | Neutral | 2026-01-13 |
F5, Inc. Grades
The following table summarizes recent ratings for F5, Inc. by recognized grading companies.
| Grading Company | Action | New Grade | Date |
|---|---|---|---|
| Needham | Maintain | Hold | 2026-01-28 |
| RBC Capital | Maintain | Outperform | 2026-01-28 |
| Piper Sandler | Maintain | Overweight | 2026-01-28 |
| Barclays | Maintain | Equal Weight | 2026-01-28 |
| Goldman Sachs | Maintain | Neutral | 2026-01-28 |
| JP Morgan | Upgrade | Overweight | 2026-01-15 |
| Piper Sandler | Upgrade | Overweight | 2026-01-05 |
| RBC Capital | Upgrade | Outperform | 2026-01-05 |
| Morgan Stanley | Maintain | Equal Weight | 2025-12-17 |
| RBC Capital | Maintain | Sector Perform | 2025-10-28 |
Which company has the best grades?
F5, Inc. has consistently received more positive upgrades and higher ratings such as Outperform and Overweight. Fortinet shows a mixed profile with several Underperform and Underweight grades. Investors may interpret F5’s stronger consensus as a sign of broader institutional confidence.
Risks specific to each company
The following categories identify the critical pressure points and systemic threats facing both firms in the 2026 market environment:
1. Market & Competition
Fortinet, Inc.
- Faces intense competition in cybersecurity, requiring constant innovation to maintain its strong market position.
F5, Inc.
- Operates in a competitive multi-cloud security space, challenged by rapid shifts in cloud adoption and evolving customer needs.
2. Capital Structure & Debt
Fortinet, Inc.
- Maintains moderate leverage (D/E 0.81) with strong interest coverage, but debt-to-equity score signals financial risk.
F5, Inc.
- Exhibits low leverage (D/E 0.07) and excellent interest coverage, indicating robust financial stability and lower default risk.
3. Stock Volatility
Fortinet, Inc.
- Beta of 1.047 suggests moderate sensitivity to market swings, with volume nearly double average, indicating active trading.
F5, Inc.
- Beta near 1.008 reflects market-aligned volatility; lower trading volume reduces short-term price swings.
4. Regulatory & Legal
Fortinet, Inc.
- Subject to cybersecurity regulations globally, with potential legal risks from data breaches or compliance lapses.
F5, Inc.
- Faces regulatory scrutiny in cloud security compliance and data privacy, especially across multiple jurisdictions.
5. Supply Chain & Operations
Fortinet, Inc.
- Relies on hardware production and software licensing, vulnerable to semiconductor supply constraints and logistics delays.
F5, Inc.
- Primarily software-centric with some hardware, facing risks from component availability and integration complexities.
6. ESG & Climate Transition
Fortinet, Inc.
- Increasing pressure to align cybersecurity solutions with ESG standards; climate risks affect data center operations.
F5, Inc.
- ESG initiatives advancing, but cloud infrastructure energy consumption and sustainability remain key challenges.
7. Geopolitical Exposure
Fortinet, Inc.
- Global footprint exposes it to geopolitical tensions affecting trade and cross-border data flows.
F5, Inc.
- Broad international exposure includes risks from evolving trade policies and regional cybersecurity mandates.
Which company shows a better risk-adjusted profile?
Fortinet’s biggest risk lies in its elevated debt-to-equity ratio, signaling financial vulnerability despite strong operational metrics. F5 faces market and product relevance challenges in a rapidly evolving cloud landscape but boasts superior capital structure and lower financial risk. Given F5’s stronger balance sheet and favorable overall ratios, it presents a better risk-adjusted profile. Notably, Fortinet’s debt-to-equity score remains very unfavorable, justifying caution despite its operational strength.
Final Verdict: Which stock to choose?
Fortinet’s superpower lies in its ability to generate exceptional returns on invested capital, signaling a durable competitive edge and impressive cash flow conversion. A point of vigilance is its stretched valuation multiples, which could pressure future gains. It suits portfolios targeting aggressive growth with a tolerance for premium pricing.
F5’s strategic moat centers on its steady recurring revenue and conservative balance sheet, offering a safer harbor amid market volatility. While growth is slower than Fortinet’s, its more reasonable valuation and stronger liquidity make it appealing for investors prioritizing stability and reasonable growth. It fits well within GARP (Growth at a Reasonable Price) portfolios.
If you prioritize high-growth leadership and are comfortable with valuation risk, Fortinet outshines due to its robust ROIC and cash generation. However, if you seek a blend of growth and greater financial stability, F5 offers better risk-adjusted stability and a more attractive entry point. Each presents a distinct analytical scenario aligned with differing investor risk appetites.
Disclaimer: Investment carries a risk of loss of initial capital. The past performance is not a reliable indicator of future results. Be sure to understand risks before making an investment decision.
Go Further
I encourage you to read the complete analyses of Fortinet, Inc. and F5, Inc. to enhance your investment decisions: