Home > Comparison > Industrials > UPS vs EXPD
The strategic rivalry between United Parcel Service, Inc. (UPS) and Expeditors International of Washington, Inc. shapes the dynamics of the integrated freight and logistics sector. UPS operates as a capital-intensive global delivery powerhouse with a vast fleet and comprehensive services. In contrast, Expeditors leverages an asset-light, high-margin model focused on freight consolidation and supply chain optimization. This analysis evaluates which corporate strategy offers superior risk-adjusted returns for a diversified portfolio.
Table of contents
Companies Overview
United Parcel Service and Expeditors International anchor the integrated freight and logistics sector with distinct global footprints.
United Parcel Service, Inc.: Global Package Delivery Powerhouse
United Parcel Service dominates as a leading parcel delivery and logistics operator. It generates revenue chiefly through U.S. domestic and international package delivery services. In 2026, UPS emphasizes expanding its time-definite express delivery and supply chain solutions across 200 countries, leveraging a vast fleet and container assets.
Expeditors International of Washington, Inc.: Specialized Logistics and Freight Consolidator
Expeditors International excels as a logistics service provider focused on freight consolidation and supply chain optimization. Its core revenue comes from air and ocean freight forwarding, customs brokerage, and warehousing. The company’s 2026 strategy centers on enhancing trade compliance, cargo security, and specialized transit services in key global markets.
Strategic Collision: Similarities & Divergences
UPS and Expeditors both operate in integrated logistics but differ sharply in approach. UPS pursues a broad, asset-heavy model with extensive delivery infrastructure. Expeditors favors an asset-light, service-focused model emphasizing freight consolidation and compliance solutions. Their primary battleground is global supply chain efficiency. UPS offers scale and reach; Expeditors delivers specialized agility and tailored solutions.
Income Statement Comparison
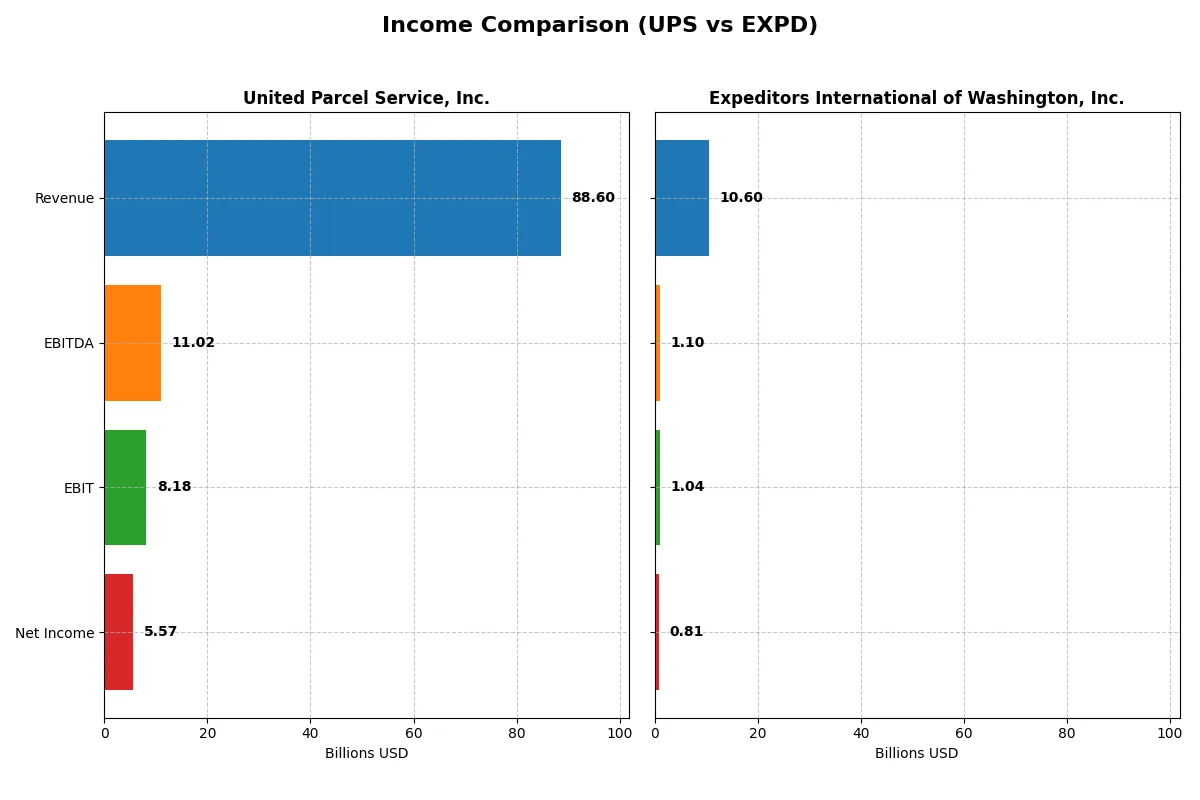
This data dissects the core profitability and scalability of both corporate engines to reveal who dominates the bottom line:
| Metric | United Parcel Service, Inc. (UPS) | Expeditors International of Washington, Inc. (EXPD) |
|---|---|---|
| Revenue | 88.6B | 10.6B |
| Cost of Revenue | 53.2B | 9.25B |
| Operating Expenses | 27.5B | 308M |
| Gross Profit | 35.4B | 1.35B |
| EBITDA | 11.0B | 1.10B |
| EBIT | 8.18B | 1.04B |
| Interest Expense | 1.02B | 0 |
| Net Income | 5.57B | 810M |
| EPS | 6.57 | 5.75 |
| Fiscal Year | 2025 | 2024 |
Income Statement Analysis: The Bottom-Line Duel
This income statement comparison will expose which company operates with greater efficiency and stronger profit momentum in their core business.
United Parcel Service, Inc. Analysis
UPS’s revenue declined from 100B in 2022 to 88.6B in 2025, signaling top-line contraction. Net income halved from 11.5B in 2022 to 5.57B in 2025. Gross margin improved to a favorable 39.9%, yet net margin fell to 6.3%, reflecting rising expenses and weaker bottom-line momentum in 2025.
Expeditors International of Washington, Inc. Analysis
Expeditors grew revenue steadily, reaching 10.6B in 2024, up from 9.3B in 2023. Net income increased to 810M in 2024 from 753M the prior year. Margins remain healthy with a stable gross margin near 12.7% and a net margin at 7.6%, showing consistent efficiency and positive earnings momentum.
Margin Resilience vs. Growth Consistency
UPS displays stronger gross margins but faces declining revenues and net income, indicating margin pressure and profit erosion. Expeditors maintains moderate margins with sustained revenue and net income growth. For investors, Expeditors’ consistent earnings expansion offers a more attractive profile compared to UPS’s margin volatility and shrinking profitability.
Financial Ratios Comparison
These vital ratios act as a diagnostic tool to expose the underlying fiscal health, valuation premiums, and capital efficiency of the companies compared below:
| Ratios | United Parcel Service, Inc. (UPS) | Expeditors International of Washington, Inc. (EXPD) |
|---|---|---|
| ROE | 34.3% | 36.4% |
| ROIC | 10.4% | 27.6% |
| P/E | 15.1 | 19.3 |
| P/B | 5.19 | 7.03 |
| Current Ratio | 1.22 | 1.77 |
| Quick Ratio | 1.22 | 1.77 |
| D/E | 1.53 | 0.26 |
| Debt-to-Assets | 34.1% | 12.0% |
| Interest Coverage | 7.78 | 0 (not reported) |
| Asset Turnover | 1.21 | 2.23 |
| Fixed Asset Turnover | 2.11 | 10.6 |
| Payout Ratio | 96.9% | 25.2% |
| Dividend Yield | 6.41% | 1.31% |
| Fiscal Year | 2025 | 2024 |
Efficiency & Valuation Duel: The Vital Signs
Ratios act as a company’s DNA, exposing hidden risks and revealing operational excellence that guides investment decisions with clarity.
United Parcel Service, Inc.
UPS delivers a strong ROE of 34.34%, reflecting solid profitability, while its net margin sits at a neutral 6.29%. The P/E ratio of 15.11 suggests a fairly valued stock, though a high P/B at 5.19 signals some premium pricing. UPS rewards shareholders with a 6.41% dividend yield, balancing income with stable capital allocation.
Expeditors International of Washington, Inc.
Expeditors shows robust profitability with a 36.44% ROE and a slightly higher 7.64% net margin. Its P/E of 19.28 marks a more expensive valuation than UPS. Favorable leverage and liquidity ratios underline operational strength. The 1.31% dividend yield reflects a modest payout, possibly supporting growth or operational reinvestment.
Premium Valuation vs. Operational Safety
Expeditors commands a premium valuation with higher profitability and superior capital efficiency, while UPS offers steadier income and balanced risk metrics. Investors seeking growth with operational discipline may lean toward Expeditors. Those prioritizing consistent dividends and moderate valuation might find UPS a better fit.
Which one offers the Superior Shareholder Reward?
I compare United Parcel Service, Inc. (UPS) and Expeditors International of Washington, Inc. (EXPD) on their shareholder reward strategies. UPS pays a high dividend yield of 6.41% in 2025 but with a payout ratio near 97%, risking sustainability. Its free cash flow covers dividends only modestly at 0.56x. UPS also aggressively repurchases shares, supporting total returns but carries substantial leverage (debt-to-equity 1.53). EXPD yields a modest 1.31% dividend with a conservative 25% payout ratio, fully covered by free cash flow at 0.94x, and maintains a pristine balance sheet with minimal debt (debt-to-equity 0.26). EXPD’s smaller but steady buyback program complements its distribution. Historically in logistics, strong dividend coverage and low leverage signal durability. I find EXPD’s balanced approach to dividends and buybacks more sustainable, offering a superior long-term total return profile in 2026 compared to UPS’s high-yield but riskier payout model.
Comparative Score Analysis: The Strategic Profile
The radar chart reveals the fundamental DNA and trade-offs of United Parcel Service, Inc. and Expeditors International of Washington, Inc.:
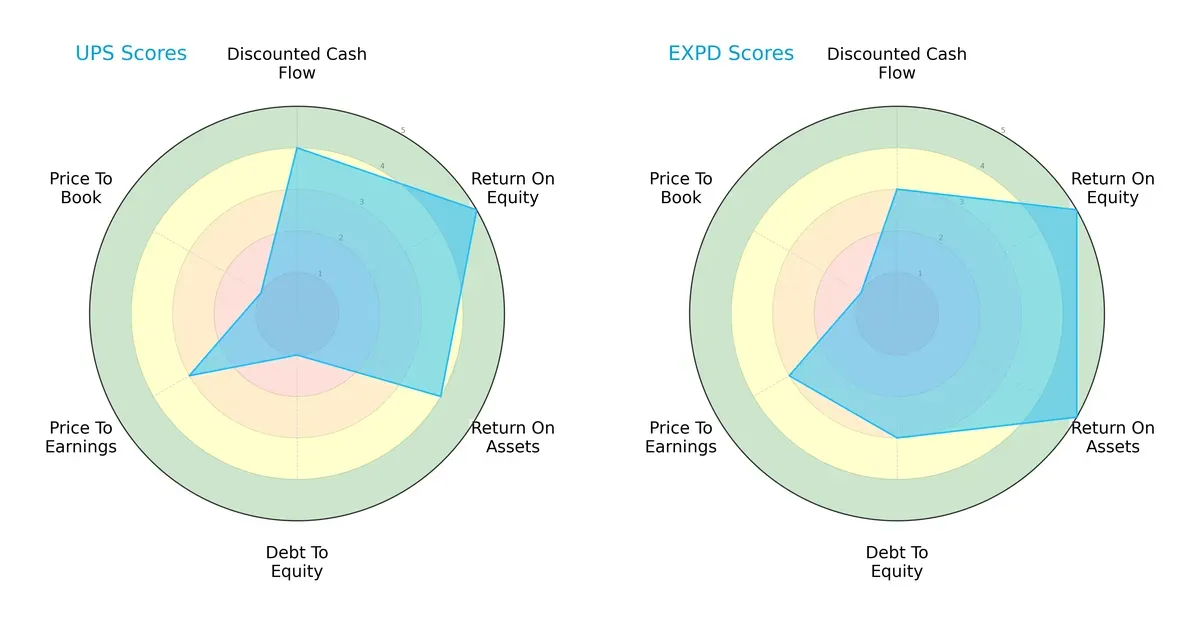
UPS shows strength in discounted cash flow and return on equity but struggles with debt-to-equity and price-to-book ratios. Expeditors balances strong operational returns with a healthier debt position, though its DCF score is moderate. I see Expeditors as having a more balanced profile, while UPS relies heavily on its profitability edge.
Bankruptcy Risk: Solvency Showdown
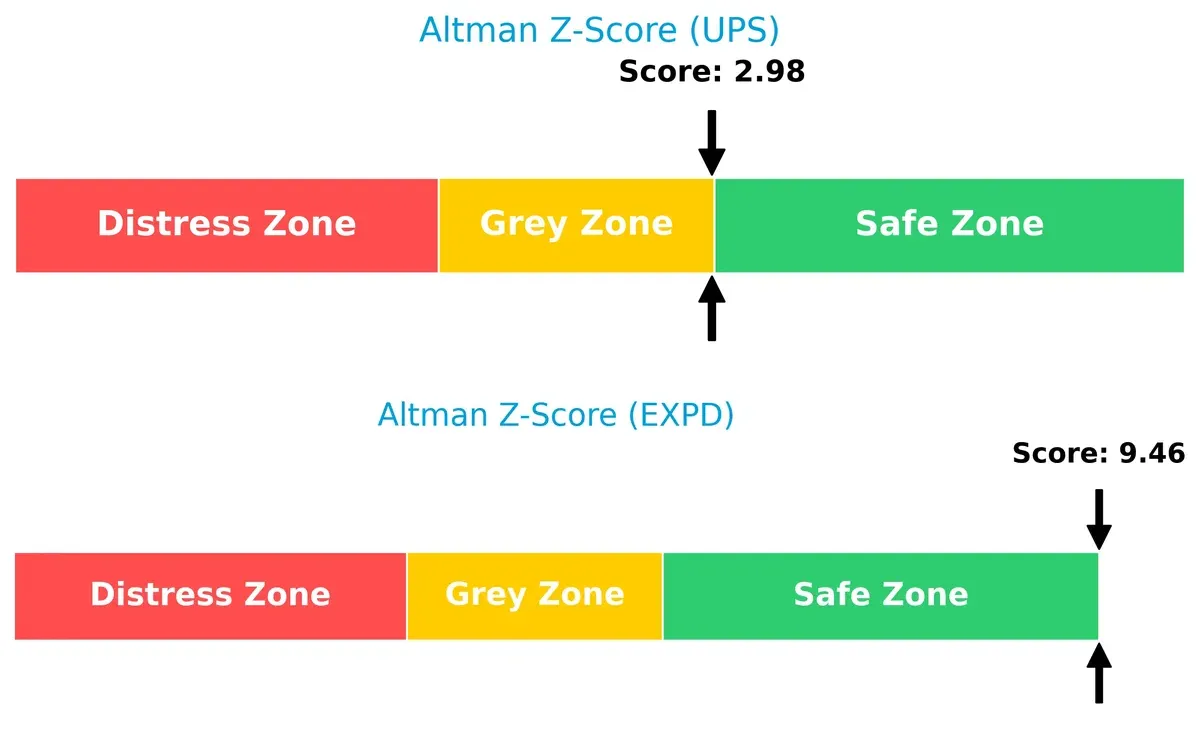
Expeditors’ Altman Z-Score of 9.46 versus UPS’s 2.98 signals a stark difference in bankruptcy risk: Expeditors is solidly in the safe zone, while UPS hovers in the grey zone, implying elevated financial vulnerability in downturns.
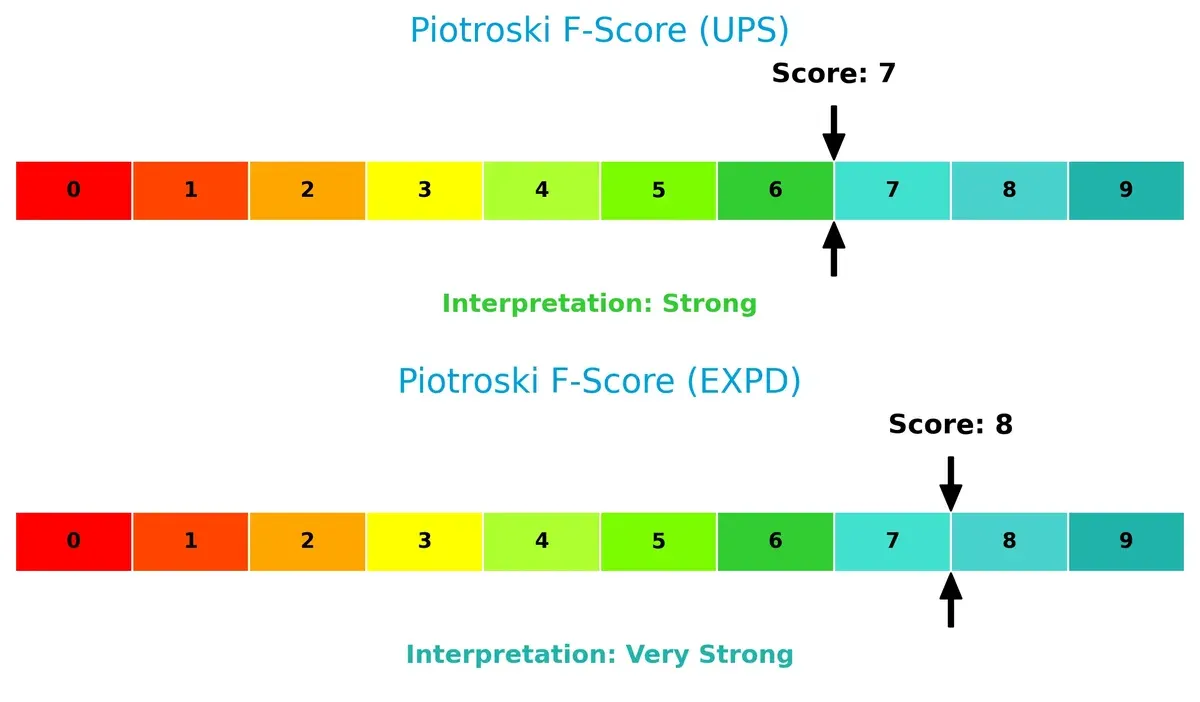
Financial Health: Quality of Operations
Expeditors scores an 8, edging UPS’s 7 on the Piotroski F-Score scale: this indicates Expeditors enjoys very strong financial health, while UPS remains strong but with slightly less robustness in operational quality.
How are the two companies positioned?
This section dissects UPS and EXPD’s operational DNA by comparing revenue distribution and internal strengths and weaknesses. The goal is to confront their economic moats and identify the more resilient, sustainable advantage in today’s market.
Revenue Segmentation: The Strategic Mix
This comparison dissects how United Parcel Service and Expeditors International diversify their income streams and reveals their primary sector bets:
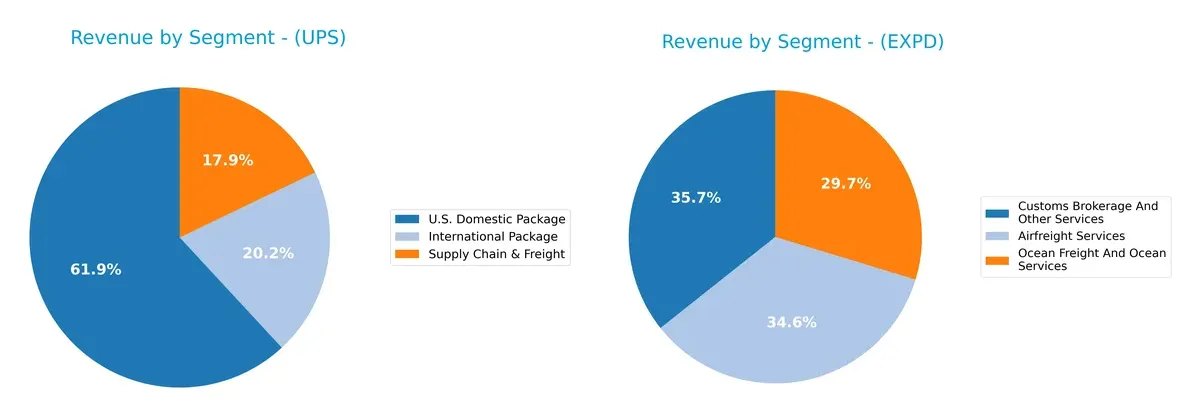
United Parcel Service anchors its revenue in the U.S. Domestic Package segment, generating $40.8B in 2017, dwarfing its International Package ($13.3B) and Supply Chain & Freight ($11.8B). This concentration highlights a strong domestic infrastructure moat but risks reliance on U.S. market dynamics. Expeditors International, by contrast, pivots evenly among Airfreight ($3.7B), Customs Brokerage ($3.8B), and Ocean Freight ($3.1B) in 2024, showcasing a balanced, diversified model that mitigates segment-specific risks and leverages global logistics expertise.
Strengths and Weaknesses Comparison
This table compares the strengths and weaknesses of UPS and Expeditors International based on diversification, profitability, financial health, innovation, global presence, and market share:
UPS Strengths
- Diversified revenue streams across U.S. Domestic, International, and Supply Chain & Freight
- Favorable ROE at 34.34% and ROIC at 10.44%
- Strong asset turnover of 1.21 supports operational efficiency
- Global presence with significant U.S. and International sales
- Neutral to favorable liquidity ratios with quick ratio at 1.22
- Market share leadership in U.S. Domestic Package segment
EXPD Strengths
- High profitability with ROE of 36.44% and superior ROIC of 27.62%
- Favorable debt metrics with low DE at 0.26 and debt-to-assets at 11.97%
- Excellent asset turnover at 2.23 and fixed asset turnover at 10.59
- Favorable liquidity ratios with current and quick ratio at 1.77
- Broad global footprint across Europe, North Asia, South Asia, and Americas
- Innovation in diversified freight and customs brokerage services
UPS Weaknesses
- Unfavorable price-to-book ratio at 5.19 indicates potential overvaluation
- Debt-to-equity ratio of 1.53 signals higher leverage risk
- Neutral net margin of 6.29% lower than Expeditors
- Slightly lower global ratio favorability at 42.86%
- Dividend yield at 6.41% may limit reinvestment capacity
EXPD Weaknesses
- Higher price-to-earnings ratio at 19.28 compared to UPS
- Neutral net margin at 7.64% despite strong ROIC
- Neutral WACC at 9% higher than UPS’s favorable 7.39%
- Lower dividend yield at 1.31% may not attract income-focused investors
UPS demonstrates a robust diversification and solid profitability with moderate leverage, while Expeditors excels in operational efficiency and conservative financial structure. Each company’s weaknesses highlight areas for strategic focus in valuation and margin improvement.
The Moat Duel: Analyzing Competitive Defensibility
A structural moat alone shields long-term profits from relentless competitive erosion in logistics companies. Let’s dissect how UPS and Expeditors build and defend their economic moats:
United Parcel Service, Inc. (UPS): Scale and Network Effects Moat
UPS leverages massive scale and a global delivery network, driving stable margins and a 3% ROIC premium over WACC despite a declining trend. Its vast U.S. and international footprint supports resilience but faces margin pressure in 2026.
Expeditors International of Washington, Inc. (EXPD): Service Differentiation and Operational Excellence
Expeditors capitalizes on operational efficiency and tailored logistics solutions, boasting an 18.6% ROIC premium over WACC with a rising trend. Unlike UPS, Expeditors grows both revenue and profitability, strengthening its moat into new global markets.
Scale Dominance vs. Operational Precision: The Moat Verdict
Expeditors shows a wider, deeper moat with growing returns and robust income growth. UPS creates value through scale but struggles with shrinking profitability. Expeditors is better positioned to defend and expand market share in 2026.
Which stock offers better returns?
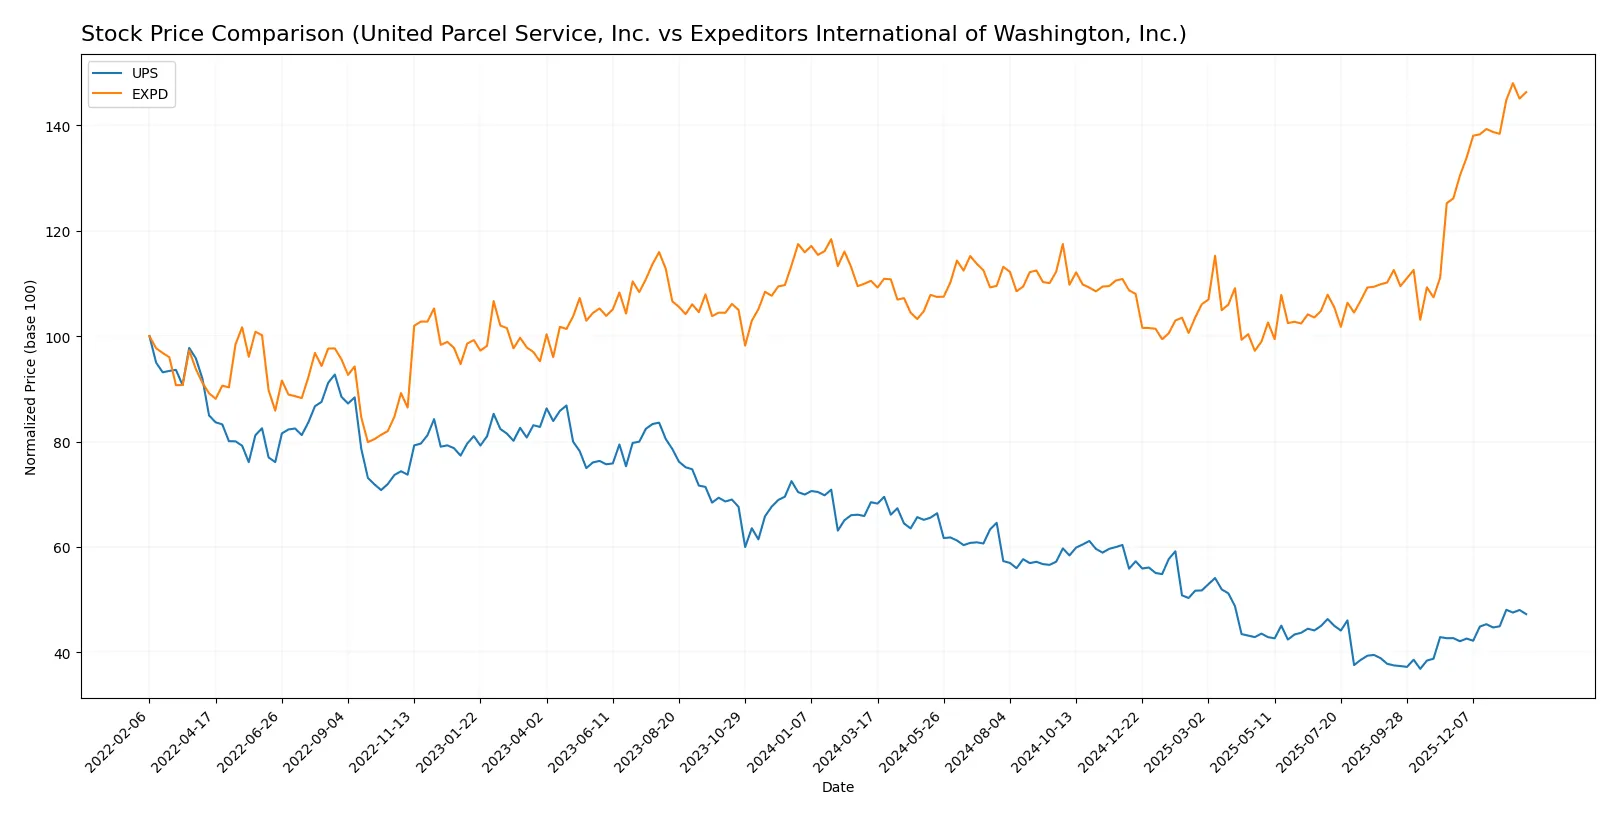
Over the past 12 months, United Parcel Service, Inc. (UPS) experienced a sharp decline with recent signs of recovery, while Expeditors International of Washington, Inc. (EXPD) showed sustained gains accelerating in the last quarter.
Trend Comparison
UPS’s stock price fell 31.01% over the past year, marking a bearish trend with accelerating decline. It fluctuated between $82.87 and $156.27, showing high volatility (std dev 20.85).
EXPD’s stock price rose 32.39% over the same period, indicating a bullish trend with accelerating gains. Prices ranged from $106.70 to $162.41, with moderate volatility (std dev 12.4).
EXPD outperformed UPS with a strong positive trend and higher recent gains, delivering superior market returns over the past 12 months.
Target Prices
Analysts present a solid target price consensus for United Parcel Service, Inc. and Expeditors International of Washington, Inc.
| Company | Target Low | Target High | Consensus |
|---|---|---|---|
| United Parcel Service, Inc. | 85 | 128 | 110.6 |
| Expeditors International of Washington, Inc. | 95 | 160 | 139.13 |
The consensus targets imply moderate upside for UPS, trading near $106, while EXPD’s consensus suggests a slight pullback from its $160.54 current price. Analysts expect both stocks to perform within reasonable ranges.

Don’t Let Luck Decide Your Entry Point
Optimize your entry points with our advanced ProRealTime indicators. You’ll get efficient buy signals with precise price targets for maximum performance. Start outperforming now!
How do institutions grade them?
The following tables summarize recent institutional grades for United Parcel Service, Inc. and Expeditors International of Washington, Inc.:
United Parcel Service, Inc. Grades
This table shows the latest grades issued by recognized financial institutions for UPS.
| Grading Company | Action | New Grade | Date |
|---|---|---|---|
| Stephens & Co. | Maintain | Equal Weight | 2026-01-28 |
| Jefferies | Maintain | Buy | 2026-01-28 |
| Oppenheimer | Maintain | Outperform | 2026-01-28 |
| Truist Securities | Maintain | Buy | 2026-01-28 |
| UBS | Maintain | Buy | 2026-01-28 |
| Wells Fargo | Maintain | Equal Weight | 2026-01-28 |
| Citigroup | Maintain | Buy | 2026-01-28 |
| JP Morgan | Maintain | Neutral | 2026-01-28 |
| Stifel | Maintain | Buy | 2026-01-28 |
| Deutsche Bank | Maintain | Hold | 2026-01-28 |
Expeditors International of Washington, Inc. Grades
This table provides the latest grades from leading financial firms for Expeditors International.
| Grading Company | Action | New Grade | Date |
|---|---|---|---|
| Truist Securities | Maintain | Hold | 2026-01-15 |
| Barclays | Maintain | Underweight | 2026-01-15 |
| JP Morgan | Maintain | Underweight | 2026-01-12 |
| Stifel | Maintain | Hold | 2025-12-16 |
| Morgan Stanley | Maintain | Underweight | 2025-12-08 |
| UBS | Upgrade | Buy | 2025-11-17 |
| Stifel | Maintain | Hold | 2025-11-06 |
| TD Cowen | Maintain | Sell | 2025-11-05 |
| JP Morgan | Maintain | Underweight | 2025-11-05 |
| Truist Securities | Maintain | Hold | 2025-11-05 |
Which company has the best grades?
UPS consistently receives Buy or Outperform ratings from multiple top-tier firms, indicating stronger institutional confidence. Expeditors International shows a more mixed profile with several Underweight and Hold grades, potentially signaling greater investor caution. This divergence may influence portfolio risk profiles differently.
Risks specific to each company
The following categories identify critical pressure points and systemic threats facing United Parcel Service, Inc. and Expeditors International of Washington, Inc. in the 2026 market environment:
1. Market & Competition
United Parcel Service, Inc.
- Faces intense competition from global logistics and e-commerce firms, requiring continuous innovation and cost management.
Expeditors International of Washington, Inc.
- Operates in niche logistics segments with focus on consulting and optimization, but faces competition from larger integrators.
2. Capital Structure & Debt
United Parcel Service, Inc.
- High debt-to-equity ratio (1.53) signals leverage risk; interest coverage is strong but debt level remains a red flag.
Expeditors International of Washington, Inc.
- Low debt-to-equity ratio (0.26) offers financial flexibility and lower risk; interest coverage is effectively infinite.
3. Stock Volatility
United Parcel Service, Inc.
- Beta of 1.097 suggests moderate sensitivity to market swings, aligned with industrial sector norms.
Expeditors International of Washington, Inc.
- Slightly higher beta (1.136) indicates marginally greater stock price volatility but still within reasonable bounds.
4. Regulatory & Legal
United Parcel Service, Inc.
- Subject to complex international shipping regulations and trade policies, increasing compliance costs and legal exposure.
Expeditors International of Washington, Inc.
- Also highly exposed to customs and trade regulations globally, with risks heightened by frequent cross-border operations.
5. Supply Chain & Operations
United Parcel Service, Inc.
- Large asset base and fleet require efficient management; supply chain disruptions can severely impact delivery reliability.
Expeditors International of Washington, Inc.
- Relies on third-party carriers and agents, which may limit operational control but reduces capital intensity.
6. ESG & Climate Transition
United Parcel Service, Inc.
- Pressure to reduce carbon footprint in fleet and facilities amid rising ESG investor demands and regulatory shifts.
Expeditors International of Washington, Inc.
- Focuses on optimized routing and reduced emissions through consulting, but faces indirect ESG risks from partners.
7. Geopolitical Exposure
United Parcel Service, Inc.
- Extensive global footprint exposes UPS to geopolitical instability, tariffs, and trade tensions in key markets.
Expeditors International of Washington, Inc.
- Also globally diversified, but smaller scale may allow faster adaptation to geopolitical shifts.
Which company shows a better risk-adjusted profile?
Expeditors International demonstrates a stronger risk-adjusted profile, primarily due to its conservative capital structure and superior financial stability. UPS’s high leverage remains its biggest vulnerability. The robust Altman Z-Score and Piotroski Score for Expeditors confirm its safer financial footing. Meanwhile, UPS’s debt levels and less flexible balance sheet amplify its risk, despite operational scale advantages.
Final Verdict: Which stock to choose?
United Parcel Service, Inc. (UPS) wields a superpower in its efficient capital deployment, evidenced by a solid ROIC exceeding its WACC. However, its declining profitability trend and elevated leverage remain points of vigilance. UPS aligns with portfolios favoring steady dividend income and moderate risk tolerance.
Expeditors International of Washington, Inc. (EXPD) boasts a strategic moat through its superior return on invested capital and robust balance sheet, reflecting a durable competitive advantage. Its financial stability surpasses UPS, making it suitable for growth-oriented investors seeking a blend of resilience and expansion potential.
If you prioritize income generation and established operational efficiency, UPS is the compelling choice due to its strong capital returns despite some weakening trends. However, if you seek growth with better stability and a durable moat, EXPD offers superior profitability and balance sheet strength that outshines its peer.
Disclaimer: Investment carries a risk of loss of initial capital. The past performance is not a reliable indicator of future results. Be sure to understand risks before making an investment decision.
Go Further
I encourage you to read the complete analyses of United Parcel Service, Inc. and Expeditors International of Washington, Inc. to enhance your investment decisions: