Home > Comparison > Industrials > EXPD vs JBHT
The strategic rivalry between Expeditors International of Washington, Inc. and J.B. Hunt Transport Services, Inc. shapes the competitive landscape of the Industrials sector. Expeditors excels as a global logistics integrator emphasizing air, ocean, and customs services. In contrast, J.B. Hunt commands North American surface transportation with a vast owned fleet. This analysis pits global logistics breadth against fleet-based scale to determine which offers superior risk-adjusted growth for a diversified portfolio.
Table of contents
Companies Overview
Expeditors International and J.B. Hunt lead the North American freight logistics landscape with distinct operational strengths.
Expeditors International of Washington, Inc.: Global Logistics Specialist
Expeditors International dominates the integrated freight and logistics sector by offering comprehensive air, ocean, and ground freight services worldwide. Its core revenue comes from freight consolidation, customs brokerage, and supply chain solutions. In 2026, Expeditors focuses strategically on enhancing trade compliance and cargo security to optimize global supply chains for retail and manufacturing clients.
J.B. Hunt Transport Services, Inc.: Surface Freight Powerhouse
J.B. Hunt controls the North American surface transportation and logistics market through diversified segments like intermodal, dedicated contract services, and final mile delivery. Its revenue engine relies on extensive company-owned fleets and logistics management. The firm’s 2026 strategy emphasizes expanding integrated capacity solutions and digital marketplaces to streamline multimodal transportation services.
Strategic Collision: Similarities & Divergences
Both firms excel in integrated logistics, but Expeditors targets global air and ocean freight while J.B. Hunt focuses on North American surface transport. Their primary battleground is supply chain optimization and customer reach. Expeditors offers a globally diversified, asset-light model; J.B. Hunt delivers a capital-intensive, fleet-heavy approach. These differences shape distinct investment profiles regarding growth potential and capital allocation discipline.
Income Statement Comparison
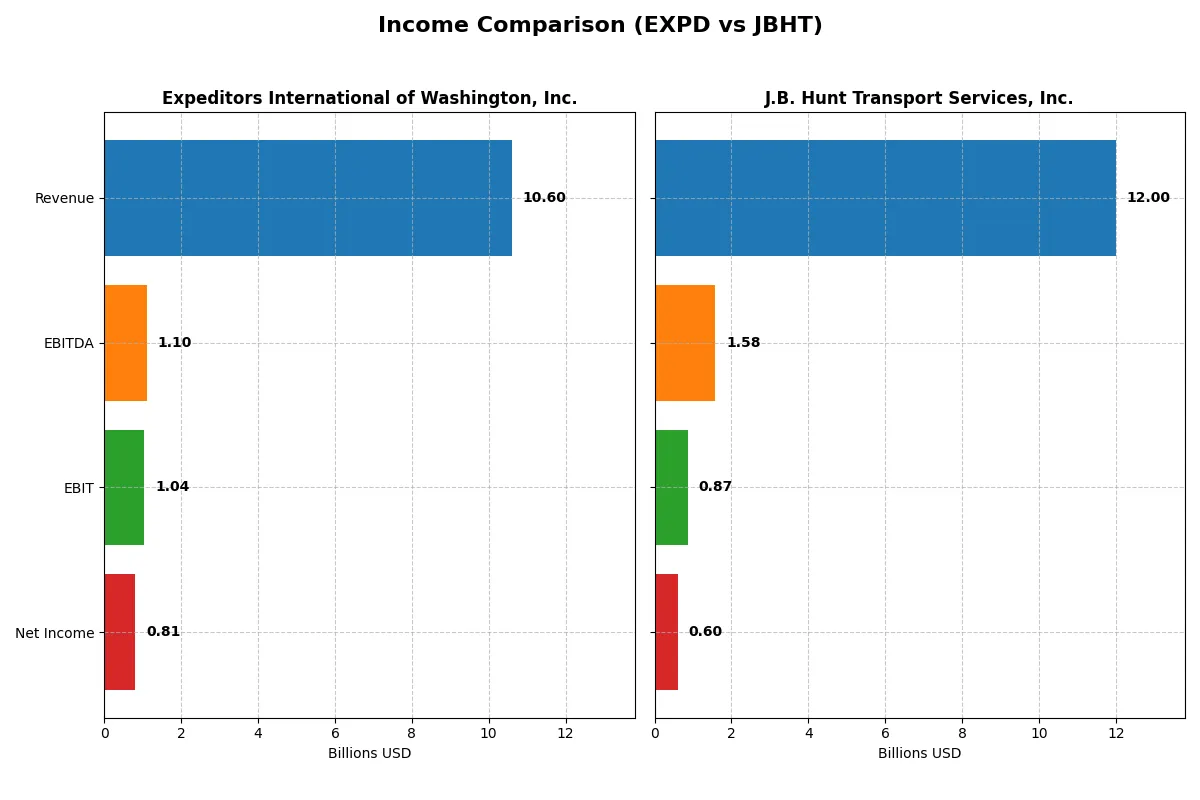
This data dissects the core profitability and scalability of both corporate engines to reveal who dominates the bottom line:
| Metric | Expeditors International of Washington, Inc. (EXPD) | J.B. Hunt Transport Services, Inc. (JBHT) |
|---|---|---|
| Revenue | 10.6B | 12.1B |
| Cost of Revenue | 9.3B | 10.0B |
| Operating Expenses | 308M | 1.23B |
| Gross Profit | 1.35B | 2.06B |
| EBITDA | 1.10B | 1.60B |
| EBIT | 1.04B | 839M |
| Interest Expense | 0 | 79M |
| Net Income | 810M | 571M |
| EPS | 5.75 | 5.60 |
| Fiscal Year | 2024 | 2024 |
Income Statement Analysis: The Bottom-Line Duel
The following income statement comparison exposes the true operational efficiency and profit generation of two logistics giants over recent years.
Expeditors International of Washington, Inc. Analysis
Expeditors shows steady revenue growth, reaching $10.6B in 2024, with net income at $810M. Its gross margin remains stable around 12.7%, and net margin holds a favorable 7.6%. The 2024 figures reveal improved operational efficiency, highlighted by a 14% revenue increase and solid EBIT growth, underscoring strong momentum.
J.B. Hunt Transport Services, Inc. Analysis
J.B. Hunt’s revenue peaked at $12.1B in 2024 but slipped slightly to $12B in 2025. Net income contracted to $598M in 2025, reflecting margin pressures. Gross margin dropped to around 10.5%, with a net margin near 5%. Despite a modest EBIT rise in 2025, recent declines in revenue and profitability signal headwinds.
Margin Consistency vs. Revenue Volatility
Expeditors outperforms J.B. Hunt in margin stability and net income growth, with a more favorable one-year revenue rise of nearly 14%. J.B. Hunt’s declining revenues and shrinking margins position it behind in efficiency. For investors prioritizing consistent profitability and operational discipline, Expeditors presents a more compelling financial profile.
Financial Ratios Comparison
These vital ratios act as a diagnostic tool to expose the underlying fiscal health, valuation premiums, and capital efficiency of the companies compared below:
| Ratios | Expeditors International of Washington, Inc. (EXPD) | J.B. Hunt Transport Services, Inc. (JBHT) |
|---|---|---|
| ROE | 36.4% | N/A |
| ROIC | 27.6% | N/A |
| P/E | 19.3 | 31.7 |
| P/B | 7.03 | 0 |
| Current Ratio | 1.77 | 0 |
| Quick Ratio | 1.77 | 0 |
| D/E | 0.26 | 0 |
| Debt-to-Assets | 12.0% | 0 |
| Interest Coverage | 0 | 12.2 |
| Asset Turnover | 2.23 | 0 |
| Fixed Asset Turnover | 10.6 | 0 |
| Payout Ratio | 25.2% | 28.7% |
| Dividend Yield | 1.31% | 0.91% |
| Fiscal Year | 2024 | 2025 |
Efficiency & Valuation Duel: The Vital Signs
Financial ratios act as a company’s DNA, uncovering hidden risks and operational strengths that shape investment decisions.
Expeditors International of Washington, Inc.
Expeditors shows robust profitability with a 36.44% ROE and strong 27.62% ROIC, signaling efficient capital use. Its P/E of 19.28 suggests a fairly valued stock. The company balances growth with a 1.31% dividend yield, reflecting steady shareholder returns without stretching valuation metrics.
J.B. Hunt Transport Services, Inc.
J.B. Hunt reports weaker profitability, with a 4.99% net margin and no reported ROE or ROIC, indicating operational challenges. Its P/E of 31.73 signals an expensive valuation. Dividend yield at 0.91% is modest, while the lack of key liquidity and efficiency metrics raises caution on financial stability.
Robust Profitability vs. Elevated Valuation
Expeditors delivers a stronger balance of profitability and valuation discipline, with favorable efficiency ratios supporting shareholder returns. J.B. Hunt’s stretched valuation and weaker margins increase risk. Investors prioritizing operational safety may prefer Expeditors, while those tolerating risk might consider J.B. Hunt’s growth prospects.
Which one offers the Superior Shareholder Reward?
I see Expeditors International (EXPD) offers a 1.31% dividend yield with a moderate 25% payout ratio, covered comfortably by free cash flow. Its steady buyback program boosts total returns sustainably. J.B. Hunt (JBHT) yields slightly less at 0.91%, with a similar payout ratio but weaker free cash flow coverage and recent buyback softness. Historically, EXPD’s disciplined capital allocation and stronger cash flow margins indicate a more durable shareholder reward in 2026. I favor Expeditors for superior total return prospects due to its balanced dividend and consistent buybacks.
Comparative Score Analysis: The Strategic Profile
The radar chart reveals the fundamental DNA and trade-offs of Expeditors International and J.B. Hunt Transport Services, Inc.:
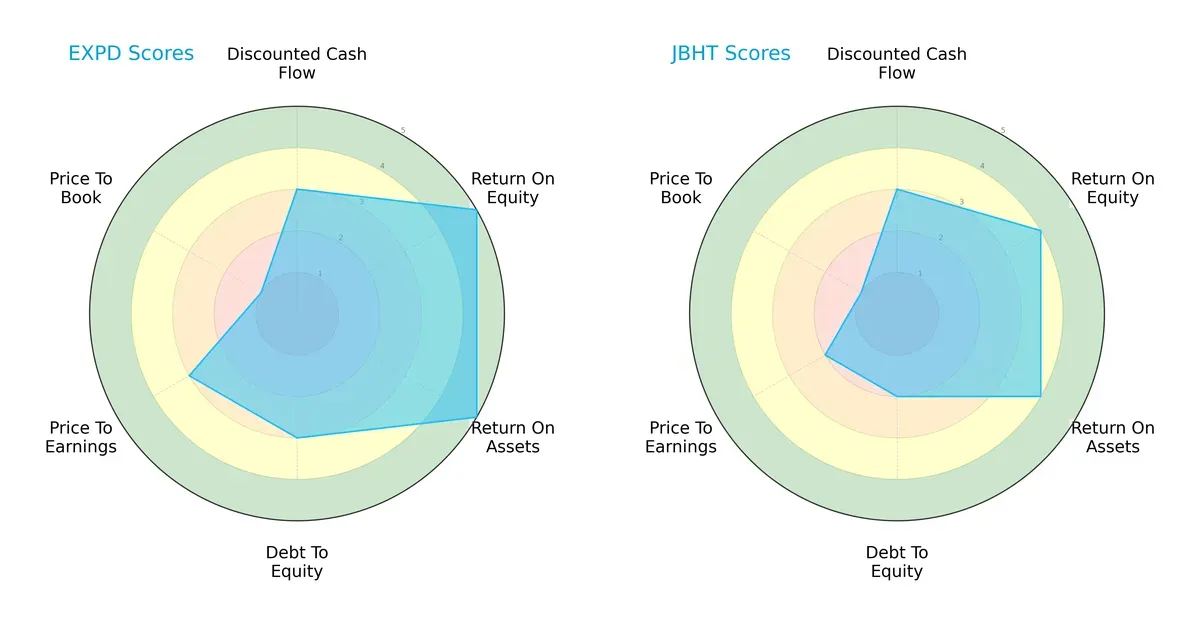
Expeditors shows a more balanced profile with very favorable ROE and ROA scores (5 each), indicating superior profitability and asset efficiency. J.B. Hunt lags slightly with favorable but lower ROE and ROA scores (4 each). Both firms share moderate DCF scores (3), but Expeditors holds an edge with a better debt-to-equity score (3 vs. 2) and P/E ratio (3 vs. 2). Both have weak price-to-book scores (1), signaling potential valuation concerns. Overall, Expeditors leverages operational efficiency, while J.B. Hunt relies more on conservative leverage.
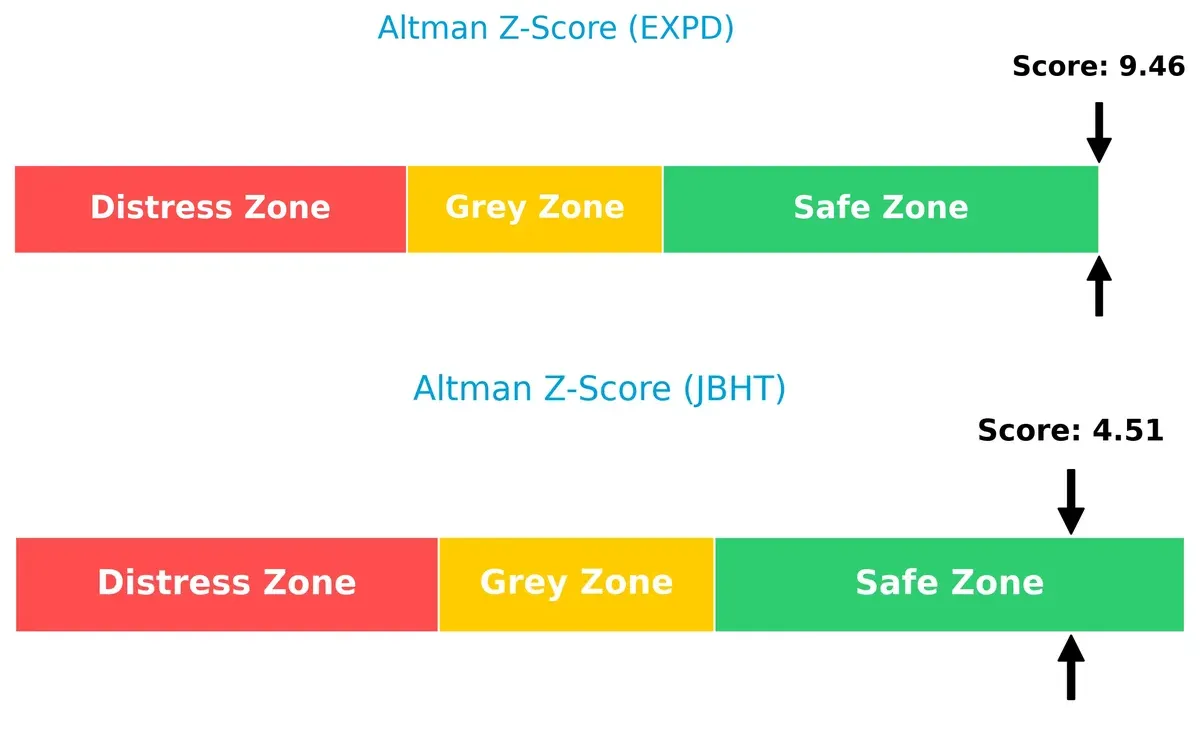
Bankruptcy Risk: Solvency Showdown
Expeditors’ Altman Z-Score of 9.46 surpasses J.B. Hunt’s 4.51, both safely above the distress threshold, signaling robust solvency and low bankruptcy risk in this cycle:
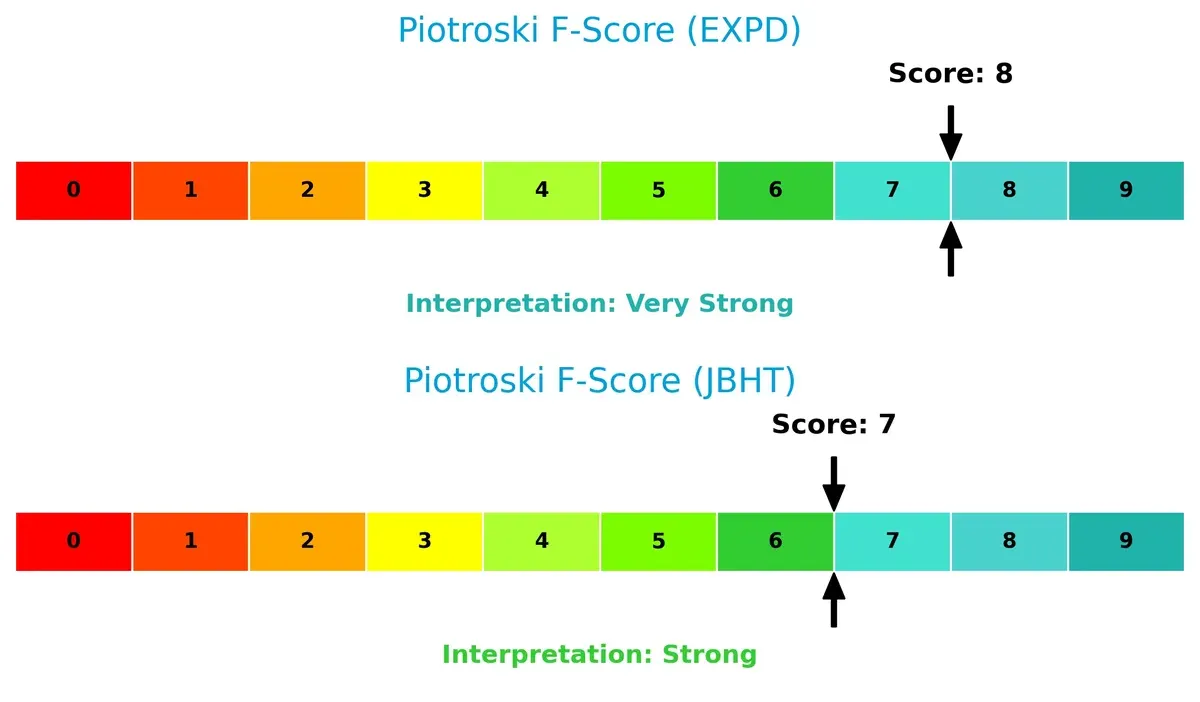
Financial Health: Quality of Operations
Expeditors’ Piotroski F-Score of 8 indicates very strong financial health, outperforming J.B. Hunt’s solid but lower score of 7. This suggests Expeditors maintains higher internal financial discipline and fewer red flags:
How are the two companies positioned?
This section dissects the operational DNA of EXPD and JBHT by comparing their revenue distribution and internal strengths and weaknesses. The goal is to confront their economic moats to determine which model offers the most resilient, sustainable advantage today.
Revenue Segmentation: The Strategic Mix
This visual comparison dissects how Expeditors International and J.B. Hunt diversify income streams and highlights their primary sector bets:
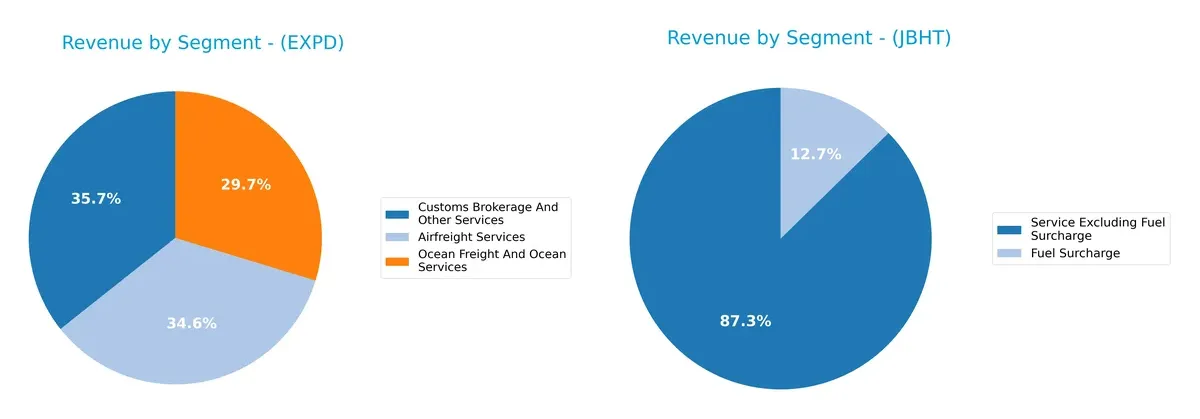
Expeditors International splits revenue relatively evenly among Airfreight (3.7B), Customs Brokerage (3.8B), and Ocean Freight (3.1B) in 2024. This balanced mix anchors its ecosystem lock-in across logistics modes. Conversely, J.B. Hunt’s 2024 revenue pivots heavily on Service Excluding Fuel Surcharge at 10.6B, dwarfing its Fuel Surcharge of 1.5B. J.B. Hunt’s concentration indicates potential exposure to fuel price volatility but reflects infrastructure dominance in freight services.
Strengths and Weaknesses Comparison
This table compares the strengths and weaknesses of Expeditors International of Washington, Inc. and J.B. Hunt Transport Services, Inc.:
Expeditors Strengths
- Diversified revenue streams across airfreight, ocean freight, and customs brokerage
- Strong global presence in North America, Europe, Asia, and Latin America
- High profitability with ROE 36.44% and ROIC 27.62%
- Favorable liquidity ratios with current and quick ratios at 1.77
- Low leverage with debt-to-assets at 11.97%
- High asset turnover indicating efficient use of assets
J.B. Hunt Strengths
- Favorable debt metrics with zero debt-to-assets and debt-to-equity ratios
- Strong interest coverage ratio at 12.19 indicating debt service capability
- Presence in multiple service segments including fuel surcharge and other services
- Large service revenue base excluding fuel surcharge at $10.6B
- Favorable price-to-book ratio at 0, suggesting undervaluation
Expeditors Weaknesses
- Price-to-book ratio at 7.03 is unfavorable, indicating possible overvaluation
- Net margin is only neutral at 7.64%, below top logistics peers
- Limited recent growth in some segments compared to historical peaks
- Dividend yield at 1.31% is neutral, offering moderate income
J.B. Hunt Weaknesses
- Zero reported ROE and ROIC indicate weak profitability
- Unfavorable net margin at 4.99% compared to sector norms
- Unavailable or zero current and quick ratios raise liquidity concerns
- Low asset turnover suggests inefficient asset use
- High price-to-earnings ratio at 31.73 points to expensive valuation
- Dividend yield at 0.91% is unfavorable
Expeditors demonstrates stronger profitability, global diversification, and financial health. J.B. Hunt’s strengths lie in low leverage and segment diversity but faces significant profitability and liquidity challenges. These contrasts imply different strategic priorities and risk profiles for each company.
The Moat Duel: Analyzing Competitive Defensibility
A structural moat is the only reliable shield protecting long-term profits from relentless competition erosion. Let’s dissect the moats of two logistics giants:
Expeditors International of Washington, Inc.: Operational Excellence with Cost Advantage
Expeditors leverages a cost advantage moat, reflected in a strong 18.6% ROIC exceeding WACC by a wide margin. Margin stability and rising profitability show durable value creation. Expansion into Asia and Europe markets deepens this moat in 2026.
J.B. Hunt Transport Services, Inc.: Asset-Heavy Scale with Fragmented Advantage
J.B. Hunt relies on scale and asset ownership but suffers declining ROIC and shrinking margins. Unlike Expeditors, its competitive edge weakens amid revenue contraction. Future growth depends on innovation in intermodal and dedicated services to reclaim ground.
Cost Leadership vs. Scale Complexity in Logistics
Expeditors possesses a deeper, more durable moat with growing ROIC and consistent value creation. J.B. Hunt’s asset-heavy model faces margin pressure and declining returns, leaving Expeditors better equipped to defend market share.
Which stock offers better returns?
Over the past year, Expeditors International showed strong price appreciation with accelerating momentum, while J.B. Hunt posted modest gains despite higher volatility and a recent price surge.
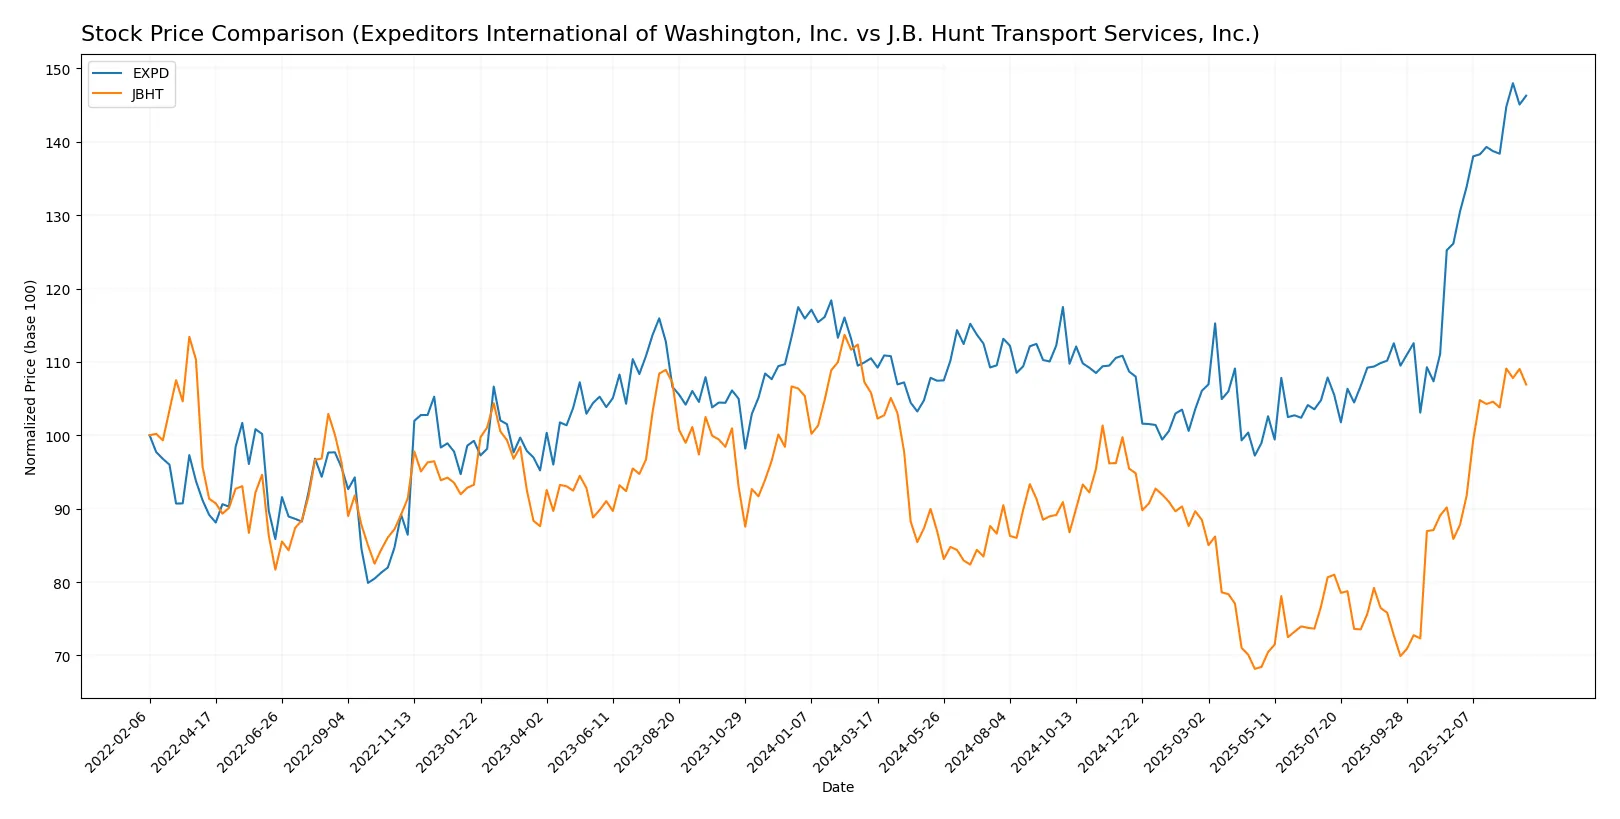
Trend Comparison
Expeditors International’s stock rose 32.39% over 12 months, reflecting a bullish trend with acceleration and a standard deviation of 12.4. It hit a high of 162.41 and a low of 106.7.
J.B. Hunt’s stock increased 1.06% over the same period, marking a neutral trend with acceleration. Volatility was higher at 20.04, with a peak price of 206.85 and a trough of 129.23.
Expeditors International outperformed J.B. Hunt in market returns, delivering the highest overall price increase and a stronger bullish momentum.
Target Prices
Analysts present a positive outlook with solid upside potential for both Expeditors International and J.B. Hunt Transport.
| Company | Target Low | Target High | Consensus |
|---|---|---|---|
| Expeditors International of Washington, Inc. | 95 | 160 | 139.13 |
| J.B. Hunt Transport Services, Inc. | 150 | 240 | 195 |
Expeditors trades slightly above its consensus target, signaling possible short-term resistance. J.B. Hunt’s target consensus sits below the current price, suggesting limited near-term upside.

Don’t Let Luck Decide Your Entry Point
Optimize your entry points with our advanced ProRealTime indicators. You’ll get efficient buy signals with precise price targets for maximum performance. Start outperforming now!
How do institutions grade them?
Here is a comparison of recent institutional grades for Expeditors International of Washington, Inc. and J.B. Hunt Transport Services, Inc.:
Expeditors International of Washington, Inc. Grades
The following table summarizes the latest grades from reputable financial institutions for Expeditors International of Washington:
| Grading Company | Action | New Grade | Date |
|---|---|---|---|
| Truist Securities | Maintain | Hold | 2026-01-15 |
| Barclays | Maintain | Underweight | 2026-01-15 |
| JP Morgan | Maintain | Underweight | 2026-01-12 |
| Stifel | Maintain | Hold | 2025-12-16 |
| Morgan Stanley | Maintain | Underweight | 2025-12-08 |
| UBS | Upgrade | Buy | 2025-11-17 |
| Stifel | Maintain | Hold | 2025-11-06 |
| TD Cowen | Maintain | Sell | 2025-11-05 |
| JP Morgan | Maintain | Underweight | 2025-11-05 |
| Truist Securities | Maintain | Hold | 2025-11-05 |
J.B. Hunt Transport Services, Inc. Grades
Below is a table of recent institutional grades for J.B. Hunt Transport Services from verified grading entities:
| Grading Company | Action | New Grade | Date |
|---|---|---|---|
| Benchmark | Maintain | Buy | 2026-01-20 |
| Stifel | Maintain | Hold | 2026-01-16 |
| UBS | Maintain | Neutral | 2026-01-16 |
| Barclays | Maintain | Equal Weight | 2026-01-15 |
| Truist Securities | Maintain | Hold | 2026-01-15 |
| Stifel | Maintain | Hold | 2026-01-14 |
| Evercore ISI Group | Maintain | Outperform | 2026-01-13 |
| JP Morgan | Maintain | Overweight | 2026-01-12 |
| Bernstein | Maintain | Market Perform | 2026-01-09 |
| Citigroup | Downgrade | Neutral | 2026-01-08 |
Which company has the best grades?
J.B. Hunt Transport Services holds generally stronger grades, including Buy and Outperform ratings. Expeditors International mostly receives Hold or Underweight marks. Investors may interpret J.B. Hunt’s higher grades as greater institutional confidence.
Risks specific to each company
The following categories identify the critical pressure points and systemic threats facing both firms in the 2026 market environment:
1. Market & Competition
Expeditors International of Washington, Inc.
- Faces intense global logistics competition; maintains strong brand and diversified services.
J.B. Hunt Transport Services, Inc.
- Competes heavily in North American surface transport; scale and asset-heavy model create operational complexity.
2. Capital Structure & Debt
Expeditors International of Washington, Inc.
- Low debt-to-equity (0.26) and debt-to-assets (11.97%) signal strong balance sheet and low financial risk.
J.B. Hunt Transport Services, Inc.
- Reported zero debt ratios raise questions about data completeness; interest coverage ratio (12.19) suggests manageable debt costs.
3. Stock Volatility
Expeditors International of Washington, Inc.
- Beta of 1.136 indicates moderate volatility, slightly above market but manageable.
J.B. Hunt Transport Services, Inc.
- Higher beta at 1.27 exposes stock to greater market swings and investor sentiment risks.
4. Regulatory & Legal
Expeditors International of Washington, Inc.
- Operates globally, exposing it to complex customs, trade, and compliance regulations.
J.B. Hunt Transport Services, Inc.
- Primarily North American focus reduces global regulatory complexity but faces stringent US transport regulations.
5. Supply Chain & Operations
Expeditors International of Washington, Inc.
- Global logistics network vulnerable to geopolitical disruptions and global supply chain shocks.
J.B. Hunt Transport Services, Inc.
- Asset-heavy trucking and intermodal operations exposed to driver shortages and fuel cost volatility.
6. ESG & Climate Transition
Expeditors International of Washington, Inc.
- Must address carbon footprint across air and ocean freight; pressure to invest in greener technologies.
J.B. Hunt Transport Services, Inc.
- Faces regulatory pressure to decarbonize trucking fleet; investments in alternative fuels critical.
7. Geopolitical Exposure
Expeditors International of Washington, Inc.
- High exposure to geopolitical risks in Asia, Europe, and Middle East affecting trade routes.
J.B. Hunt Transport Services, Inc.
- Limited international exposure reduces geopolitical risk but concentrates exposure to US policy shifts.
Which company shows a better risk-adjusted profile?
Expeditors faces notable geopolitical and regulatory risks but boasts a robust balance sheet and stable financial metrics. J.B. Hunt struggles with higher volatility and weaker profitability ratios, compounded by operational exposure to fuel costs and labor shortages. Expeditors’ superior Altman Z-Score (9.46) and Piotroski Score (8) versus J.B. Hunt’s (4.51 and 7) confirm a stronger risk-adjusted profile. The most impactful risk for Expeditors is geopolitical disruption undermining global supply chains. For J.B. Hunt, operational risks and financial underperformance stand out. Expeditors’ favorable capital structure and efficiency metrics justify my confidence despite global pressures.
Final Verdict: Which stock to choose?
Expeditors International excels as a cash-generating powerhouse with a durable competitive moat, demonstrated by its high ROIC well above WACC. Its efficiency in capital allocation supports strong profitability. The main point of vigilance is its elevated price-to-book ratio, which suggests premium valuation risk. It suits aggressive growth portfolios seeking durable value creation.
J.B. Hunt Transport Services benefits from a strategic moat rooted in recurring revenue streams and solid operational scale. Compared to Expeditors, it offers a relatively safer profile with moderate leverage and steady cash flow, though recent growth challenges temper enthusiasm. It fits well within GARP portfolios focused on stability with measured growth prospects.
If you prioritize long-term value creation and superior capital efficiency, Expeditors outshines as the compelling choice due to its robust moat and strong profitability metrics. However, if you seek a more conservative growth approach with recurring revenue stability, J.B. Hunt offers better stability despite weaker growth signals and margin pressure. Both present distinct analytical scenarios aligned with different investor profiles.
Disclaimer: Investment carries a risk of loss of initial capital. The past performance is not a reliable indicator of future results. Be sure to understand risks before making an investment decision.
Go Further
I encourage you to read the complete analyses of Expeditors International of Washington, Inc. and J.B. Hunt Transport Services, Inc. to enhance your investment decisions: