FedEx Corporation and Expeditors International of Washington, Inc. are two prominent players in the integrated freight and logistics industry. Both companies operate globally, offering comprehensive transportation and supply chain solutions while emphasizing innovation and efficiency. Given their market overlap and strategic approaches, comparing these firms provides valuable insights. In this article, I will help you determine which company presents the most compelling investment opportunity in 2026.
Table of contents
Companies Overview
I will begin the comparison between FedEx Corporation and Expeditors International of Washington, Inc. by providing an overview of these two companies and their main differences.
FedEx Overview
FedEx Corporation operates in the integrated freight and logistics industry, providing transportation, e-commerce, and business services globally. Its segments include express transportation, ground delivery, less-than-truckload freight, and various support services. Founded in 1971 and based in Memphis, Tennessee, FedEx employs approximately 306K full-time workers and is recognized for its extensive vehicle fleet and service centers.
Expeditors International Overview
Expeditors International of Washington, Inc. is a logistics services provider operating across multiple continents, including the Americas, Asia, Europe, and Africa. The company offers air and ocean freight forwarding, customs brokerage, warehousing, and supply chain solutions. Founded in 1979 and headquartered in Seattle, Washington, Expeditors employs about 19K people and focuses on specialized cargo handling and trade compliance.
Key similarities and differences
Both FedEx and Expeditors operate within the integrated freight and logistics sector, offering supply chain and transportation solutions. FedEx has a broader service portfolio with a larger workforce and infrastructure, emphasizing express and ground delivery. In contrast, Expeditors focuses more on global freight forwarding, customs brokerage, and specialized logistics services with a smaller operational scale and workforce.
Income Statement Comparison
The following table compares the key income statement metrics for FedEx Corporation and Expeditors International of Washington, Inc. for their most recent fiscal years.
| Metric | FedEx Corporation (2025) | Expeditors International (2024) |
|---|---|---|
| Market Cap | 73.7B | 21.8B |
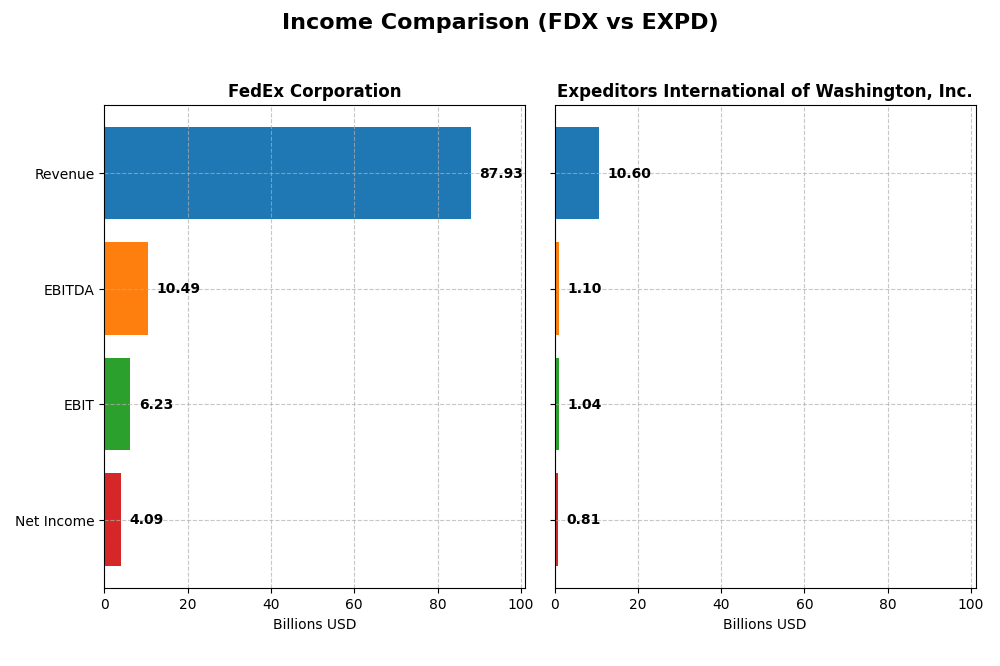
| Revenue | 87.9B | 10.6B |
| EBITDA | 10.5B | 1.10B |
| EBIT | 6.23B | 1.04B |
| Net Income | 4.09B | 810M |
| EPS | 16.96 | 5.75 |
| Fiscal Year | 2025 | 2024 |
Income Statement Interpretations
FedEx Corporation
FedEx’s revenue showed a slight increase of 0.27% in the most recent year, with overall growth of 4.93% from 2021 to 2025. However, net income declined by 21.77% over the period, and net margin fell by 25.45%. Gross margins remained favorable at 21.6%, but EBIT and net margins weakened in 2025, reflecting margin pressure and reduced profitability.
Expeditors International of Washington, Inc.
Expeditors demonstrated stronger revenue growth, rising 13.98% in the last year and 10.6% over the 2020-2024 period. Net income increased by 16.37% overall, with net margin at a favorable 7.64%. EBIT margin remained stable near 9.82%, and despite a slight net margin dip last year, overall earnings per share growth was robust at 40.54%, indicating improved operational efficiency.
Which one has the stronger fundamentals?
Expeditors shows stronger fundamentals with consistent revenue and net income growth, favorable margins, and positive EPS momentum. FedEx, while maintaining higher revenue levels, faces challenges with declining net income and profitability margins. FedEx’s income statement evaluation is largely unfavorable, whereas Expeditors presents a predominantly favorable financial profile, suggesting more resilient earnings performance.
Financial Ratios Comparison
The table below provides a side-by-side comparison of key financial ratios for FedEx Corporation (FDX) and Expeditors International of Washington, Inc. (EXPD) based on their most recent fiscal year data.
| Ratios | FedEx Corporation (FDX) | Expeditors International (EXPD) |
|---|---|---|
| ROE | 14.58% | 36.44% |
| ROIC | 6.00% | 27.62% |
| P/E | 12.95 | 19.28 |
| P/B | 1.89 | 7.03 |
| Current Ratio | 1.19 | 1.77 |
| Quick Ratio | 1.15 | 1.77 |
| D/E (Debt-to-Equity) | 1.33 | 0.26 |
| Debt-to-Assets | 42.70% | 11.97% |
| Interest Coverage | 7.71 | 0 (not reported) |
| Asset Turnover | 1.00 | 2.23 |
| Fixed Asset Turnover | 1.51 | 10.59 |
| Payout Ratio | 32.72% | 25.19% |
| Dividend Yield | 2.53% | 1.31% |
Interpretation of the Ratios
FedEx Corporation
FedEx displays a mix of strong and weak ratios, with a slightly favorable overall assessment. Its net margin is relatively low at 4.65%, flagged as unfavorable, while return on equity and invested capital are neutral. The company has a favorable PE ratio of 12.95 and solid interest coverage. The dividend yield stands at 2.53%, supported by consistent payouts, but debt levels and payout sustainability warrant attention.
Expeditors International of Washington, Inc.
Expeditors shows predominantly favorable ratios, including a strong return on equity of 36.44% and robust return on invested capital at 27.62%. It maintains a conservative debt profile with a debt-to-equity ratio of 0.26 and favorable liquidity ratios. Dividend yield is modest at 1.31%, reflecting a balanced approach to shareholder returns and reinvestment. Overall, financial metrics indicate solid operational efficiency and risk management.
Which one has the best ratios?
Expeditors International presents a more favorable ratio profile overall, with higher profitability, lower leverage, and stronger liquidity than FedEx. FedEx’s slightly favorable rating is tempered by weaker net margin and higher debt levels. While both companies pay dividends, Expeditors’ metrics suggest more operational efficiency and financial strength in comparison.
Strategic Positioning
This section compares the strategic positioning of FedEx and Expeditors International across Market position, Key segments, and Exposure to technological disruption:
FedEx Corporation
- Large market cap of 73.7B with broad integrated freight services facing high competitive pressure.
- Diverse segments: express, ground, freight, services, and international revenue streams.
- Exposure includes cross-border e-commerce, technology solutions, and integrated supply chain services.
Expeditors International of Washington, Inc.
- Smaller 21.8B market cap focused on logistics with moderate competitive pressure.
- Key segments include airfreight, ocean freight, customs brokerage, and supply chain solutions.
- Emphasizes optimization, trade compliance, cargo security, and technology-enabled logistics.
FedEx vs Expeditors Positioning
FedEx pursues a diversified approach with multiple transport and freight segments, offering broad service coverage but facing intense competition. Expeditors concentrates on specialized logistics and customs services, benefiting from a focused business model with tailored solutions.
Which has the best competitive advantage?
Expeditors exhibits a very favorable moat with a growing ROIC above WACC, indicating durable competitive advantage. FedEx shows a very unfavorable moat, with declining ROIC below WACC, pointing to value destruction and weakening profitability.
Stock Comparison
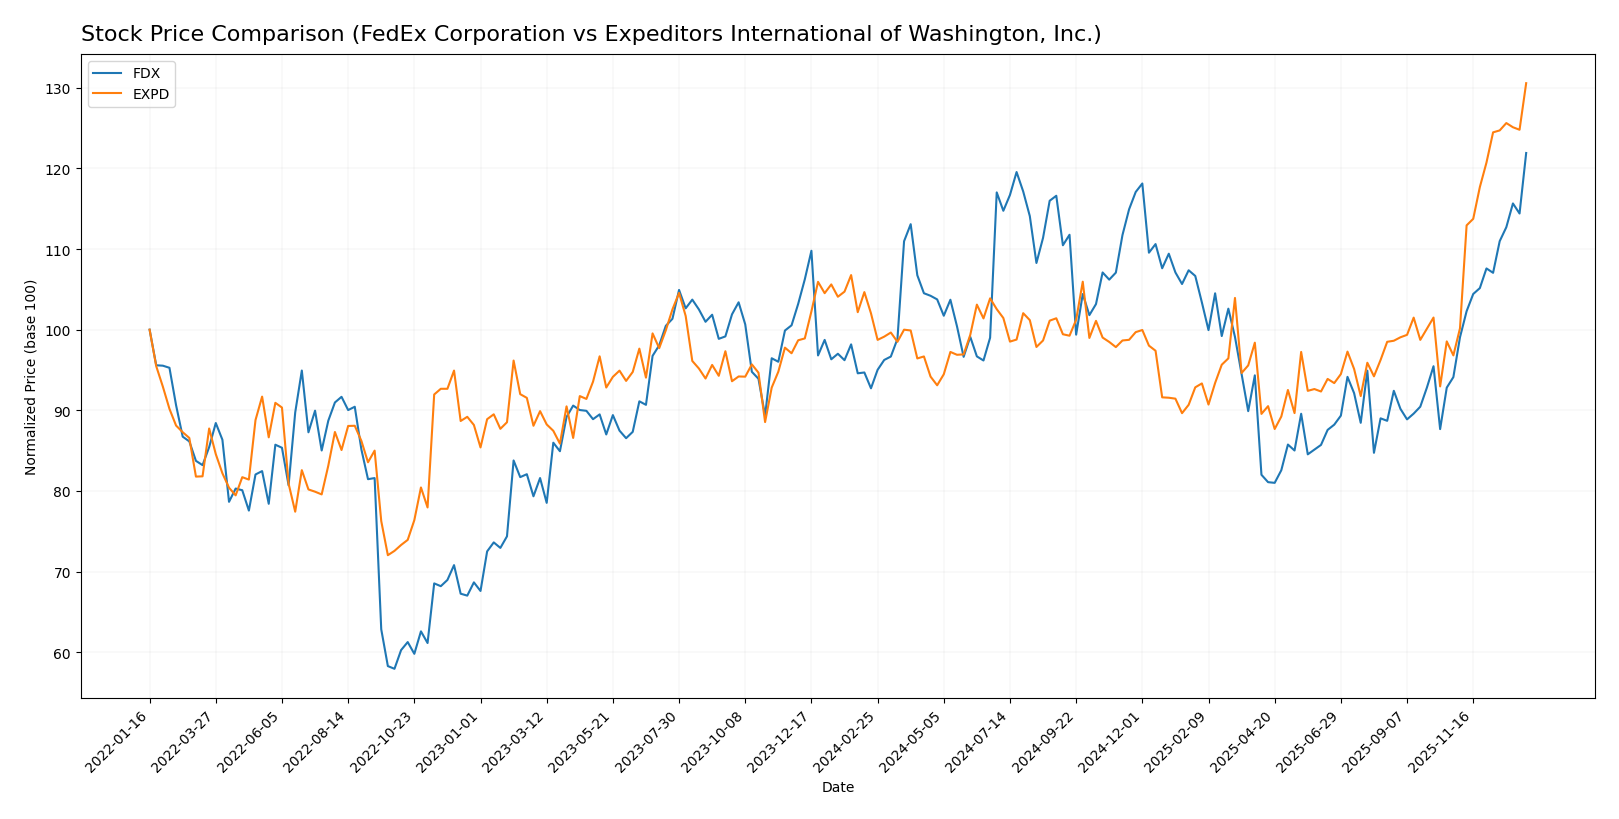
The stock price movements of FedEx Corporation and Expeditors International over the past 12 months reveal strong bullish trends, with notable acceleration phases and distinct trading volumes shaping their market dynamics.
Trend Analysis
FedEx Corporation’s stock shows a 31.47% price increase over the past year, indicating a bullish trend with accelerating momentum. The price ranged between 207.55 and 312.36, with a high volatility reflected by a 26.69 standard deviation.
Expeditors International’s stock rose by 27.97% over the same period, also reflecting a bullish trend with acceleration. Its price fluctuated between 106.7 and 158.89, exhibiting lower volatility with a 10.39 standard deviation.
Comparing both, FedEx delivered the highest market performance with a 31.47% increase versus Expeditors’ 27.97%, supported by stronger recent acceleration and higher volatility.
Target Prices
The target price consensus for FedEx Corporation and Expeditors International of Washington, Inc. reflects cautious optimism from analysts.
| Company | Target High | Target Low | Consensus |
|---|---|---|---|
| FedEx Corporation | 330 | 210 | 287.73 |
| Expeditors International of Washington, Inc. | 157 | 95 | 135.43 |
Analysts expect FedEx’s price to remain slightly below its current level of $312.36, indicating moderate upside potential. Expeditors shows a consensus target below its current price of $158.89, suggesting a cautious outlook.
Analyst Opinions Comparison
This section compares analysts’ ratings and grades for FedEx Corporation (FDX) and Expeditors International of Washington, Inc. (EXPD):
Rating Comparison
FDX Rating
- Rating: C, considered very favorable overall.
- Discounted Cash Flow Score: 3, moderate indication of valuation.
- Return on Equity Score: 1, very unfavorable efficiency in generating profit.
- Return on Assets Score: 1, very unfavorable asset utilization.
- Debt To Equity Score: 1, very unfavorable financial risk from debt levels.
- Overall Score: 2, moderate overall financial standing.
EXPD Rating
- Rating: A-, considered very favorable overall.
- Discounted Cash Flow Score: 3, moderate indication of valuation.
- Return on Equity Score: 5, very favorable efficiency in generating profit.
- Return on Assets Score: 5, very favorable asset utilization.
- Debt To Equity Score: 3, moderate financial risk from debt levels.
- Overall Score: 4, favorable overall financial standing.
Which one is the best rated?
Based on the provided data, EXPD holds a stronger position with an A- rating and higher overall and profitability scores, while FDX’s scores indicate a more moderate and less favorable financial standing.
Scores Comparison
Here is a comparison of the Altman Z-Score and Piotroski Score for FedEx Corporation and Expeditors International of Washington, Inc.:
FedEx Corporation Scores
- Altman Z-Score: 2.69, indicating a grey zone risk level
- Piotroski Score: 7, representing strong financial health
Expeditors International Scores
- Altman Z-Score: 9.33, indicating a safe zone status
- Piotroski Score: 8, representing very strong health
Which company has the best scores?
Based on the provided scores, Expeditors International shows superior financial stability and strength with a safe zone Altman Z-Score and a very strong Piotroski Score, compared to FedEx’s grey zone and strong Piotroski ratings.
Grades Comparison
Here is a comparison of the recent grades assigned to FedEx Corporation and Expeditors International of Washington, Inc.:
FedEx Corporation Grades
The table below summarizes recent grades from major grading companies for FedEx Corporation.
| Grading Company | Action | New Grade | Date |
|---|---|---|---|
| Bernstein | Maintain | Market Perform | 2026-01-09 |
| Truist Securities | Maintain | Buy | 2025-12-19 |
| Jefferies | Maintain | Buy | 2025-12-19 |
| B of A Securities | Maintain | Neutral | 2025-12-19 |
| Wells Fargo | Maintain | Equal Weight | 2025-12-19 |
| Morgan Stanley | Maintain | Underweight | 2025-12-19 |
| JP Morgan | Maintain | Neutral | 2025-12-19 |
| Stifel | Maintain | Buy | 2025-12-19 |
| BMO Capital | Maintain | Market Perform | 2025-12-19 |
| Stephens & Co. | Maintain | Overweight | 2025-12-19 |
FedEx’s grades show a mixed but generally positive trend with multiple “Buy” ratings and a consensus rating of “Buy.”
Expeditors International of Washington, Inc. Grades
The table below presents recent grades from reputable grading companies for Expeditors International.
| Grading Company | Action | New Grade | Date |
|---|---|---|---|
| Stifel | Maintain | Hold | 2025-12-16 |
| Morgan Stanley | Maintain | Underweight | 2025-12-08 |
| UBS | Upgrade | Buy | 2025-11-17 |
| Stifel | Maintain | Hold | 2025-11-06 |
| Truist Securities | Maintain | Hold | 2025-11-05 |
| UBS | Maintain | Neutral | 2025-11-05 |
| JP Morgan | Maintain | Underweight | 2025-11-05 |
| TD Cowen | Maintain | Sell | 2025-11-05 |
| Stifel | Maintain | Hold | 2025-10-10 |
| Barclays | Maintain | Underweight | 2025-09-11 |
Expeditors’ grades largely skew toward neutral and underweight ratings, with a consensus rating of “Hold.”
Which company has the best grades?
FedEx Corporation has received more favorable grades overall, with a majority of “Buy” ratings and a “Buy” consensus, indicating stronger analyst confidence compared to Expeditors International’s predominantly “Hold” and “Underweight” ratings. This difference may influence investors’ perceptions of growth potential and risk between the two companies.
Strengths and Weaknesses
Below is a comparison table summarizing the key strengths and weaknesses of FedEx Corporation (FDX) and Expeditors International of Washington, Inc. (EXPD) based on their recent financial and operational data.
| Criterion | FedEx Corporation (FDX) | Expeditors International (EXPD) |
|---|---|---|
| Diversification | Moderate diversification across express, freight, ground segments; some international revenue but limited | Focused on airfreight, customs brokerage, ocean freight; less diversified but specialized |
| Profitability | Lower net margin at 4.65%, ROIC at 6%, showing neutral profitability; declining ROIC trend | Higher net margin at 7.64%, ROIC at 27.62%, strong profitability with growing ROIC trend |
| Innovation | Limited evidence of innovation-driven growth; stable but value-destructive | Demonstrates durable competitive advantage, likely through innovative logistics solutions |
| Global presence | Strong global network with multiple service lines worldwide | Global reach with specialization in key freight and customs services |
| Market Share | Large market share in express and ground freight sectors but challenged by value destruction | Smaller market share but efficient capital use and higher returns, growing market position |
Key takeaways: Expeditors shows a robust financial profile with strong profitability and a durable competitive advantage, making it a favorable investment. FedEx, while diversified, faces challenges with declining profitability and value destruction, warranting cautious consideration.
Risk Analysis
Below is a comparison of key risk factors for FedEx Corporation and Expeditors International of Washington, Inc. as of the most recent reporting year.
| Metric | FedEx Corporation (FDX) | Expeditors International (EXPD) |
|---|---|---|
| Market Risk | Beta 1.36 – Higher volatility | Beta 1.14 – Moderate volatility |
| Debt level | Debt-to-Equity 1.33 – High | Debt-to-Equity 0.26 – Low |
| Regulatory Risk | Moderate – Global logistics | Moderate – Global logistics |
| Operational Risk | High – Large fleet & global ops | Moderate – Smaller scale operations |
| Environmental Risk | Moderate – Transport emissions | Moderate – Logistics footprint |
| Geopolitical Risk | Elevated – Cross-border trade | Elevated – Exposure to global trade |
FedEx faces higher financial leverage and operational risks due to its size and debt load, increasing vulnerability to market shifts and interest costs. Expeditors benefits from a stronger balance sheet and higher profitability, lowering financial risk but still exposed to geopolitical uncertainties affecting global shipping lanes. Investors should weigh FedEx’s leverage and market volatility against Expeditors’ more stable financial profile.
Which Stock to Choose?
FedEx Corporation (FDX) shows a mixed financial profile with slightly favorable financial ratios but an unfavorable income statement marked by declining profitability and growth. Its debt levels are relatively high, and the company’s economic moat is rated very unfavorable, indicating value destruction. The overall rating remains moderate despite some positive cash flow metrics.
Expeditors International of Washington, Inc. (EXPD) demonstrates a favorable financial ratio set with strong profitability, low debt, and a very favorable economic moat reflecting value creation and growing ROIC. Its income statement is mostly favorable with solid growth and healthy margins. Ratings are very favorable, supported by strong financial health scores and efficient asset use.
For investors focused on growth and robust profitability, EXPD may appear more attractive due to its favorable income evolution and strong competitive advantage. Conversely, investors prioritizing stability amid mixed signals might view FDX’s moderate rating and cash flow strengths as potential considerations, although its declining profitability and higher debt could signal caution.
Disclaimer: Investment carries a risk of loss of initial capital. The past performance is not a reliable indicator of future results. Be sure to understand risks before making an investment decision.
Go Further
I encourage you to read the complete analyses of FedEx Corporation and Expeditors International of Washington, Inc. to enhance your investment decisions: