Home > Comparison > Consumer Cyclical > RCL vs EXPE
The strategic rivalry between Royal Caribbean Cruises Ltd. and Expedia Group, Inc. shapes the evolution of the global travel services sector. Royal Caribbean operates as a capital-intensive cruise line with a vast fleet and global itineraries. Expedia Group, by contrast, is a high-margin online travel platform offering diverse booking services worldwide. This analysis pits asset-heavy operations against digital agility to identify which model delivers superior risk-adjusted returns for a diversified portfolio.

Table of contents
Companies Overview
Royal Caribbean Cruises Ltd. and Expedia Group, Inc. stand as key players shaping global travel services.
Royal Caribbean Cruises Ltd.: Global Cruise Powerhouse
Royal Caribbean Cruises Ltd. dominates the cruise industry with 61 ships operating worldwide. Its core revenue stems from passenger fares across multiple brands such as Royal Caribbean International and Celebrity Cruises. In 2026, the company focuses on expanding itineraries and enhancing onboard experiences to strengthen its premium market position.
Expedia Group, Inc.: Digital Travel Marketplace Leader
Expedia Group, Inc. leads as a comprehensive online travel platform offering lodging, car rentals, and alternative accommodations. It generates revenue through direct bookings and B2B services, including corporate travel management. The company’s 2026 strategy prioritizes broadening its brand portfolio and improving technology to capture increased global travel demand.
Strategic Collision: Similarities & Divergences
Royal Caribbean and Expedia share the goal of capturing travel consumers but differ sharply in approach. Royal Caribbean operates a closed ecosystem centered on physical cruise experiences, while Expedia embraces an open digital marketplace model. Their primary battleground lies in customer engagement—physical versus online travel services. This contrast defines their distinct risk exposures and investment profiles.
Income Statement Comparison
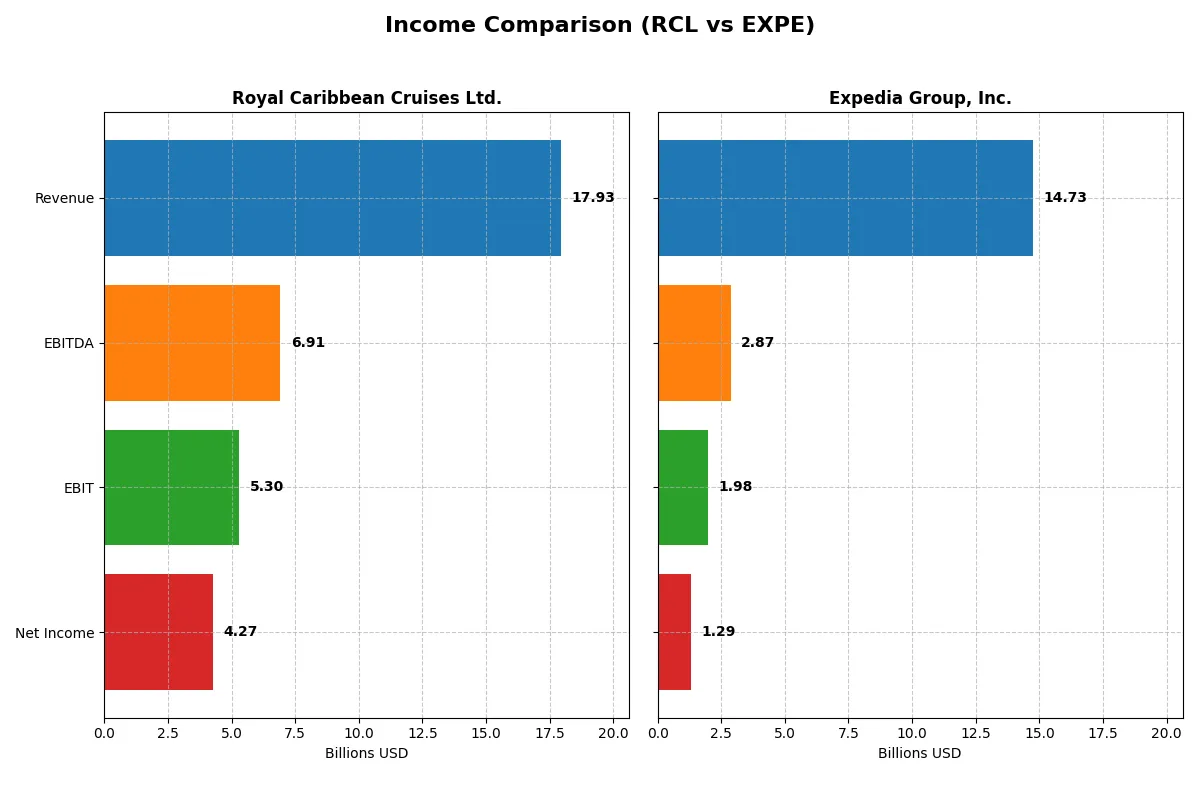
This data dissects the core profitability and scalability of both corporate engines to reveal who dominates the bottom line:
| Metric | Royal Caribbean Cruises Ltd. (RCL) | Expedia Group, Inc. (EXPE) |
|---|---|---|
| Revenue | 17.9B | 14.7B |
| Cost of Revenue | 9.5B | 2.3B |
| Operating Expenses | 3.5B | 10.4B |
| Gross Profit | 8.4B | 12.4B |
| EBITDA | 6.9B | 2.9B |
| EBIT | 5.3B | 2.0B |
| Interest Expense | 992M | 299M |
| Net Income | 4.3B | 1.3B |
| EPS | 15.73 | 10.32 |
| Fiscal Year | 2025 | 2025 |
Income Statement Analysis: The Bottom-Line Duel
This income statement comparison reveals each company’s operational efficiency and profitability over recent years, highlighting their financial momentum.
Royal Caribbean Cruises Ltd. Analysis
Royal Caribbean’s revenue surged from 1.53B in 2021 to 17.9B in 2025, with net income rebounding from heavy losses to 4.28B. Gross margin consistently hovers near 47%, and net margin climbed to 23.8%, reflecting strong cost control and improving profitability. The 2025 results demonstrate accelerating earnings and solid margin expansion.
Expedia Group, Inc. Analysis
Expedia’s revenue rose steadily from 8.6B in 2021 to 14.7B in 2025, with net income growing from near breakeven to 1.29B. Gross margin impresses at 84.1%, though net margin remains modest at 8.8%. Despite solid top-line growth and positive EBIT momentum, net margin dipped slightly last year, signaling margin pressure from operating costs.
Margin Strength vs. Revenue Growth Momentum
Royal Caribbean leads with superior net margins and rapid net income growth, reflecting enhanced operational leverage and efficiency. Expedia, while boasting higher gross margins and steady revenue gains, struggles with lower net profitability and margin volatility. Investors seeking robust margin expansion may favor Royal Caribbean’s profile, while those prioritizing consistent top-line growth might consider Expedia’s steadier revenue trajectory.
Financial Ratios Comparison
These vital ratios act as a diagnostic tool to expose the underlying fiscal health, valuation premiums, and capital efficiency of the companies compared below:
| Ratios | Royal Caribbean Cruises Ltd. (RCL) | Expedia Group, Inc. (EXPE) |
|---|---|---|
| ROE | 42.57% | 100.78% |
| ROIC | 14.90% | 17.05% |
| P/E | 17.69 | 27.45 |
| P/B | 7.53 | 27.66 |
| Current Ratio | 0.18 | 0.73 |
| Quick Ratio | 0.16 | 0.73 |
| D/E | 2.26 | 5.19 |
| Debt-to-Assets | 54.39% | 27.27% |
| Interest Coverage | 4.95 | 6.62 |
| Asset Turnover | 0.43 | 0.60 |
| Fixed Asset Turnover | 0.49 | 5.37 |
| Payout Ratio | 6.18% | 15.46% |
| Dividend Yield | 0.35% | 0.56% |
| Fiscal Year | 2025 | 2025 |
Efficiency & Valuation Duel: The Vital Signs
Financial ratios act as a company’s DNA, uncovering hidden risks and revealing operational strengths through key profitability and valuation metrics.
Royal Caribbean Cruises Ltd.
Royal Caribbean delivers robust profitability with a 42.57% ROE and a strong 23.82% net margin, indicating operational excellence. Its P/E of 17.69 suggests a fairly valued stock, though a high P/B of 7.53 signals premium pricing. The company returns modest dividends (0.35% yield) but faces liquidity and leverage concerns with a low current ratio (0.18) and high debt-to-equity (2.26).
Expedia Group, Inc.
Expedia posts an exceptional 100.78% ROE and a solid 17.05% ROIC, demonstrating capital efficiency. However, its valuation looks stretched with a P/E of 27.45 and P/B of 27.66, reflecting investor optimism. The 0.56% dividend yield remains low, as the firm prioritizes growth investments in R&D and SG&A. Liquidity ratios under 1 highlight cautious financial structure despite moderate debt levels.
Premium Valuation vs. Operational Safety
Expedia commands a premium valuation fueled by extraordinary returns but carries valuation and liquidity risks. Royal Caribbean offers more balanced valuation with strong profitability but shows red flags in leverage and liquidity. Investors seeking growth might prefer Expedia’s aggressive profile, while those prioritizing operational safety may lean towards Royal Caribbean’s steadier footing.
Which one offers the Superior Shareholder Reward?
I compare Royal Caribbean Cruises Ltd. (RCL) and Expedia Group, Inc. (EXPE) on dividends, payout ratios, and buybacks. RCL yields 0.35% with a low payout ratio of 6.2%, signaling conservative dividends and modest FCF coverage. EXPE pays 0.56% with a 15.5% payout ratio, reflecting a balanced cash return. RCL’s free cash flow is tight at 19% coverage, while EXPE shows a robust 80% FCF coverage. Buybacks are crucial: EXPE’s stronger free cash flow (25F vs. 4.6F per share) likely supports more intense buyback activity, though RCL’s recent recovery may boost its program. EXPE’s distribution model is sustainable, blending dividends and buybacks backed by solid operating cash flow and lower leverage. RCL’s high debt and low liquidity pose risks to future distributions. In 2026, I find EXPE offers a more attractive total shareholder return profile due to superior cash flow, dividend sustainability, and capital return balance.
Comparative Score Analysis: The Strategic Profile
The radar chart reveals the fundamental DNA and trade-offs of Royal Caribbean Cruises Ltd. and Expedia Group, Inc.:
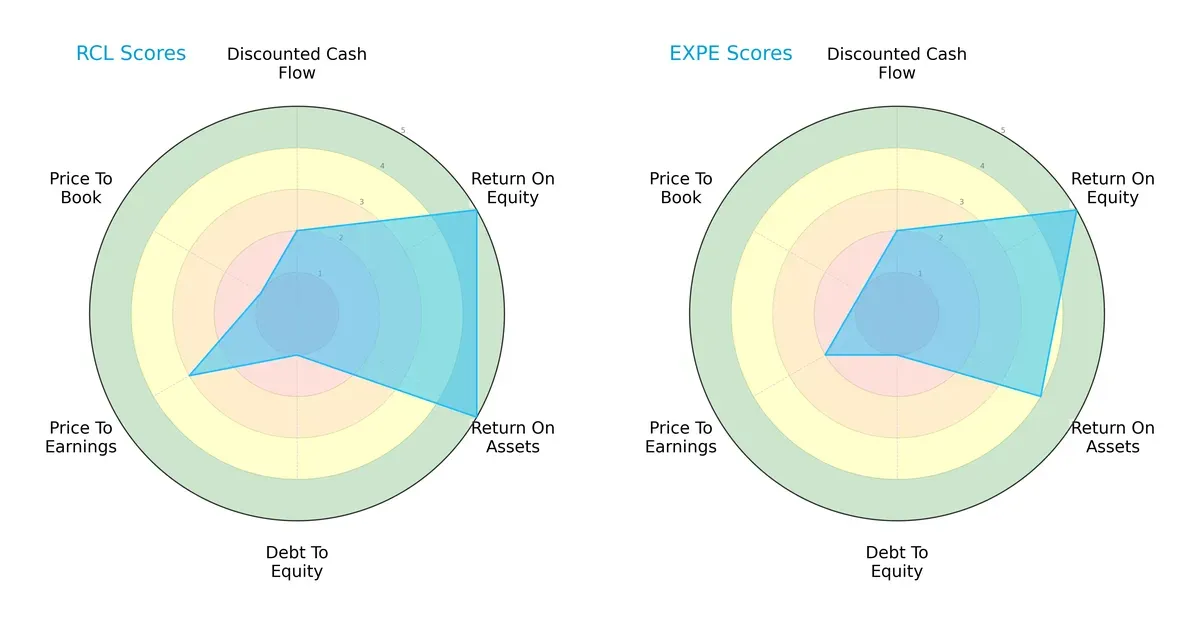
Royal Caribbean (RCL) and Expedia (EXPE) both score equally on overall strength (3) and discounted cash flow (2), indicating moderate valuation concerns. RCL leads slightly with a perfect ROE and ROA score of 5 each, reflecting superior asset and equity profitability, while EXPE trails with a 4 in ROA. Both firms carry heavy financial risk, scoring 1 in debt-to-equity, signaling high leverage. RCL shows a more balanced P/E score (3) than EXPE’s weaker 2, but both suffer from very unfavorable price-to-book scores (1). RCL’s profile balances profitability with valuation better; EXPE relies heavily on operational efficiency.
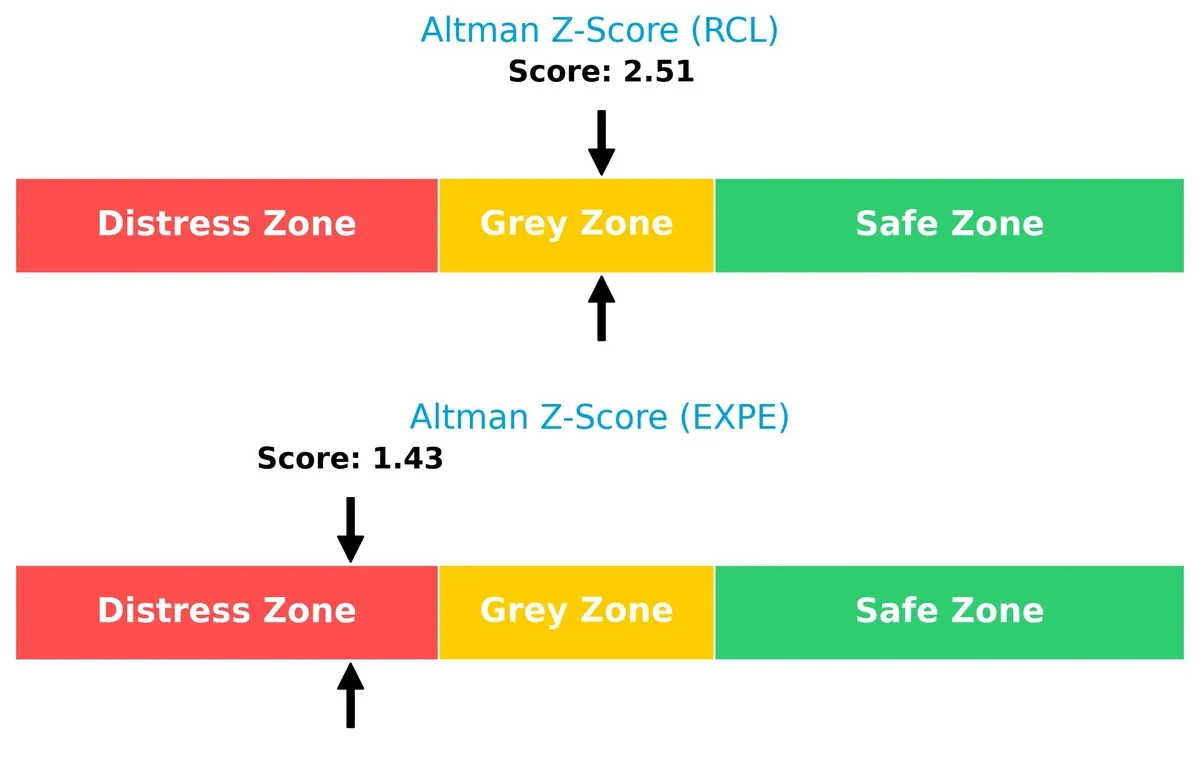
Bankruptcy Risk: Solvency Showdown
Royal Caribbean’s Altman Z-Score of 2.51 places it in the grey zone, while Expedia’s 1.43 falls into the distress zone. This gap signals that RCL faces a moderate bankruptcy risk; EXPE’s survival prospects are more precarious in this cycle:
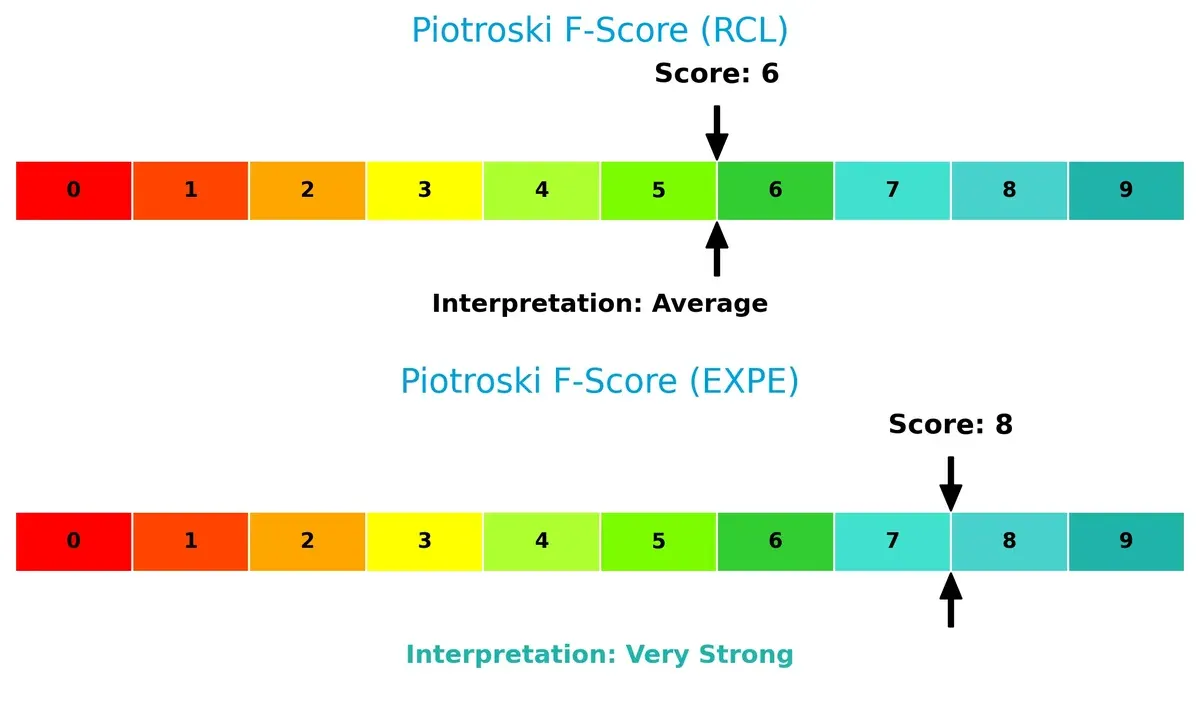
Financial Health: Quality of Operations
Expedia’s Piotroski F-Score of 8 indicates very strong financial health, outperforming Royal Caribbean’s average score of 6. This suggests Expedia maintains stronger internal financial controls and operational efficiency, while RCL shows potential red flags in its fundamentals:
How are the two companies positioned?
This section dissects the operational DNA of RCL and EXPE by comparing their revenue distribution and internal strengths and weaknesses. The goal is to confront their economic moats and identify which business model offers the most resilient, sustainable competitive advantage today.
Revenue Segmentation: The Strategic Mix
This visual comparison dissects how Royal Caribbean Cruises Ltd. and Expedia Group, Inc. diversify their income streams and where their primary sector bets lie:
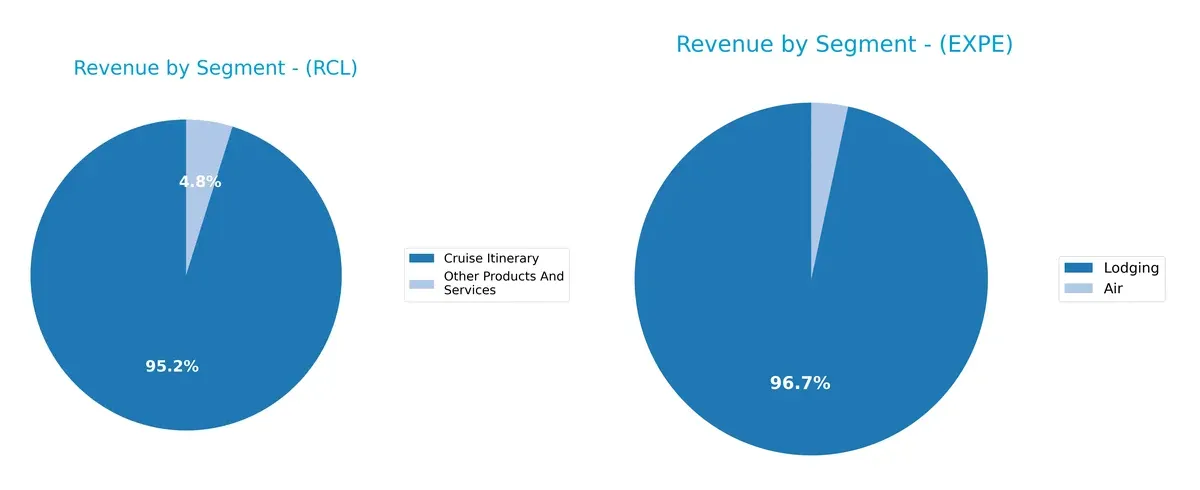
Royal Caribbean anchors revenue heavily in Cruise Itinerary, generating $17B in 2025, dwarfing its $864M from Other Products. Expedia shows a more diversified mix, with Lodging at $11.75B, but meaningful contributions from Air at $407M and Advertising at $954M in 2025. Expedia’s broader segmentation reduces concentration risk, while Royal Caribbean’s reliance on cruising underscores exposure to travel demand cycles and fleet utilization.
Strengths and Weaknesses Comparison
This table compares the strengths and weaknesses of Royal Caribbean Cruises Ltd. and Expedia Group, Inc.:
Royal Caribbean Cruises Ltd. Strengths
- Strong profitability with 23.82% net margin and 42.57% ROE
- Positive ROIC at 14.9% exceeds WACC
- Solid interest coverage of 5.34
- Diverse revenue streams from cruise itineraries and ancillary services
- Established global presence with significant North America, Europe, and Asia Pacific sales
Expedia Group, Inc. Strengths
- Exceptional ROE at 100.78% and favorable ROIC at 17.05%
- Lower debt-to-assets ratio at 27.27%
- High fixed asset turnover at 5.37 indicating asset efficiency
- Diversified revenue across lodging, air, and advertising
- Strong U.S. market presence with substantial international sales
Royal Caribbean Cruises Ltd. Weaknesses
- High leverage with debt-to-equity of 2.26 and debt-to-assets at 54.39%
- Weak liquidity ratios: current ratio 0.18, quick ratio 0.16
- Asset turnover low at 0.43, suggesting underutilized assets
- Unfavorable WACC at 10.77% above ROIC
- Elevated price-to-book at 7.53 and low dividend yield of 0.35%
Expedia Group, Inc. Weaknesses
- Elevated debt-to-equity ratio at 5.19 and weak liquidity: current and quick ratios at 0.73
- Unfavorable valuation metrics: PE 27.45 and PB 27.66
- Moderate net margin at 8.78% and neutral asset turnover at 0.6
- Dividend yield low at 0.56%
Royal Caribbean shows strong profitability but faces challenges in liquidity and leverage, which may impact financial flexibility. Expedia exhibits outstanding returns and asset efficiency but carries high debt and valuation pressures that warrant cautious monitoring.
The Moat Duel: Analyzing Competitive Defensibility
A structural moat is the only reliable shield protecting long-term profits from the relentless erosion of competition:
Royal Caribbean Cruises Ltd. (RCL): Experience-Driven Brand Loyalty
RCL’s moat stems from strong brand loyalty and high switching costs in luxury cruise experiences. This manifests as stable margins near 30% EBIT and growing ROIC. Expansion in Asia Pacific could deepen its moat in 2026, but rising fuel costs remain a threat.
Expedia Group, Inc. (EXPE): Network Effects and Scale Advantage
EXPE’s moat relies on its vast online travel platform and network effects across multiple brands. Its ROIC outpaces competitors, driven by low capital intensity and scalable tech. Growth in alternative accommodations and corporate travel management promises further moat expansion.
Structural Moat Strength: Brand Loyalty vs. Network Effects
EXPE’s network-driven moat is wider, showing a higher ROIC premium and faster growth than RCL’s brand loyalty moat. I believe EXPE is better positioned to defend and scale its market share amid digital disruption.
Which stock offers better returns?
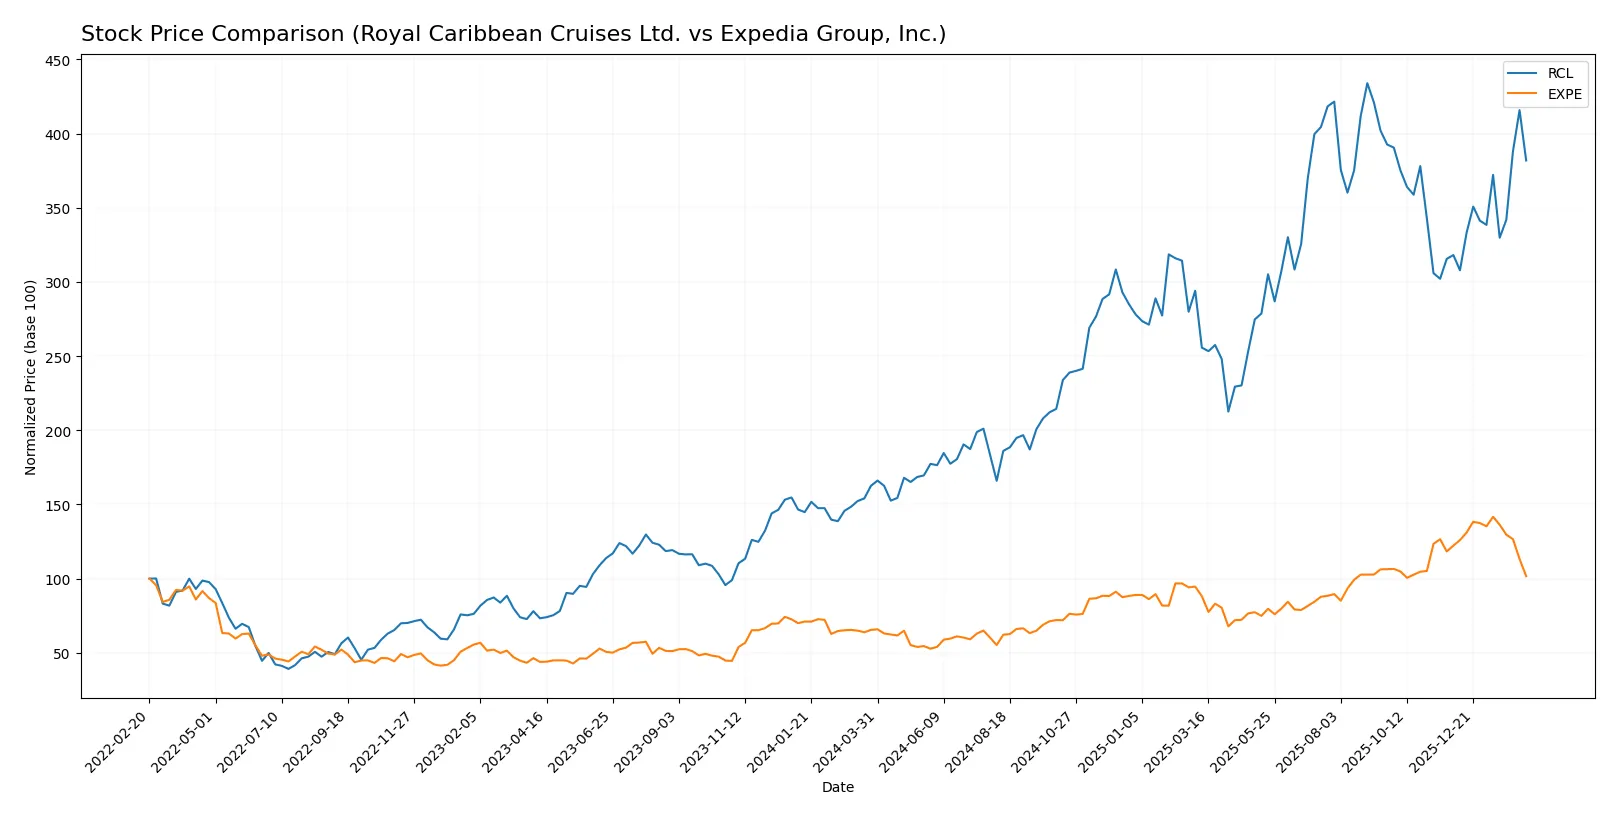
The past year shows Royal Caribbean Cruises Ltd. surging with strong upward momentum, while Expedia Group, Inc. gained notably but with recent weakening in price and volume trends.
Trend Comparison
Royal Caribbean Cruises Ltd. exhibits a 135% price increase over 12 months, reflecting a bullish trend with accelerating gains and a high volatility level (std dev 66.51). The stock reached a peak of 363.22 and bottomed at 127.67.
Expedia Group, Inc. posted a 55% rise in the same period, sustaining a bullish trend but with decelerating momentum. Volatility is lower (std dev 47.22). However, recent months show a 17% decline, indicating short-term bearishness.
Royal Caribbean’s acceleration and higher total return outperform Expedia’s decelerating trend and recent price drop. Thus, Royal Caribbean delivers the stronger market performance over the past year.
Target Prices
Analysts present a cautiously optimistic target consensus for these travel service companies.
| Company | Target Low | Target High | Consensus |
|---|---|---|---|
| Royal Caribbean Cruises Ltd. | 318 | 425 | 367.5 |
| Expedia Group, Inc. | 244 | 330 | 277.43 |
Royal Caribbean’s consensus target is about 15% above its current 320 price, signaling moderate upside potential. Expedia’s target suggests a nearly 30% gain from its 213 price, reflecting stronger growth expectations.

Don’t Let Luck Decide Your Entry Point
Optimize your entry points with our advanced ProRealTime indicators. You’ll get efficient buy signals with precise price targets for maximum performance. Start outperforming now!
How do institutions grade them?
Royal Caribbean Cruises Ltd. Grades
Here are the recent grades from reputable financial institutions for Royal Caribbean Cruises Ltd.:
| Grading Company | Action | New Grade | Date |
|---|---|---|---|
| Tigress Financial | Maintain | Buy | 2026-02-06 |
| Morgan Stanley | Maintain | Equal Weight | 2026-02-03 |
| Citigroup | Maintain | Buy | 2026-02-02 |
| Wells Fargo | Maintain | Overweight | 2026-02-02 |
| Goldman Sachs | Maintain | Buy | 2026-02-02 |
| JP Morgan | Maintain | Overweight | 2026-02-02 |
| Jefferies | Maintain | Hold | 2026-01-30 |
| Stifel | Maintain | Buy | 2026-01-30 |
| Barclays | Maintain | Overweight | 2026-01-30 |
| Goldman Sachs | Maintain | Buy | 2026-01-23 |
Expedia Group, Inc. Grades
Below are the recent grades from recognized financial firms for Expedia Group, Inc.:
| Grading Company | Action | New Grade | Date |
|---|---|---|---|
| Barclays | Maintain | Equal Weight | 2026-02-13 |
| BTIG | Maintain | Buy | 2026-02-13 |
| Benchmark | Maintain | Buy | 2026-02-13 |
| Piper Sandler | Maintain | Neutral | 2026-02-13 |
| Wells Fargo | Maintain | Equal Weight | 2026-02-13 |
| DA Davidson | Maintain | Neutral | 2026-02-13 |
| TD Cowen | Maintain | Hold | 2026-02-13 |
| Truist Securities | Maintain | Hold | 2026-02-10 |
| Wedbush | Maintain | Neutral | 2026-02-06 |
| UBS | Maintain | Neutral | 2026-02-03 |
Which company has the best grades?
Royal Caribbean Cruises Ltd. holds more consistent Buy and Overweight ratings from top firms. Expedia’s grades cluster around Neutral to Buy. Investors may see Royal Caribbean as more favorably viewed by analysts.
Risks specific to each company
The following categories identify the critical pressure points and systemic threats facing both firms in the 2026 market environment:
1. Market & Competition
Royal Caribbean Cruises Ltd.
- Faces intense competition in cruise industry with rising fuel costs and evolving consumer preferences.
Expedia Group, Inc.
- Operates in highly fragmented online travel market with strong rivals and rapid technology shifts.
2. Capital Structure & Debt
Royal Caribbean Cruises Ltd.
- High debt-to-equity ratio (2.26) signals significant leverage risk, raising financial vulnerability.
Expedia Group, Inc.
- Even higher leverage (5.19 D/E) despite lower debt-to-assets (27%), indicating reliance on debt financing.
3. Stock Volatility
Royal Caribbean Cruises Ltd.
- Beta of 1.87 shows elevated stock volatility, reflecting sensitivity to market swings.
Expedia Group, Inc.
- Beta of 1.38 indicates moderate volatility, less reactive than Royal Caribbean but still above market average.
4. Regulatory & Legal
Royal Caribbean Cruises Ltd.
- Subject to maritime safety, environmental regulations, and port restrictions worldwide.
Expedia Group, Inc.
- Faces data privacy laws and consumer protection regulations in multiple jurisdictions.
5. Supply Chain & Operations
Royal Caribbean Cruises Ltd.
- Vulnerable to disruptions in shipbuilding, fuel supply, and global travel restrictions.
Expedia Group, Inc.
- Depends on stable internet infrastructure and third-party lodging and transport providers.
6. ESG & Climate Transition
Royal Caribbean Cruises Ltd.
- High exposure to climate risk due to carbon emissions and ocean health impact on cruises.
Expedia Group, Inc.
- Faces pressure to promote sustainable travel options and reduce platform carbon footprint.
7. Geopolitical Exposure
Royal Caribbean Cruises Ltd.
- Global itineraries expose it to geopolitical tensions and international travel bans.
Expedia Group, Inc.
- International operations risk affected by changing visa policies and regional conflicts.
Which company shows a better risk-adjusted profile?
Royal Caribbean’s most impactful risk is its heavy leverage, which strains liquidity and operational flexibility amid volatile market conditions. Expedia’s key risk lies in its distressed Altman Z-score, signaling bankruptcy risk despite a strong Piotroski score. Overall, Expedia shows a slightly better risk-adjusted profile due to lower debt-to-assets and stronger operational efficiency metrics. However, Expedia’s elevated debt-to-equity ratio and legal complexity merit caution. The contrasting financial health trends underscore the importance of balancing leverage with operational resilience in 2026’s travel sector environment.
Final Verdict: Which stock to choose?
Royal Caribbean Cruises Ltd. (RCL) stands out as a cash-generating powerhouse with a notably expanding return on invested capital. Its superpower lies in turning capital into strong profits, signaling a durable economic moat. However, its low liquidity ratios and high leverage remain points of vigilance. RCL suits investors targeting aggressive growth with a tolerance for balance sheet risks.
Expedia Group, Inc. (EXPE) offers a compelling strategic moat through its dominant position in online travel services and a strong recurring revenue base. Its healthier debt profile compared to RCL provides better financial stability. EXPE fits well with investors focused on growth at a reasonable price, balancing growth prospects with a more conservative risk stance.
If you prioritize aggressive growth and can accept higher leverage risks, Royal Caribbean outshines with its superior capital efficiency and profitability trajectory. However, if you seek better financial stability and a robust strategic moat in the digital travel sector, Expedia offers a safer profile despite commanding a premium valuation. Both present viable scenarios depending on your investment strategy and risk appetite.
Disclaimer: Investment carries a risk of loss of initial capital. The past performance is not a reliable indicator of future results. Be sure to understand risks before making an investment decision.
Go Further
I encourage you to read the complete analyses of Royal Caribbean Cruises Ltd. and Expedia Group, Inc. to enhance your investment decisions: