In the dynamic travel services industry, Expedia Group, Inc. (EXPE) and Norwegian Cruise Line Holdings Ltd. (NCLH) stand out as influential players with distinct yet overlapping market focuses. Expedia excels in online travel bookings and diverse accommodation options, while Norwegian Cruise Line dominates the cruise sector with a global fleet. This article will explore their innovation strategies and market positions to help you decide which company offers the most compelling investment opportunity.

Table of contents
Companies Overview
I will begin the comparison between Expedia Group, Inc. and Norwegian Cruise Line Holdings Ltd. by providing an overview of these two companies and their main differences.
Expedia Group Overview
Expedia Group, Inc. is a leading online travel company operating globally, focusing on retail, B2B, and metasearch segments. Its diverse brand portfolio includes Expedia, Hotels.com, Vrbo, and Trivago, serving leisure and corporate travelers with lodging, alternative accommodations, car rentals, and travel booking services. Founded in 1996 and headquartered in Seattle, the company emphasizes comprehensive travel solutions and media services.
Norwegian Cruise Line Holdings Overview
Norwegian Cruise Line Holdings Ltd. operates cruise brands such as Norwegian Cruise Line, Oceania Cruises, and Regent Seven Seas Cruises across North America, Europe, and Asia-Pacific. With a fleet of 28 ships and approximately 59,150 berths, it offers itineraries ranging from short trips to extended voyages worldwide. Founded in 1966 and based in Miami, the company focuses on cruise experiences distributed through travel advisors, onboard sales, and group charters.
Key similarities and differences
Both companies operate in the travel services industry but differ markedly in their business models. Expedia is a digital platform offering a wide array of travel products and services through multiple brands, focusing on online booking and travel management. In contrast, Norwegian Cruise Line Holdings provides physical cruise experiences with a fleet of ships and direct sales channels. Expedia’s operations are more diversified, while Norwegian Cruise is specialized in maritime travel.
Income Statement Comparison
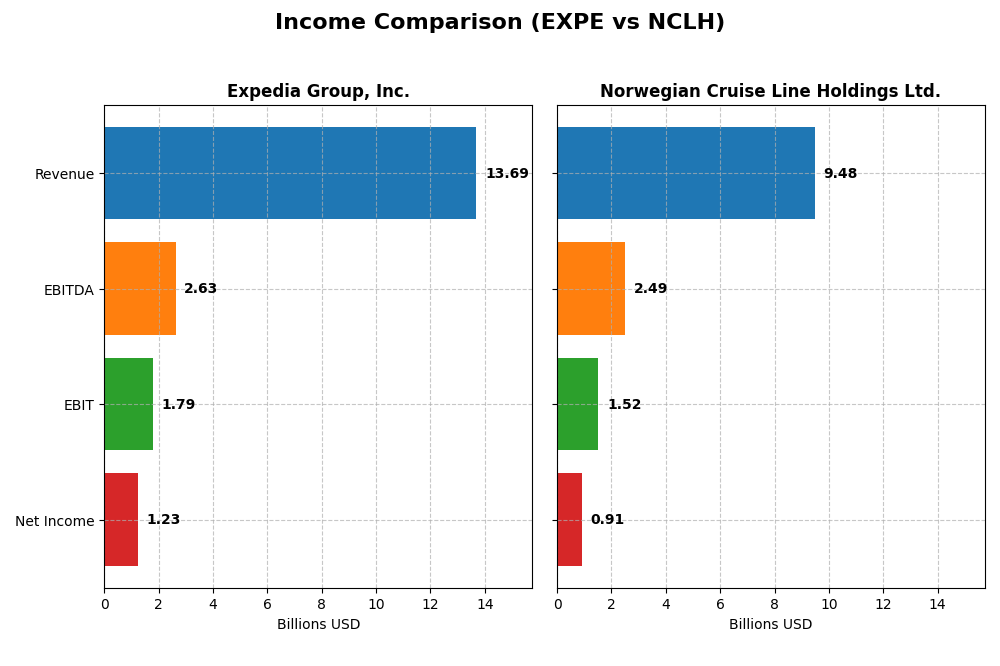
The following table presents a side-by-side comparison of key income statement metrics for Expedia Group, Inc. and Norwegian Cruise Line Holdings Ltd. for the fiscal year 2024.
| Metric | Expedia Group, Inc. (EXPE) | Norwegian Cruise Line Holdings Ltd. (NCLH) |
|---|---|---|
| Market Cap | 34.7B | 11.2B |
| Revenue | 13.7B | 9.5B |
| EBITDA | 2.63B | 2.49B |
| EBIT | 1.79B | 1.52B |
| Net Income | 1.23B | 910M |
| EPS | 9.39 | 2.09 |
| Fiscal Year | 2024 | 2024 |
Income Statement Interpretations
Expedia Group, Inc.
Expedia’s revenue and net income have shown strong growth from 2020 to 2024, with revenue rising to $13.7B and net income reaching $1.23B in 2024. Margins demonstrate favorable trends, particularly gross margin at 89.5% and net margin at 9.0%. The latest year saw moderate revenue growth of 6.6%, while net margin and EPS improved significantly, indicating enhanced profitability.
Norwegian Cruise Line Holdings Ltd.
Norwegian Cruise Line experienced substantial revenue growth, reaching $9.48B in 2024 from a low base in 2020. Net income also recovered strongly to $910M. Margins improved favorably, with gross margin near 40% and net margin at 9.6% in 2024. The latest fiscal year showed a 10.9% revenue increase and a dramatic rise in net margin and EPS, reflecting significant operational recovery and efficiency gains.
Which one has the stronger fundamentals?
Both companies exhibit favorable income statement trends over the period, but Expedia’s higher gross margin (89.5%) and steady margin improvements contrast with Norwegian’s lower gross margin (40%) despite higher EBIT margin. Norwegian’s stronger revenue growth rate and net income surge highlight robust recovery potential. Overall, each shows strengths: Expedia in margin stability, Norwegian in growth momentum.
Financial Ratios Comparison
The following table presents a side-by-side comparison of key financial ratios for Expedia Group, Inc. and Norwegian Cruise Line Holdings Ltd. as reported for the fiscal year 2024.
| Ratios | Expedia Group, Inc. (EXPE) | Norwegian Cruise Line Holdings Ltd. (NCLH) |
|---|---|---|
| ROE | 79.3% | 63.9% |
| ROIC | 10.7% | 11.1% |
| P/E | 19.8 | 12.3 |
| P/B | 15.7 | 7.86 |
| Current Ratio | 0.72 | 0.17 |
| Quick Ratio | 0.72 | 0.15 |
| D/E (Debt-to-Equity) | 4.19 | 9.76 |
| Debt-to-Assets | 29.2% | 69.7% |
| Interest Coverage | 5.36 | 1.96 |
| Asset Turnover | 0.61 | 0.47 |
| Fixed Asset Turnover | 5.04 | 0.56 |
| Payout ratio | 0% | 0% |
| Dividend yield | 0% | 0% |
Interpretation of the Ratios
Expedia Group, Inc.
Expedia’s ratios present a mixed picture with favorable returns on equity (79.25%) and invested capital (10.66%), but weak liquidity indicated by a current ratio of 0.72 and high debt-to-equity of 4.19. The price-to-book ratio is also unfavorable at 15.73. The company does not pay dividends, likely prioritizing reinvestment and growth over shareholder distributions.
Norwegian Cruise Line Holdings Ltd.
Norwegian Cruise Line shows favorable return on equity (63.86%) and return on invested capital (11.11%), alongside a reasonable PE ratio of 12.3. However, it faces significant liquidity issues with a very low current ratio of 0.17 and high leverage, debt-to-assets at 69.69%. It also does not pay dividends, likely due to ongoing reinvestment and debt management needs.
Which one has the best ratios?
Expedia Group exhibits a more balanced ratio profile with stronger liquidity and coverage ratios, while Norwegian Cruise Line carries higher leverage and weaker liquidity metrics. Expedia’s higher proportion of favorable ratios (35.71%) compared to Norwegian’s 21.43% suggests a relatively more stable financial position, though both face challenges in dividend returns and leverage management.
Strategic Positioning
This section compares the strategic positioning of Expedia Group, Inc. and Norwegian Cruise Line Holdings Ltd., including market position, key segments, and exposure to technological disruption:
Expedia Group, Inc.
- Large market cap of 34.7B; faces competition in online travel services market
- Diverse segments: Lodging, Air, Advertising and Media; broad travel services portfolio
- Online platform model exposed to digital innovation; potential disruption in travel booking
Norwegian Cruise Line Holdings Ltd.
- Smaller market cap of 11.2B; operates in competitive cruise industry
- Focused on cruise passenger tickets and onboard services; niche travel segment
- Cruise operations less exposed to tech disruption; relies on physical fleet and routes
Expedia Group, Inc. vs Norwegian Cruise Line Holdings Ltd. Positioning
Expedia pursues a diversified travel services approach across lodging, air, and advertising, offering broad market exposure. Norwegian Cruise Line concentrates on cruise vacations, providing specialized experiences but less segment diversity. Diversification offers risk spreading; concentration focuses on niche expertise.
Which has the best competitive advantage?
Both companies show slightly favorable MOAT evaluations with growing ROIC trends but still shedding value. Neither currently demonstrates a strong competitive advantage, though profitability improvements indicate potential future value creation.
Stock Comparison
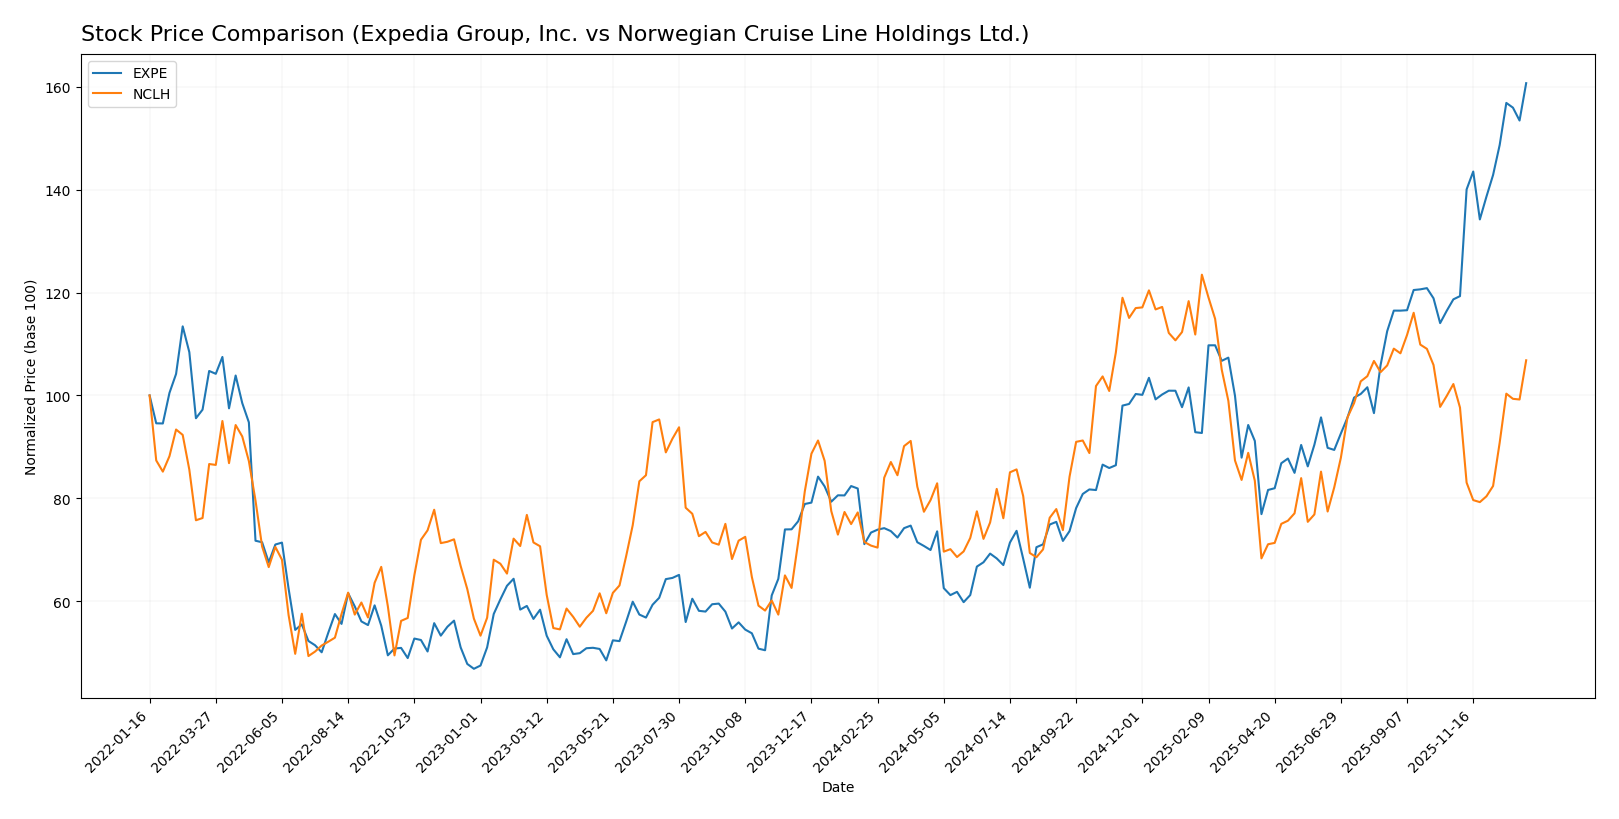
The stock prices of Expedia Group, Inc. and Norwegian Cruise Line Holdings Ltd. have shown significant bullish trends over the past 12 months, with notable acceleration in price appreciation for both companies.
Trend Analysis
Expedia Group, Inc. (EXPE) experienced a strong bullish trend over the past year, with a price increase of 119.1%. The trend shows acceleration, reaching a high of 296.33 and a low of 110.31, with a high volatility indicated by a 44.59 standard deviation.
Norwegian Cruise Line Holdings Ltd. (NCLH) also showed a bullish trend with a 50.86% price increase in the same period. The trend accelerated moderately, with a highest price of 28.35 and lowest of 15.69, accompanied by lower volatility at 3.67 standard deviation.
Comparing the two, EXPE outperformed NCLH over the past year, delivering the highest market performance with more than double the percentage gain.
Target Prices
The current analyst consensus presents a balanced outlook for Expedia Group, Inc. and Norwegian Cruise Line Holdings Ltd.
| Company | Target High | Target Low | Consensus |
|---|---|---|---|
| Expedia Group, Inc. | 330 | 190 | 259.45 |
| Norwegian Cruise Line Holdings Ltd. | 38 | 20 | 26 |
Analysts expect Expedia’s stock to trade slightly below its recent price of 296.33 USD, indicating some downside risk, while Norwegian Cruise Line’s consensus target of 26 USD suggests a modest upside from its current price of 24.53 USD.
Analyst Opinions Comparison
This section compares analysts’ ratings and grades for Expedia Group, Inc. and Norwegian Cruise Line Holdings Ltd.:
Rating Comparison
EXPE Rating
- Rating: B, considered Very Favorable by analysts.
- Discounted Cash Flow Score: Moderate at 2, indicating a cautious valuation.
- ROE Score: Very Favorable at 5, showing strong profit generation efficiency.
- ROA Score: Favorable at 4, reflecting effective asset utilization.
- Debt To Equity Score: Very Unfavorable at 1, indicating high financial risk.
- Overall Score: Moderate at 3, summarizing a balanced financial standing.
NCLH Rating
- Rating: B, also regarded as Very Favorable by analysts.
- Discounted Cash Flow Score: Moderate at 3, slightly higher than EXPE’s score.
- ROE Score: Very Favorable at 5, matching EXPE’s strong efficiency.
- ROA Score: Moderate at 3, lower than EXPE’s asset utilization score.
- Debt To Equity Score: Very Unfavorable at 1, same high financial risk level.
- Overall Score: Moderate at 3, equal to EXPE’s overall evaluation.
Which one is the best rated?
Both EXPE and NCLH share the same overall rating of B and overall score of 3, indicating comparable analyst favorability. EXPE shows a better ROA score, while NCLH has a slightly higher discounted cash flow score; both have identical ROE and debt to equity scores.
Scores Comparison
Here is a comparison of the Altman Z-Score and Piotroski Score for Expedia Group, Inc. and Norwegian Cruise Line Holdings Ltd.:
EXPE Scores
- Altman Z-Score: 1.59, in the distress zone, indicating high bankruptcy risk.
- Piotroski Score: 9, very strong financial health and investment potential.
NCLH Scores
- Altman Z-Score: 0.32, in the distress zone, indicating very high bankruptcy risk.
- Piotroski Score: 5, average financial strength and investment potential.
Which company has the best scores?
Based on the provided data, EXPE has a higher Piotroski Score indicating stronger financial health, while both companies are in the Altman Z-Score distress zone. EXPE’s scores suggest comparatively better financial stability than NCLH.
Grades Comparison
Here is a detailed comparison of the latest grades provided by recognized grading companies for the two companies:
Expedia Group, Inc. Grades
The following table summarizes recent grades assigned to Expedia Group, Inc. by major grading firms:
| Grading Company | Action | New Grade | Date |
|---|---|---|---|
| Wells Fargo | Maintain | Equal Weight | 2026-01-09 |
| Bernstein | Maintain | Market Perform | 2026-01-06 |
| BTIG | Maintain | Buy | 2026-01-06 |
| B of A Securities | Maintain | Buy | 2025-12-19 |
| Wedbush | Maintain | Neutral | 2025-12-19 |
| Jefferies | Maintain | Hold | 2025-12-11 |
| DA Davidson | Maintain | Neutral | 2025-12-11 |
| Mizuho | Maintain | Neutral | 2025-11-17 |
| Citigroup | Maintain | Neutral | 2025-11-11 |
| Jefferies | Maintain | Hold | 2025-11-10 |
Overall, Expedia Group’s grades show a balanced trend, primarily clustered around Hold and Neutral ratings with some Buy endorsements, indicating cautious optimism from analysts.
Norwegian Cruise Line Holdings Ltd. Grades
The following table details recent grades assigned to Norwegian Cruise Line Holdings Ltd. by leading grading companies:
| Grading Company | Action | New Grade | Date |
|---|---|---|---|
| Barclays | Maintain | Overweight | 2025-12-17 |
| Jefferies | Downgrade | Hold | 2025-12-15 |
| Mizuho | Maintain | Outperform | 2025-12-12 |
| Goldman Sachs | Downgrade | Neutral | 2025-12-09 |
| Truist Securities | Maintain | Buy | 2025-12-02 |
| Wells Fargo | Maintain | Overweight | 2025-12-01 |
| Susquehanna | Maintain | Neutral | 2025-11-12 |
| Goldman Sachs | Maintain | Buy | 2025-11-11 |
| Morgan Stanley | Maintain | Equal Weight | 2025-11-10 |
| JP Morgan | Maintain | Overweight | 2025-11-05 |
Norwegian Cruise Line’s grades indicate a generally positive outlook with several Overweight and Buy ratings, though recent downgrades to Hold and Neutral reflect some analyst caution.
Which company has the best grades?
Norwegian Cruise Line Holdings Ltd. has received a stronger consensus with multiple Overweight and Buy grades, compared to Expedia Group’s Hold and Neutral ratings. This difference may influence investors seeking more bullish analyst sentiment versus a more conservative profile.
Strengths and Weaknesses
Below is a comparison of key strengths and weaknesses for Expedia Group, Inc. (EXPE) and Norwegian Cruise Line Holdings Ltd. (NCLH) based on their latest financial and operational data.
| Criterion | Expedia Group, Inc. (EXPE) | Norwegian Cruise Line Holdings Ltd. (NCLH) |
|---|---|---|
| Diversification | Strong with multiple revenue streams: lodging ($10.95B), advertising ($954M), air travel ($428M) in 2024 | Limited to cruise industry with passenger tickets ($6.42B) and onboard services ($3.06B) in 2024 |
| Profitability | Favorable ROIC at 10.66%, ROE very favorable at 79.25%; net margin neutral at 9.01% | ROIC slightly higher at 11.11%, ROE favorable at 63.86%, net margin neutral at 9.6% |
| Innovation | Moderate; growing ROIC trend but no strong moat yet | Moderate; also showing growing ROIC trend but no clear competitive advantage |
| Global presence | High; operates globally through online platforms | Moderate; cruise operations more regionally constrained |
| Market Share | Significant in online travel booking | Strong in cruise segment but smaller overall market coverage |
Key takeaways: Both companies exhibit growing profitability trends but currently lack strong economic moats. Expedia’s diversified revenue base and global reach provide resilience, whereas Norwegian Cruise Line’s focus on cruising limits diversification and exposes it to sector-specific risks. Risk management favors Expedia for investors seeking broader market exposure.
Risk Analysis
Below is a comparison of key risks for Expedia Group, Inc. (EXPE) and Norwegian Cruise Line Holdings Ltd. (NCLH) based on the most recent 2024 data:
| Metric | Expedia Group, Inc. (EXPE) | Norwegian Cruise Line Holdings Ltd. (NCLH) |
|---|---|---|
| Market Risk | Beta 1.43 (moderate volatility) | Beta 2.08 (high volatility) |
| Debt Level | Debt/Equity 4.19 (high), Debt to Assets 29.17% (moderate) | Debt/Equity 9.76 (very high), Debt to Assets 69.69% (very high) |
| Regulatory Risk | Moderate, typical for travel services | Elevated, due to international maritime regulations |
| Operational Risk | Moderate, diversified online platforms | High, dependent on cruise operations and fleet maintenance |
| Environmental Risk | Moderate, online travel less impact | High, cruise industry faces scrutiny over emissions and waste |
| Geopolitical Risk | Moderate, global travel disruptions possible | High, cruise itineraries affected by geopolitical tensions |
Synthesis: Norwegian Cruise Line faces the most impactful risks due to very high debt, greater exposure to environmental regulations, and geopolitical uncertainties affecting cruise routes. Expedia’s risks are more moderate, with financial leverage as a key concern. Both companies must manage operational and regulatory risks carefully in a volatile travel market.
Which Stock to Choose?
Expedia Group, Inc. (EXPE) shows a favorable income evolution with strong growth in revenue and net income, supported by high ROE (79.25%) and ROIC (10.66%). While profitability and interest coverage are favorable, its debt level and liquidity ratios are less so, resulting in a neutral overall financial ratio evaluation and a very favorable B rating.
Norwegian Cruise Line Holdings Ltd. (NCLH) also presents favorable income growth with robust EBIT and net margin improvements. Its ROE (63.86%) and ROIC (11.11%) are positive, yet it carries higher debt and weaker liquidity ratios, leading to an unfavorable global financial ratio evaluation despite a very favorable B rating.
For investors, EXPE’s neutral financial ratio profile combined with strong income growth and profitability may appeal to those seeking growth potential with moderate risk. Conversely, NCLH’s financials might appear more suitable for investors willing to tolerate higher leverage and volatility in exchange for operational improvements and income growth.
Disclaimer: Investment carries a risk of loss of initial capital. The past performance is not a reliable indicator of future results. Be sure to understand risks before making an investment decision.
Go Further
I encourage you to read the complete analyses of Expedia Group, Inc. and Norwegian Cruise Line Holdings Ltd. to enhance your investment decisions: