Home > Comparison > Utilities > EXC vs XEL
The strategic rivalry between Exelon Corporation and Xcel Energy Inc. shapes the Utilities sector’s future. Exelon operates a diversified energy generation portfolio with nuclear and renewables, while Xcel focuses on regulated electric and natural gas utilities across multiple states. This clash highlights a contest between broad generation capabilities and regional regulated growth. This analysis will identify which company offers a superior risk-adjusted return for a diversified portfolio in today’s evolving energy landscape.
Table of contents
Companies Overview
Exelon Corporation and Xcel Energy Inc. stand as heavyweight contenders in the regulated electric utility sector.
Exelon Corporation: Diversified Energy Powerhouse
Exelon Corporation dominates as a utility services holding company with a broad portfolio including nuclear, fossil, wind, hydroelectric, biomass, and solar. It generates revenue by selling electricity and natural gas to wholesale and retail customers across the U.S. and Canada. In 2026, Exelon sharpens its focus on integrating renewable energy with traditional generation to balance reliability and sustainability.
Xcel Energy Inc.: Integrated Utility Leader
Xcel Energy Inc. operates as a regulated electric and natural gas utility serving 3.7 million electricity and 2.1 million natural gas customers. Its revenue stems from generating, purchasing, and distributing energy through diverse sources like coal, nuclear, solar, and wind. In 2026, Xcel emphasizes expanding renewable infrastructure while enhancing natural gas pipeline and storage assets to support energy transition.
Strategic Collision: Similarities & Divergences
Both companies rely on regulated electric utilities with diverse generation assets, but Exelon’s broader geographic reach contrasts with Xcel’s regional depth. They compete primarily in renewable energy expansion and customer base growth. Exelon’s larger workforce and integrated services suggest a complex operational model, whereas Xcel’s focused utility segments reflect streamlined capital allocation, defining distinct risk-return profiles for investors.
Income Statement Comparison
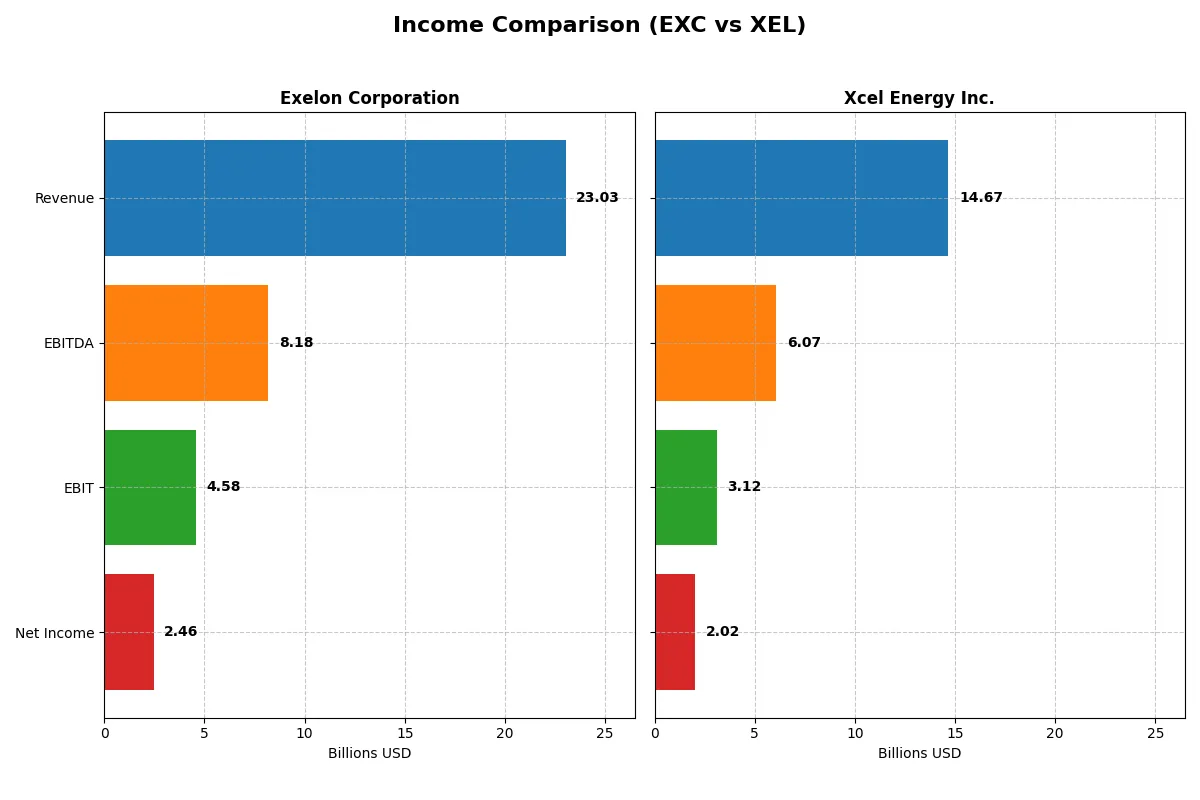
The following data dissects the core profitability and scalability of both corporate engines to reveal who dominates the bottom line:
| Metric | Exelon Corporation (EXC) | Xcel Energy Inc. (XEL) |
|---|---|---|
| Revenue | 23.0B | 13.4B |
| Cost of Revenue | 13.6B | 7.3B |
| Operating Expenses | 5.1B | 3.8B |
| Gross Profit | 9.4B | 6.1B |
| EBITDA | 8.2B | 5.6B |
| EBIT | 4.6B | 2.7B |
| Interest Expense | 1.9B | 1.2B |
| Net Income | 2.5B | 1.9B |
| EPS | 2.45 | 3.44 |
| Fiscal Year | 2024 | 2024 |
Income Statement Analysis: The Bottom-Line Duel
This income statement comparison reveals which company converts revenue into profit most efficiently, highlighting operational strength and financial discipline.
Exelon Corporation Analysis
Exelon’s revenue grew steadily from 17.9B in 2021 to 23B in 2024, with net income rising from 1.7B to 2.46B. Gross margin holds strong at 40.8%, and net margin is a favorable 10.7%. Despite neutral revenue growth in 2024, Exelon’s operational efficiency and EPS growth signal solid momentum.
Xcel Energy Inc. Analysis
Xcel Energy’s revenue advanced from 13.4B in 2021 to 14.7B in 2025, with net income climbing from 1.6B to 2.02B. The company maintains a 24.3% gross margin and a superior 13.8% net margin. Xcel shows favorable revenue and EBIT growth, although a dip in gross profit growth in 2025 weakens short-term margin momentum.
Margin Strength vs. Revenue Expansion
Exelon excels in gross margin and operational efficiency, while Xcel delivers stronger net margin and higher revenue growth rates. Exelon’s consistent EPS and net income growth underpin fundamental strength. Xcel appeals with its higher profitability ratios and recent revenue acceleration. Investors seeking margin resilience may prefer Exelon; those favoring growth might lean toward Xcel.
Financial Ratios Comparison
These vital ratios act as a diagnostic tool to expose the underlying fiscal health, valuation premiums, and capital efficiency of the companies analyzed:
| Ratios | Exelon Corporation (EXC) | Xcel Energy Inc. (XEL) |
|---|---|---|
| ROE | 9.1% (2024) | 9.9% (2024) |
| ROIC | 3.9% (2024) | 3.6% (2024) |
| P/E | 15.3x (2024) | 19.6x (2024) |
| P/B | 1.40x (2024) | 1.95x (2024) |
| Current Ratio | 0.87 (2024) | 0.67 (2024) |
| Quick Ratio | 0.78 (2024) | 0.57 (2024) |
| D/E | 1.73 (2024) | 1.55 (2024) |
| Debt-to-Assets | 43.3% (2024) | 43.1% (2024) |
| Interest Coverage | 2.26x (2024) | 2.02x (2024) |
| Asset Turnover | 0.21 (2024) | 0.19 (2024) |
| Fixed Asset Turnover | 0.29 (2024) | 0.23 (2024) |
| Payout Ratio | 62.0% (2024) | 60.7% (2024) |
| Dividend Yield | 4.04% (2024) | 3.09% (2024) |
| Fiscal Year | 2024 | 2024 |
Efficiency & Valuation Duel: The Vital Signs
Financial ratios act as a company’s DNA, exposing hidden risks and operational strengths that shape investment decisions.
Exelon Corporation
Exelon posts a moderate ROE of 9.14% with a net margin of 10.68%, showing decent profitability but weaker capital efficiency (ROIC 3.93% below WACC 5.04%). Its valuation is fair with a P/E of 15.35 and a P/B at 1.4. A solid 4.04% dividend yield rewards shareholders amid stretched liquidity (current ratio 0.87).
Xcel Energy Inc.
Xcel Energy displays a stronger net margin of 13.76% but reports a zero ROE and ROIC, signaling potential reporting gaps or operational challenges. The P/E stands higher at 21.48, indicating a stretched valuation. Its 3.83% dividend yield slightly lags Exelon’s, while favorable debt metrics suggest more conservative leverage management.
Balanced Profitability vs. Valuation Stretch
Exelon offers better profitability metrics and shareholder returns but suffers from weaker liquidity and capital efficiency. Xcel’s higher valuation and incomplete leverage data raise caution despite solid margins. Risk-tolerant investors may prefer Exelon’s yield and returns, while those wary of valuation premium might hesitate.
Which one offers the Superior Shareholder Reward?
I find Exelon (EXC) and Xcel Energy (XEL) both pay solid dividends with yields near 4%. Exelon’s payout ratio hovers around 62%, supported by moderate free cash flow despite recent negative figures. Xcel yields slightly less (~3.8%) but sustains a lower payout ratio near 61%, balancing dividends with steady buybacks. I note Exelon’s buyback intensity is less transparent but likely conservative given leverage (debt/equity ~1.7). Xcel shows consistent buybacks enhancing total return. Long-term, Xcel’s balanced dividend and buyback approach appears more sustainable. I conclude Xcel offers a superior total shareholder reward profile in 2026 due to prudent capital allocation and healthier free cash flow coverage.
Comparative Score Analysis: The Strategic Profile
The radar chart reveals the fundamental DNA and trade-offs of Exelon Corporation and Xcel Energy Inc., highlighting their financial strengths and vulnerabilities:
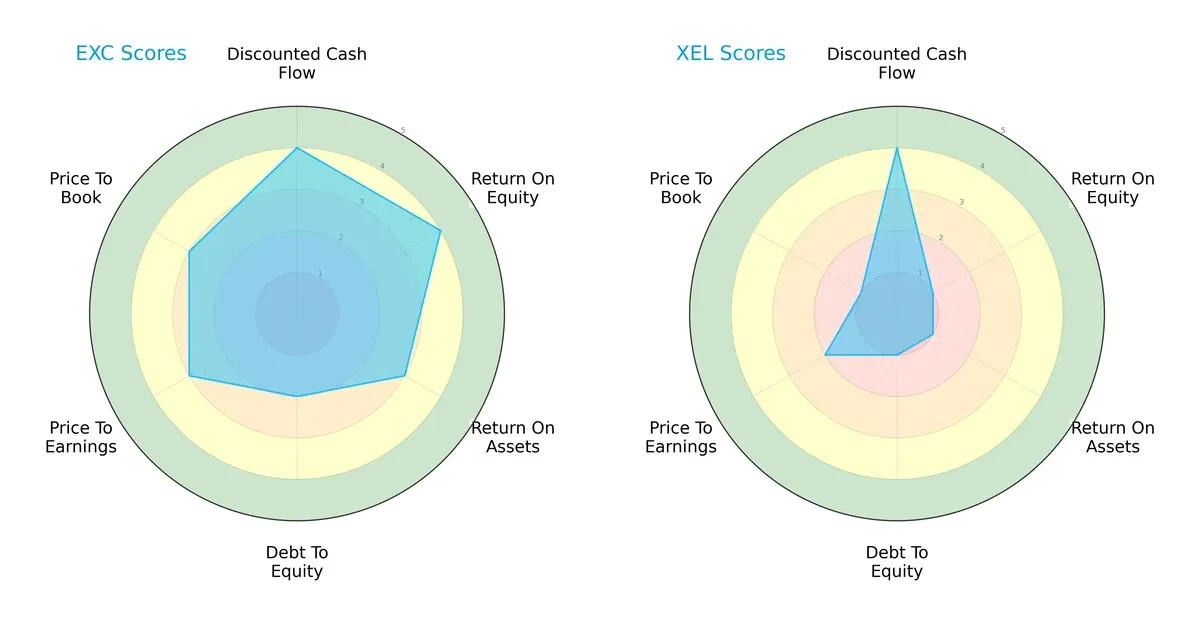
Exelon shows a more balanced profile with strong DCF (4), ROE (4), and ROA (3) scores, though its debt/equity score (2) flags moderate leverage risk. Xcel Energy relies heavily on a favorable DCF score (4) but struggles with very low profitability and financial stability metrics (ROE 1, ROA 1, Debt/Equity 1). Exelon’s moderate valuation scores (PE 3, PB 3) contrast with Xcel’s weaker valuation metrics, underscoring Exelon’s superior overall financial health.
—
Financial Health: Quality of Operations
Exelon and Xcel both score in the average range on the Piotroski F-Score, registering 5 and 4 respectively:
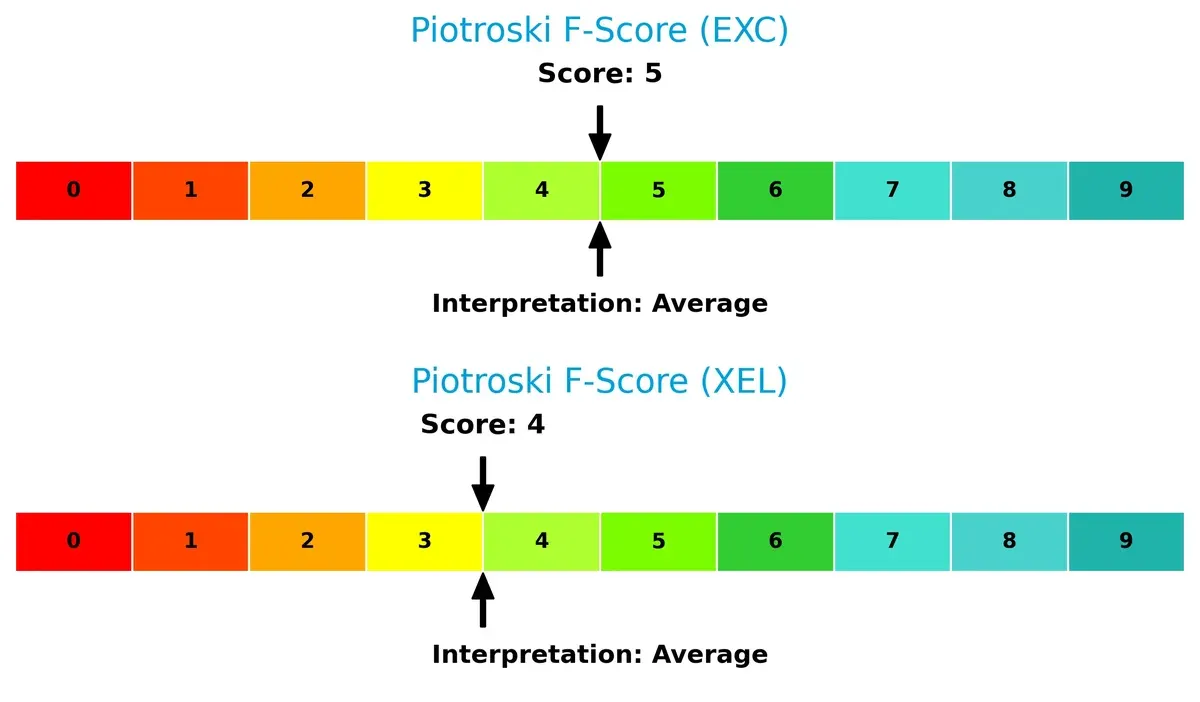
Exelon’s slightly higher score indicates marginally better operational strength and internal financial quality. Neither firm shows clear red flags, but both remain below the strong financial health threshold, suggesting cautious monitoring of their internal metrics is prudent.
How are the two companies positioned?
This section dissects the operational DNA of Exelon and Xcel by comparing their revenue distribution by segment and internal dynamics. The goal is to confront their economic moats to reveal which model delivers the most resilient, sustainable competitive edge today.
Revenue Segmentation: The Strategic Mix
The following visual comparison dissects how Exelon Corporation and Xcel Energy Inc. diversify their income streams and where their primary sector bets lie:
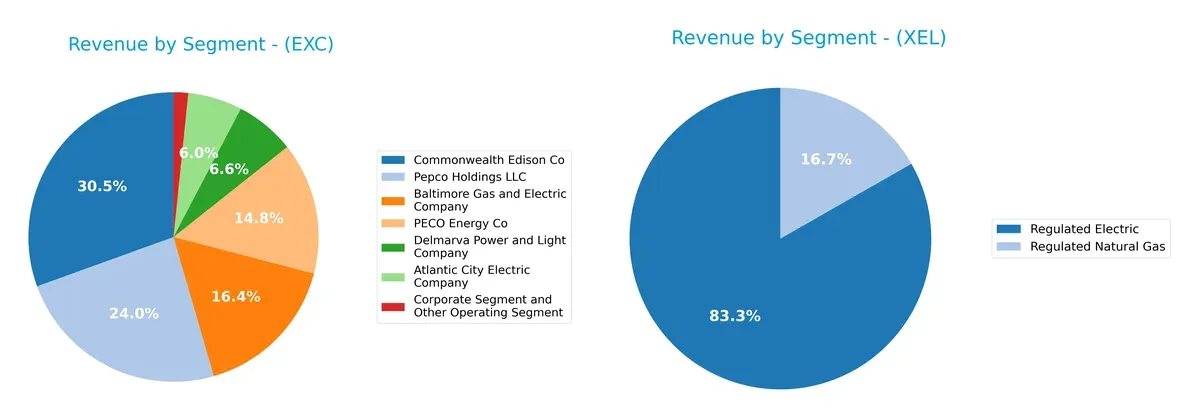
Exelon’s revenue splits across seven utility segments, with Commonwealth Edison Co anchoring at $8.2B and Pepco Holdings LLC close behind at $6.4B. This multi-segment approach signals a broad utility ecosystem, reducing concentration risk. Xcel Energy leans heavily on Regulated Electric at $22.3B, dwarfing its Regulated Natural Gas at $4.5B. Xcel’s focus offers infrastructure dominance but raises exposure to electric market shifts.
Strengths and Weaknesses Comparison
This table compares the strengths and weaknesses of Exelon Corporation and Xcel Energy Inc.:
Exelon Corporation Strengths
- Diversified revenue across multiple operating segments
- Favorable net margin at 10.68%
- Dividend yield at 4.04% supports shareholder returns
- Price-to-book ratio favorable at 1.4
Xcel Energy Inc. Strengths
- Higher net margin at 13.76% indicates better profitability
- Favorable debt-to-equity and debt-to-assets ratios imply stronger balance sheet
- Dividend yield at 3.83% supports income investors
- Favorable price-to-book despite unavailable WACC
Exelon Corporation Weaknesses
- Unfavorable return on equity (9.14%) and return on invested capital (3.93%)
- Current and quick ratios below 1 indicate liquidity concerns
- High debt-to-equity at 1.73 signals leverage risk
- Low asset and fixed asset turnover ratios show inefficiency
Xcel Energy Inc. Weaknesses
- Zero return on equity and invested capital indicate profitability challenges
- Current and quick ratios unavailable or zero suggest liquidity risk
- Asset turnover and fixed asset turnover ratios unfavorable
- WACC unavailable, limiting cost of capital assessment
Exelon shows a broad revenue base and solid dividend but struggles with returns and liquidity. Xcel delivers stronger margin and balance sheet metrics yet faces challenges in profitability and efficiency. Both companies exhibit slightly unfavorable overall financial ratios, underscoring areas for strategic focus.
The Moat Duel: Analyzing Competitive Defensibility
A structural moat protects a firm’s long-term profits from relentless competition’s erosion. Here is how Exelon Corporation and Xcel Energy Inc. defend their turf:
Exelon Corporation: Nuclear-Backed Operational Moat
Exelon relies on its nuclear and diversified energy assets, creating high switching costs and margin stability. Despite shedding value, rising ROIC signals improving efficiency in 2026.
Xcel Energy Inc.: Regional Scale and Regulatory Moat
Xcel leverages regulatory barriers and regional scale, distinct from Exelon’s asset-driven moat. Its declining ROIC warns of pressure, but steady revenue growth offers expansion potential.
Verdict: Asset Diversification vs. Regulatory Scale
Exelon’s growing ROIC amid value destruction offers a deeper moat than Xcel’s regional regulatory advantage paired with declining efficiency. Exelon appears better positioned to defend market share long term.
Which stock offers better returns?
The past year showed strong gains for both stocks, with Xcel Energy nearly doubling Exelon’s price appreciation despite recent downward pressure on both.
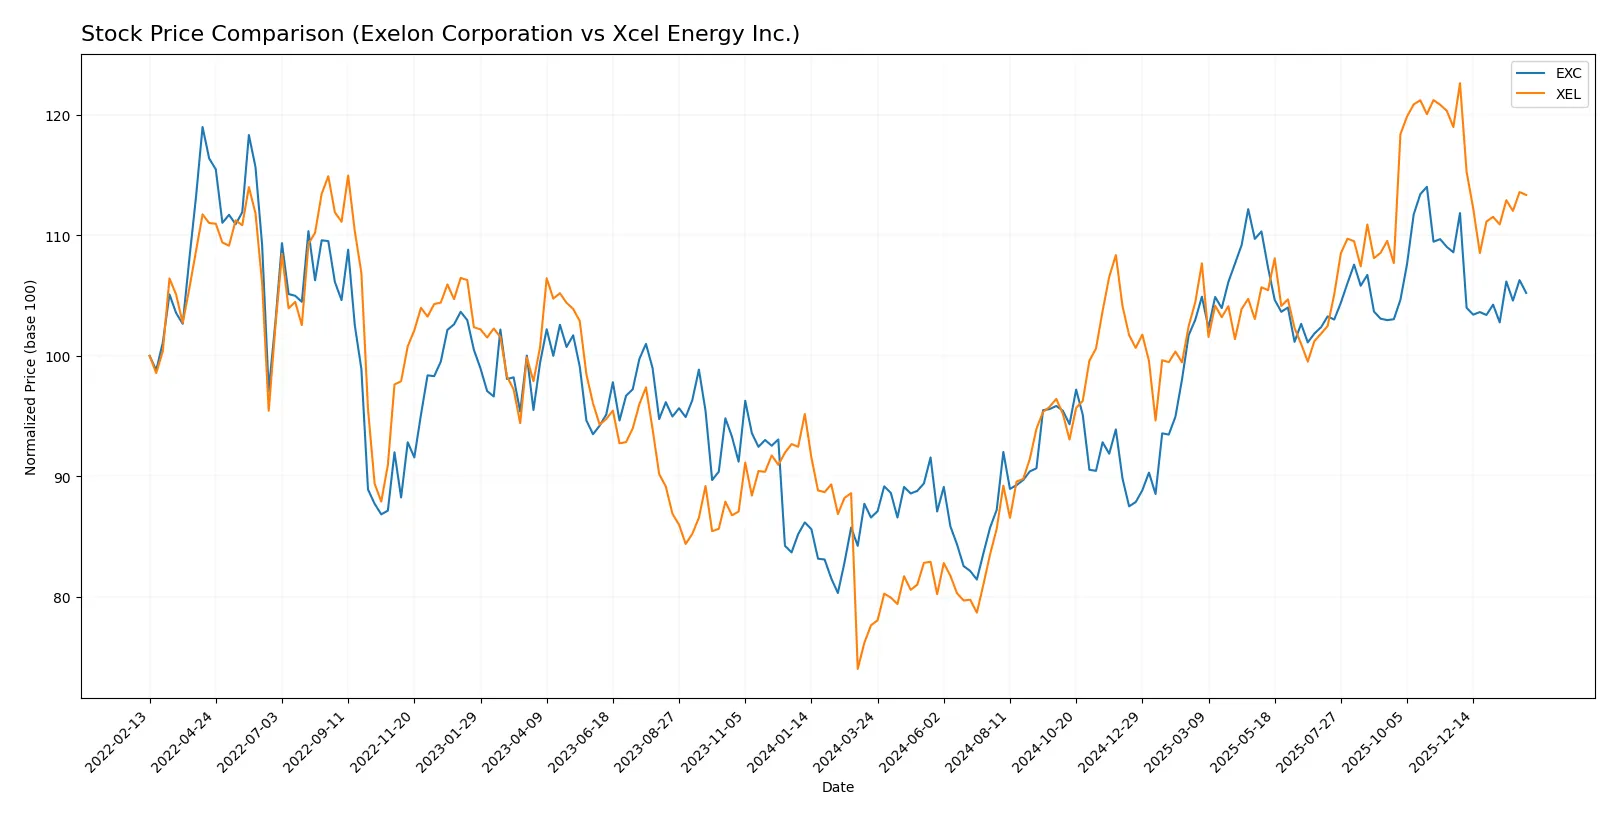
Trend Comparison
Exelon Corporation’s stock rose 21.52% over the past 12 months, marking a bullish trend with decelerating momentum. The price ranged between 34.31 and 48.04, showing moderate volatility (3.65 std dev).
Xcel Energy Inc. gained 45.99% over the same year, also bullish but with higher volatility (8.24 std dev). The trend decelerated, peaking at 82.11 before recent declines of 4.73%.
Xcel Energy outperformed Exelon, delivering the highest market return despite both stocks facing recent short-term sell-offs.
Target Prices
Analysts present a solid target consensus for Exelon Corporation and Xcel Energy Inc., indicating bullish expectations.
| Company | Target Low | Target High | Consensus |
|---|---|---|---|
| Exelon Corporation | 39 | 57 | 50.5 |
| Xcel Energy Inc. | 81 | 95 | 88 |
The consensus target for Exelon at 50.5 suggests a ~14% upside from the current 44.33 price. Xcel Energy’s target at 88 implies a strong ~16% gain over the current 75.9 price.

Don’t Let Luck Decide Your Entry Point
Optimize your entry points with our advanced ProRealTime indicators. You’ll get efficient buy signals with precise price targets for maximum performance. Start outperforming now!
How do institutions grade them?
The following tables summarize recent institutional grades for Exelon Corporation and Xcel Energy Inc.:
Exelon Corporation Grades
This table lists the latest grades issued by major financial institutions for Exelon Corporation.
| Grading Company | Action | New Grade | Date |
|---|---|---|---|
| Jefferies | Maintain | Buy | 2026-01-27 |
| Barclays | Maintain | Overweight | 2026-01-22 |
| Wells Fargo | Maintain | Overweight | 2026-01-20 |
| UBS | Maintain | Neutral | 2025-12-17 |
| JP Morgan | Maintain | Neutral | 2025-12-12 |
| Morgan Stanley | Maintain | Equal Weight | 2025-10-22 |
| Jefferies | Maintain | Buy | 2025-10-15 |
| Keybanc | Maintain | Underweight | 2025-10-15 |
| Barclays | Maintain | Overweight | 2025-10-14 |
| UBS | Maintain | Neutral | 2025-10-10 |
Xcel Energy Inc. Grades
This table presents the most recent institutional grades for Xcel Energy Inc.
| Grading Company | Action | New Grade | Date |
|---|---|---|---|
| Barclays | Maintain | Overweight | 2026-01-15 |
| UBS | Maintain | Neutral | 2025-12-17 |
| Keybanc | Maintain | Overweight | 2025-12-12 |
| JP Morgan | Maintain | Overweight | 2025-12-11 |
| Barclays | Maintain | Overweight | 2025-11-05 |
| Citigroup | Maintain | Buy | 2025-11-03 |
| UBS | Maintain | Neutral | 2025-10-31 |
| Mizuho | Maintain | Outperform | 2025-10-27 |
| Jefferies | Maintain | Buy | 2025-10-16 |
| Keybanc | Maintain | Overweight | 2025-10-15 |
Which company has the best grades?
Xcel Energy consistently receives stronger grades, with multiple Buy, Overweight, and Outperform ratings. Exelon shows more Neutral and Equal Weight grades, with occasional Underweight. Investors may see Xcel as favored by analysts, potentially reflecting relative confidence.
Risks specific to each company
The following categories identify the critical pressure points and systemic threats facing both firms in the 2026 market environment:
1. Market & Competition
Exelon Corporation
- Faces intense competition in regulated electric markets with diverse energy sources; moderate net margin but challenged ROE and ROIC ratios.
Xcel Energy Inc.
- Operates in multiple states with regulated utilities; stronger net margin but zero ROE and ROIC reported, signaling operational challenges.
2. Capital Structure & Debt
Exelon Corporation
- High debt-to-equity ratio (1.73) signals elevated financial risk; interest coverage moderate but debt weighs on balance sheet.
Xcel Energy Inc.
- Debt metrics unavailable or zero, suggesting limited transparency; interest coverage neutral but financial leverage appears low.
3. Stock Volatility
Exelon Corporation
- Beta of 0.566 indicates moderate volatility below the market average, favoring risk-averse investors.
Xcel Energy Inc.
- Lower beta at 0.476 suggests even less stock volatility, appealing for stability-focused portfolios.
4. Regulatory & Legal
Exelon Corporation
- Operates in heavily regulated energy markets with exposure to nuclear and fossil fuel regulations, increasing compliance costs.
Xcel Energy Inc.
- Also subject to stringent regulatory environment; state-specific oversight across multiple jurisdictions adds complexity.
5. Supply Chain & Operations
Exelon Corporation
- Diverse energy generation mix supports operational resilience but asset turnover and fixed asset turnover are unfavorable.
Xcel Energy Inc.
- Energy portfolio is broad but lacks efficiency metrics; operational scale smaller with fewer employees, possibly limiting flexibility.
6. ESG & Climate Transition
Exelon Corporation
- Owns nuclear and renewable assets, positioning well for climate transition but faces legacy fossil fuel risks.
Xcel Energy Inc.
- Invests in renewables and natural gas infrastructure; climate transition strategy critical amid regulatory pressures.
7. Geopolitical Exposure
Exelon Corporation
- Primarily US and Canada-focused; geopolitical risk moderate but cross-border regulations could impact operations.
Xcel Energy Inc.
- Concentrated in US markets, reducing international geopolitical risk but vulnerable to state-level policy shifts.
Which company shows a better risk-adjusted profile?
Exelon’s highest risk lies in its leveraged capital structure and weak liquidity ratios, raising financial distress concerns. Xcel struggles with operational efficiency and zero returns on equity and assets, signaling fundamental profitability issues. However, Xcel’s lower leverage and stock volatility provide a marginally better risk-adjusted profile. The recent Altman Z-Score of 0.77 for Exelon in the distress zone intensifies concerns over its debt burden, while Xcel’s incomplete data on leverage adds uncertainty. Overall, Xcel’s conservative capital structure edges it ahead despite operational headwinds.
Final Verdict: Which stock to choose?
Exelon Corporation (EXC) shines as a cash-generative utility with solid income growth and improving profitability. Its main point of vigilance is the heavy leverage and weak liquidity ratios, which could pressure financial flexibility. EXC fits portfolios seeking steady income with moderate risk tolerance.
Xcel Energy Inc. (XEL) boasts a strategic moat in its consistent net margin advantage and operational efficiency. Relative to EXC, XEL appears safer on debt metrics and offers a more favorable dividend yield, appealing to investors favoring income stability and moderate growth. It suits a GARP (Growth at a Reasonable Price) portfolio profile.
If you prioritize resilient cash flow and income growth, Exelon commands attention despite its leverage risks. However, if you seek better balance sheet stability coupled with attractive dividend potential, Xcel offers superior safety and margin performance. Both stocks carry sector-specific risks, so suitability depends on your risk appetite and portfolio goals.
Disclaimer: Investment carries a risk of loss of initial capital. The past performance is not a reliable indicator of future results. Be sure to understand risks before making an investment decision.
Go Further
I encourage you to read the complete analyses of Exelon Corporation and Xcel Energy Inc. to enhance your investment decisions: