In the competitive regulated electric utility sector, Exelon Corporation (EXC) and WEC Energy Group, Inc. (WEC) stand out as key players shaping the industry’s future. Both companies share a strong focus on diversified energy generation and innovative approaches to sustainability, serving overlapping markets in the United States. This comparison aims to identify which company presents the most compelling investment opportunity for traders and investors seeking stable growth and income. Let’s explore their strengths to guide your investment decision.
Table of contents
Companies Overview
I will begin the comparison between Exelon Corporation and WEC Energy Group, Inc. by providing an overview of these two companies and their main differences.
Exelon Corporation Overview
Exelon Corporation operates as a utility services holding company focused on energy generation, delivery, and marketing in the US and Canada. It owns diverse generating facilities including nuclear, fossil, wind, hydroelectric, biomass, and solar. The company supplies electricity and natural gas to wholesale and retail customers and offers various support services, positioning itself as a comprehensive energy provider with a strong presence in regulated electric markets.
WEC Energy Group, Inc. Overview
WEC Energy Group, Inc. provides regulated natural gas and electricity services across multiple US states through its subsidiaries. It operates six segments, including electric transmission and non-utility energy infrastructure. WEC generates electricity from coal, natural gas, oil, and renewables, and manages extensive distribution networks for electricity and natural gas. Headquartered in Milwaukee, it emphasizes regulated energy delivery and infrastructure management.
Key similarities and differences
Both companies operate in the regulated electric utility sector, focusing on energy generation and distribution with diversified energy sources including renewables. Exelon has a broader footprint in both generation technologies and geographic reach, including Canada, while WEC concentrates more on regulated natural gas and electricity services within the US. Exelon also offers a wider range of support and ancillary services, contrasting with WEC’s segmentation into regional and infrastructure operations.
Income Statement Comparison
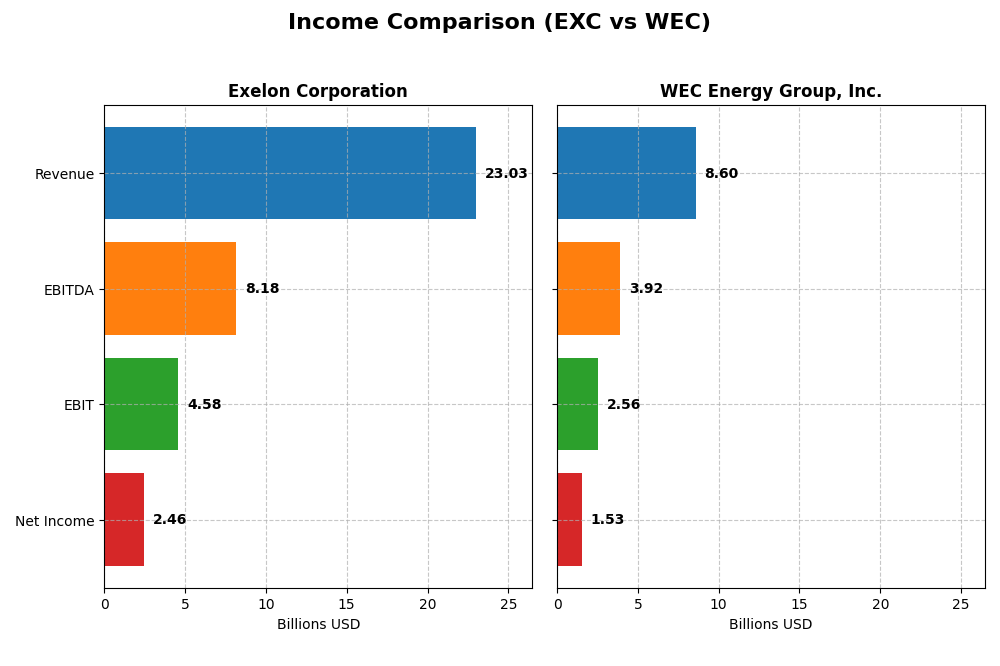
Below is a side-by-side comparison of key income statement metrics for Exelon Corporation and WEC Energy Group, Inc. for the fiscal year 2024.
| Metric | Exelon Corporation | WEC Energy Group, Inc. |
|---|---|---|
| Market Cap | 43.8B | 33.5B |
| Revenue | 23.0B | 8.6B |
| EBITDA | 8.18B | 3.92B |
| EBIT | 4.58B | 2.56B |
| Net Income | 2.46B | 1.53B |
| EPS | 2.45 | 4.81 |
| Fiscal Year | 2024 | 2024 |
Income Statement Interpretations
Exelon Corporation
Exelon’s revenue showed a mixed trend, peaking in 2020 at $33B before declining to $23B in 2024, reflecting a 30.3% overall decrease. Net income, however, grew by 25.3% over the period, reaching $2.46B in 2024. Margins improved notably, with a gross margin of 40.8% and net margin of 10.7% in 2024. Recent growth slowed slightly, with net margin dipping -0.3% but EPS rising 4.7%.
WEC Energy Group, Inc.
WEC’s revenue increased steadily by 18.8% from 2020 to 2024, reaching $8.6B, though it declined by 3.3% in the latest year. Net income grew 27.3% overall, reaching $1.53B in 2024. Margins remain strong, with a gross margin of 44.0%, EBIT margin of 29.8%, and net margin of 17.8%. The recent year showed favorable margin expansion, with net margin growing 18.6% and EPS up 14.5%.
Which one has the stronger fundamentals?
WEC demonstrates stronger fundamentals with consistent revenue growth over the period, superior margins, and favorable margin and EPS expansion in the latest year. Exelon’s net income growth is solid, but revenue decline and slight net margin contraction temper its profile. Both companies have favorable income statement evaluations, yet WEC’s higher margin stability and growth suggest a more robust earnings foundation.
Financial Ratios Comparison
The table below compares key financial ratios for Exelon Corporation (EXC) and WEC Energy Group, Inc. (WEC) based on their most recent fiscal year data, providing a snapshot of their financial health and operational efficiency.
| Ratios | Exelon Corporation (EXC) | WEC Energy Group, Inc. (WEC) |
|---|---|---|
| ROE | 9.14% | 12.30% |
| ROIC | 3.93% | 4.14% |
| P/E | 15.35 | 19.46 |
| P/B | 1.40 | 2.39 |
| Current Ratio | 0.87 | 0.60 |
| Quick Ratio | 0.78 | 0.43 |
| D/E (Debt-to-Equity) | 1.73 | 1.64 |
| Debt-to-Assets | 43.3% | 42.9% |
| Interest Coverage | 2.26 | 2.64 |
| Asset Turnover | 0.21 | 0.18 |
| Fixed Asset Turnover | 0.29 | 0.25 |
| Payout ratio | 61.95% | 69.10% |
| Dividend yield | 4.04% | 3.55% |
Interpretation of the Ratios
Exelon Corporation
Exelon shows a mixed ratio profile with a favorable net margin of 10.68% and strong dividend yield at 4.04%. However, it faces challenges with low return on equity (9.14%), return on invested capital (3.93%), and liquidity ratios below 1, indicating potential short-term solvency concerns. The company maintains dividends, but free cash flow coverage is negative, which may question sustainability.
WEC Energy Group, Inc.
WEC’s ratios reflect a healthier profitability margin at 17.77%, with a neutral return on equity of 12.3% and a slightly higher weighted average cost of capital at 5.3%. Liquidity ratios are low, mirroring Exelon’s situation, and debt levels remain a concern. The dividend yield of 3.55% is supported, but cautious monitoring of cash flow and leverage is advisable.
Which one has the best ratios?
Both companies have slightly unfavorable overall ratio assessments, but WEC presents stronger profitability with a higher net margin and return on equity, while Exelon offers a better dividend yield. Liquidity and asset turnover metrics are weak for both, suggesting neither clearly outperforms in all key financial ratios.
Strategic Positioning
This section compares the strategic positioning of Exelon Corporation and WEC Energy Group, including market position, key segments, and exposure to technological disruption:
Exelon Corporation
- Large market cap of 43.8B in regulated electric sector with moderate competitive pressure.
- Diverse revenue streams from multiple utility subsidiaries across electricity and gas segments.
- Exposure to various energy sources including nuclear, fossil, wind, hydro, biomass, and solar generation.
WEC Energy Group, Inc.
- Market cap of 33.5B in regulated electric sector facing similar competitive conditions.
- Focused on regulated natural gas and electricity with six defined operating segments.
- Generates electricity from coal, natural gas, oil, hydro, wind, solar, and biomass sources.
Exelon Corporation vs WEC Energy Group, Inc. Positioning
Exelon exhibits a diversified portfolio across many subsidiaries and energy types, while WEC concentrates on regulated utilities with defined geographic segments. Exelon’s broader scope offers varied business drivers; WEC’s focused approach emphasizes regional regulated operations.
Which has the best competitive advantage?
Both companies show slightly unfavorable economic moats, shedding value but with growing profitability. Neither demonstrates a strong competitive advantage based on ROIC versus WACC during 2020-2024.
Stock Comparison
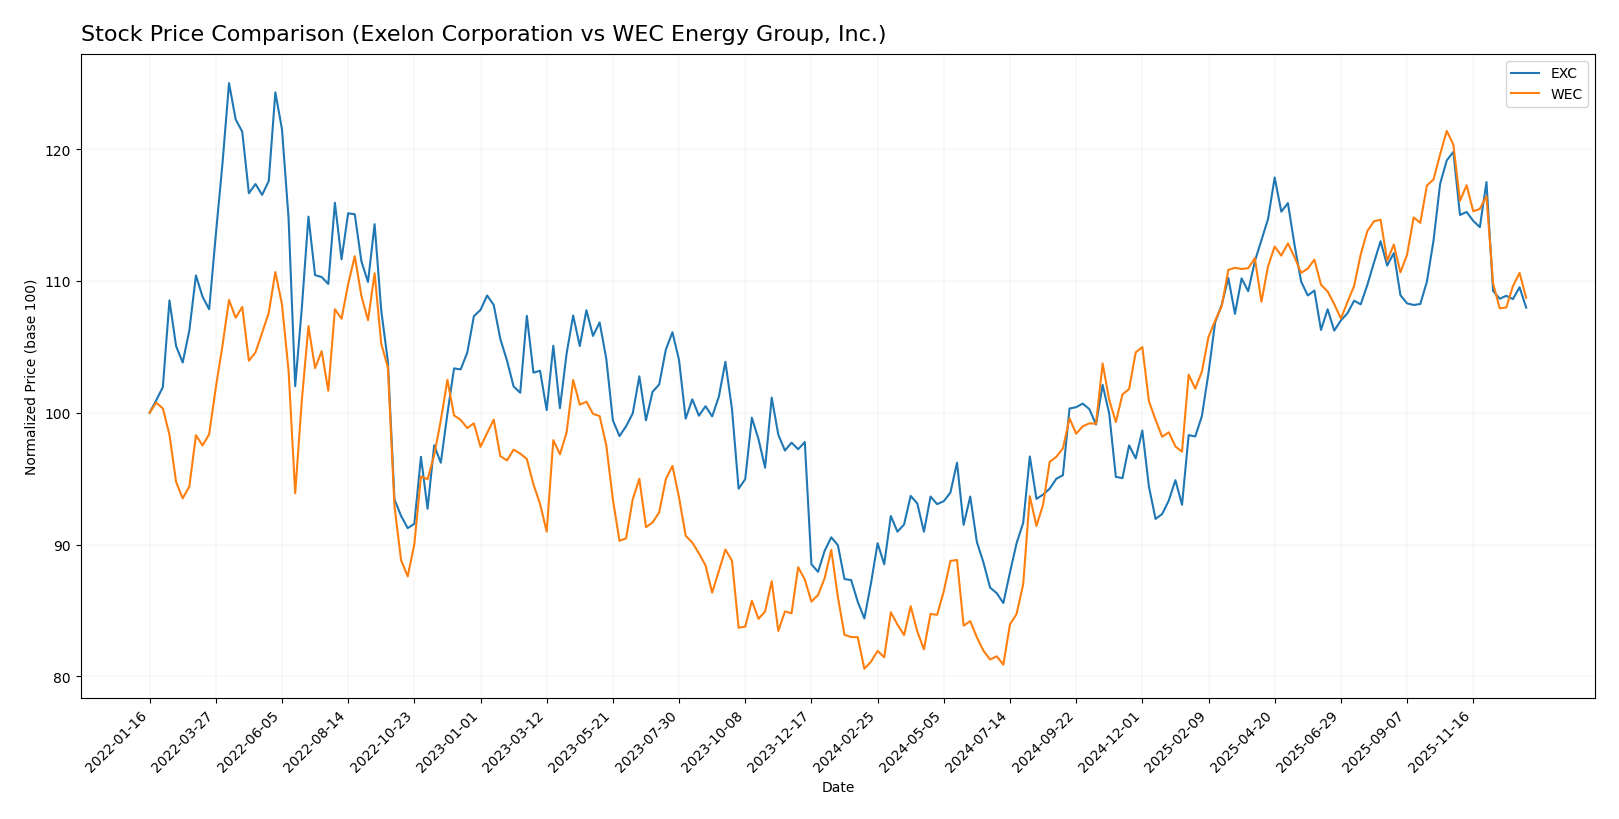
The stock price movements of Exelon Corporation (EXC) and WEC Energy Group, Inc. (WEC) over the past 12 months reveal strong bullish trends with recent deceleration and a slight downturn in the last quarter, reflecting evolving trading dynamics.
Trend Analysis
Exelon Corporation’s stock rose by 24.03% over the past year, indicating a bullish trend with deceleration. The price ranged from a low of 34.31 to a high of 48.04, with recent months showing a 9.87% decline.
WEC Energy Group’s stock increased by 34.05% in the last year, also bullish with deceleration. It experienced a wider price range from 77.85 to 116.84 and a recent 9.65% drop, signaling a sharper downward slope.
Comparing both, WEC delivered the highest market performance over the year, outperforming EXC by nearly 10 percentage points, despite similar recent downward trends.
Target Prices
Analysts provide a clear target price consensus for both Exelon Corporation and WEC Energy Group, reflecting positive outlooks.
| Company | Target High | Target Low | Consensus |
|---|---|---|---|
| Exelon Corporation | 57 | 39 | 50.86 |
| WEC Energy Group, Inc. | 136 | 105 | 122.67 |
The target consensus prices for Exelon and WEC suggest upside potential compared to current prices of 43.3 and 104.65 respectively, indicating moderate to strong analyst confidence in future gains.
Analyst Opinions Comparison
This section compares analysts’ ratings and grades for Exelon Corporation and WEC Energy Group, Inc.:
Rating Comparison
EXC Rating
- Rating: B, considered very favorable by analysts.
- Discounted Cash Flow Score: Moderate at 3, indicating fair valuation.
- ROE Score: Moderate at 3, showing average efficiency in generating profit.
- ROA Score: Moderate at 3, reflecting average asset utilization effectiveness.
- Debt To Equity Score: Moderate at 2, reflecting balanced financial risk.
- Overall Score: Moderate at 3, summarizing average financial standing.
WEC Rating
- Rating: B-, also considered very favorable by analysts.
- Discounted Cash Flow Score: Very unfavorable at 1, suggesting possible overvaluation.
- ROE Score: Favorable at 4, indicating strong profit generation from equity.
- ROA Score: Favorable at 4, showing effective asset use for earnings.
- Debt To Equity Score: Moderate at 2, indicating similar financial risk profile.
- Overall Score: Moderate at 3, summarizing average financial standing.
Which one is the best rated?
Based strictly on the provided data, EXC holds a slightly higher overall rating (B vs. B-). WEC outperforms EXC in ROE and ROA scores, but EXC has a significantly better discounted cash flow score, balancing valuation considerations. Both have moderate overall scores.
Scores Comparison
The comparison of the Altman Z-Score and Piotroski Score for Exelon Corporation and WEC Energy Group, Inc. is as follows:
EXC Scores
- Altman Z-Score: 0.78, indicating financial distress.
- Piotroski Score: 5, reflecting average financial health.
WEC Scores
- Altman Z-Score: 1.14, still in financial distress.
- Piotroski Score: 6, reflecting average financial health.
Which company has the best scores?
WEC has slightly higher scores than EXC in both Altman Z-Score and Piotroski Score, indicating marginally better financial health. Both remain in the distress zone, with average Piotroski scores.
Grades Comparison
Here is the detailed comparison of grades assigned to Exelon Corporation and WEC Energy Group, Inc.:
Exelon Corporation Grades
The following table summarizes recent ratings from reputable grading companies for Exelon Corporation:
| Grading Company | Action | New Grade | Date |
|---|---|---|---|
| UBS | Maintain | Neutral | 2025-12-17 |
| JP Morgan | Maintain | Neutral | 2025-12-12 |
| Morgan Stanley | Maintain | Equal Weight | 2025-10-22 |
| Keybanc | Maintain | Underweight | 2025-10-15 |
| Jefferies | Maintain | Buy | 2025-10-15 |
| Barclays | Maintain | Overweight | 2025-10-14 |
| UBS | Maintain | Neutral | 2025-10-10 |
| Morgan Stanley | Maintain | Equal Weight | 2025-09-25 |
| Keybanc | Maintain | Underweight | 2025-07-16 |
| UBS | Maintain | Neutral | 2025-07-11 |
Exelon’s grades show a mixed pattern with several neutral and hold-type recommendations alongside some overweight and buy ratings, indicating a balanced market view.
WEC Energy Group, Inc. Grades
The following table presents recent ratings from recognized grading firms for WEC Energy Group, Inc.:
| Grading Company | Action | New Grade | Date |
|---|---|---|---|
| B of A Securities | Maintain | Neutral | 2025-12-31 |
| UBS | Maintain | Neutral | 2025-12-17 |
| Barclays | Maintain | Underweight | 2025-12-16 |
| Keybanc | Maintain | Overweight | 2025-12-12 |
| JP Morgan | Maintain | Neutral | 2025-12-11 |
| Scotiabank | Maintain | Sector Outperform | 2025-10-31 |
| BMO Capital | Maintain | Market Perform | 2025-10-21 |
| Barclays | Maintain | Equal Weight | 2025-10-21 |
| Keybanc | Maintain | Overweight | 2025-10-15 |
| UBS | Maintain | Neutral | 2025-10-10 |
WEC Energy Group’s grades indicate a similarly mixed outlook, with many neutral and hold recommendations, but also some overweight and sector outperform ratings, reflecting moderate confidence.
Which company has the best grades?
Both Exelon Corporation and WEC Energy Group, Inc. have predominantly hold or neutral consensus ratings with a few buy and overweight opinions. Exelon shows slightly more buy-grade instances, while WEC combines overweight and sector outperform grades. For investors, these patterns suggest comparable market sentiment with nuanced differences in risk and potential reward profiles.
Strengths and Weaknesses
Below is a comparison of key strengths and weaknesses for Exelon Corporation (EXC) and WEC Energy Group, Inc. (WEC) based on their recent financial and operational data.
| Criterion | Exelon Corporation (EXC) | WEC Energy Group, Inc. (WEC) |
|---|---|---|
| Diversification | Highly diversified across multiple utility segments and geographic areas, with strong revenue from Commonwealth Edison and Pepco Holdings. | Focused largely on Wisconsin and Illinois utilities with some non-utility infrastructure exposure. More concentrated geographically. |
| Profitability | Moderate net margin (10.7%) with slightly unfavorable ROIC below WACC, indicating value erosion despite growing profitability. | Higher net margin (17.8%) but ROIC still below WACC; profitability improving but company also shedding value. |
| Innovation | Investment in regulated electric and gas utilities with slower asset turnover; moderate innovation in energy commodities. | Moderate innovation focus on non-utility energy infrastructure; lower asset turnover suggests efficiency challenges. |
| Global presence | Primarily US-based with significant presence in Mid-Atlantic and Midwest regions; no international exposure. | US Midwestern focus, mainly Wisconsin and Illinois; no international operations. |
| Market Share | Strong market share in key service areas like Commonwealth Edison and Baltimore Gas and Electric. | Dominant in Wisconsin market; smaller presence in Illinois and other states. |
Key takeaways: Both companies show slightly unfavorable overall financial health with ROIC under WACC, signaling value destruction risks. EXC offers broader diversification and larger market share, while WEC delivers higher profitability margins. Investors should weigh diversification against profitability trends and monitor ongoing improvements in capital efficiency.
Risk Analysis
Below is a comparative table highlighting key risks for Exelon Corporation (EXC) and WEC Energy Group, Inc. (WEC) based on the most recent data from 2024.
| Metric | Exelon Corporation (EXC) | WEC Energy Group, Inc. (WEC) |
|---|---|---|
| Market Risk | Beta 0.56 (low volatility) | Beta 0.57 (low volatility) |
| Debt level | Debt/Equity 1.73 (high) | Debt/Equity 1.64 (high) |
| Regulatory Risk | Moderate, utility sector heavily regulated | Moderate, subject to evolving energy policies |
| Operational Risk | Asset turnover 0.21, operational efficiency challenges | Asset turnover 0.18, operational constraints |
| Environmental Risk | Exposure to fossil and nuclear generation; transition risk | Mix of renewable and fossil, moderate transition risk |
| Geopolitical Risk | US and Canada operations, relatively stable | US-focused, regional regulatory risks |
Exelon faces significant financial risk indicated by a high debt level and low liquidity ratios, placing it in financial distress per Altman Z-Score (0.78). WEC also shows financial stress but to a lesser degree (Altman Z-Score 1.14). Market volatility is low for both, but regulatory and environmental risks linked to energy transition remain the most impactful uncertainties going forward.
Which Stock to Choose?
Exelon Corporation (EXC) shows a favorable income statement with a 10.68% net margin and positive growth in net income and EPS over the 2020-2024 period. Its financial ratios are slightly unfavorable overall, with some concerns on ROE, asset turnover, and liquidity, while maintaining moderate debt levels and a very favorable B rating.
WEC Energy Group, Inc. (WEC) presents a stronger income profile, with a 17.77% net margin and mostly favorable growth metrics. Its financial ratios are also slightly unfavorable overall but exhibit better ROE and liquidity scores relative to EXC. WEC holds a very favorable B- rating despite some moderate concerns in valuation metrics.
Considering the ratings and overall financial evaluations, WEC might appear more attractive for growth-oriented investors due to its higher profitability and income growth. Conversely, EXC could be more appealing to those seeking a balance of income stability and slightly lower valuation multiples. Both companies show signs of value destruction but improving profitability, suggesting a nuanced choice depending on risk tolerance and investment focus.
Disclaimer: Investment carries a risk of loss of initial capital. The past performance is not a reliable indicator of future results. Be sure to understand risks before making an investment decision.
Go Further
I encourage you to read the complete analyses of Exelon Corporation and WEC Energy Group, Inc. to enhance your investment decisions: