In the evolving landscape of regulated electric utilities, The Southern Company and Exelon Corporation stand out as industry leaders with significant market presence and innovation strategies. Both companies operate diverse energy portfolios, including nuclear and renewables, serving millions of customers across the US. This comparison explores their operational strengths and growth prospects, helping you identify which utility stock aligns best with your investment goals. Let’s discover which company offers the most compelling opportunity.
Table of contents
Companies Overview
I will begin the comparison between The Southern Company and Exelon Corporation by providing an overview of these two companies and their main differences.
The Southern Company Overview
The Southern Company operates in the regulated electric industry, focusing on electricity generation, transmission, and distribution through multiple subsidiaries. It manages diverse power assets, including nuclear, fossil fuel, solar, wind, and hydroelectric facilities, serving about 8.7M electric and gas customers primarily in the southeastern US. The company also offers natural gas pipelines and digital communication services, positioning itself as a multifaceted utility provider headquartered in Atlanta, Georgia.
Exelon Corporation Overview
Exelon Corporation is a utility services holding company engaged in energy generation, delivery, and marketing across the US and Canada. Its portfolio includes nuclear, fossil, wind, hydroelectric, biomass, and solar plants. Exelon serves a broad customer base including utilities, municipalities, and commercial clients, providing electricity, natural gas, and related support services. Headquartered in Chicago, Illinois, it emphasizes integrated energy solutions and operates in regulated electric markets.
Key similarities and differences
Both companies operate within the regulated electric sector and own diversified generation assets across nuclear, fossil, and renewable sources. They provide electricity and natural gas services to residential and commercial customers. However, The Southern Company has a larger market cap and a stronger regional focus in the southeastern US, while Exelon covers a broader geographic area including Canada. Exelon also offers a wider range of support and energy-related services beyond core utility operations.
Income Statement Comparison
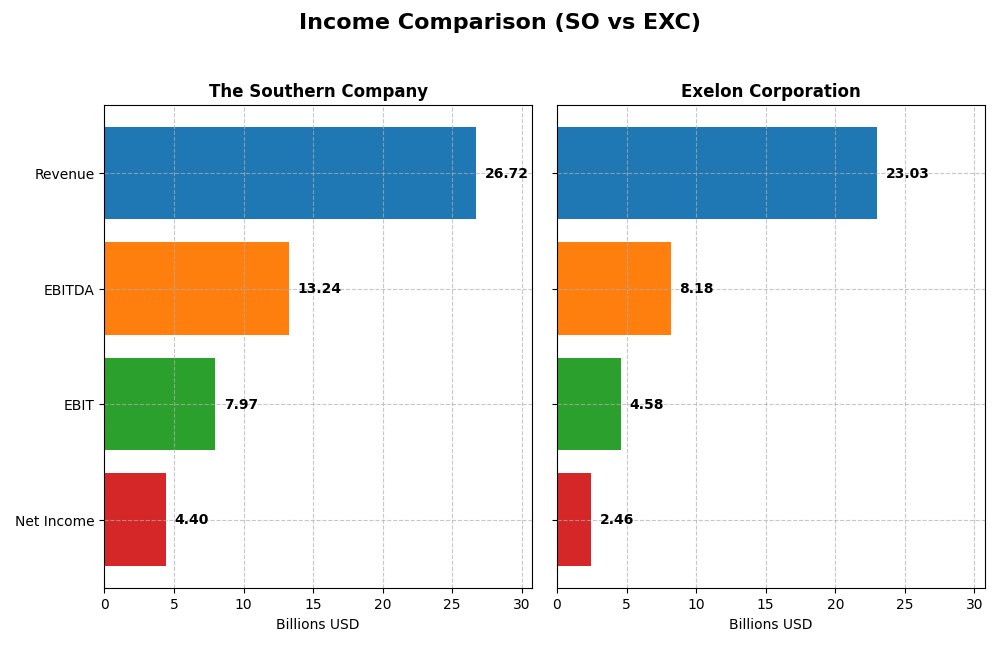
This table provides a side-by-side comparison of key income statement metrics for The Southern Company and Exelon Corporation for the fiscal year 2024, offering insight into their financial performance.
| Metric | The Southern Company | Exelon Corporation |
|---|---|---|
| Market Cap | 95.7B | 43.8B |
| Revenue | 26.7B | 23.0B |
| EBITDA | 13.2B | 8.2B |
| EBIT | 7.97B | 4.58B |
| Net Income | 4.40B | 2.46B |
| EPS | 4.02 | 2.45 |
| Fiscal Year | 2024 | 2024 |
Income Statement Interpretations
The Southern Company
The Southern Company demonstrated a favorable overall trend in revenue and net income, with revenue rising from $20.4B in 2020 to $26.7B in 2024, and net income increasing from $3.1B to $4.4B over the same period. Margins remained strong, with a gross margin near 50% and net margin around 16.5%. In 2024, revenue growth was moderate at 5.8%, while profitability metrics such as EBIT and EPS showed notable improvement.
Exelon Corporation
Exelon’s revenue showed volatility, declining from $33B in 2020 to $23B in 2024, while net income increased from $2B to $2.5B. Gross and EBIT margins were favorable at 40.8% and 19.9%, respectively, though net margin was lower at 10.7%. The latest fiscal year saw modest revenue growth of 6%, but net margin slightly declined, reflecting mixed operational efficiency despite EPS growth of 4.7%.
Which one has the stronger fundamentals?
Both companies exhibit favorable income statement fundamentals, with Southern Company showing stronger revenue and net income growth along with higher margins, especially gross and EBIT margins. Exelon has demonstrated improvement in net margin growth over the period but faces challenges with revenue contraction. Southern Company’s more consistent margin expansion and higher absolute profitability suggest comparatively stronger fundamentals.
Financial Ratios Comparison
The table below presents a side-by-side comparison of key financial ratios for The Southern Company (SO) and Exelon Corporation (EXC), based on their most recent fiscal year data for 2024.
| Ratios | The Southern Company (SO) | Exelon Corporation (EXC) |
|---|---|---|
| ROE | 13.25% | 9.14% |
| ROIC | 4.25% | 3.93% |
| P/E | 20.5 | 15.35 |
| P/B | 2.72 | 1.40 |
| Current Ratio | 0.67 | 0.87 |
| Quick Ratio | 0.46 | 0.78 |
| D/E | 2.00 | 1.73 |
| Debt-to-Assets | 45.7% | 43.3% |
| Interest Coverage | 2.58 | 2.26 |
| Asset Turnover | 0.18 | 0.21 |
| Fixed Asset Turnover | 0.25 | 0.29 |
| Payout Ratio | 67.1% | 61.9% |
| Dividend Yield | 3.27% | 4.04% |
Interpretation of the Ratios
The Southern Company
The Southern Company shows a mixed ratio profile with favorable net margin (16.47%) and WACC (4.96%), yet unfavorable returns on invested capital (4.25%) and liquidity ratios, including a current ratio of 0.67. Leverage is high with a debt-to-equity of 2.0, and asset turnover ratios are weak. The dividend yield is attractive at 3.27%, supported by steady payouts, although coverage by free cash flow may present sustainability concerns.
Exelon Corporation
Exelon Corporation’s ratios also display strengths and weaknesses, with a favorable net margin of 10.68%, low price-to-book ratio of 1.4, and dividend yield of 4.04%. However, returns on equity (9.14%) and invested capital (3.93%) are unfavorable, alongside liquidity ratios below 1 and moderate leverage (debt-to-equity of 1.73). Dividend payments appear supported but free cash flow coverage shows potential risks.
Which one has the best ratios?
Both companies exhibit slightly unfavorable overall ratio profiles. Exelon scores better on favorable ratios (28.57% vs. 21.43%) and has a lower price-to-book ratio, while Southern Company has a higher net margin and return on equity. However, both face challenges in liquidity, asset efficiency, and leverage, requiring careful consideration of their financial stability.
Strategic Positioning
This section compares the strategic positioning of The Southern Company and Exelon Corporation, covering Market position, Key segments, and Exposure to technological disruption:
The Southern Company
- Large market cap of 95.7B in regulated electric sector with moderate competitive pressure
- Diverse segments including gas distribution, marketing, pipelines, electric utilities, and renewable energy projects
- Owns 30 hydroelectric, 24 fossil, 3 nuclear, 45 solar, 15 wind, and battery facilities, indicating moderate exposure to tech disruption
Exelon Corporation
- Market cap 43.8B, also in regulated electric, facing competitive pressure from multiple utilities
- Focused on energy generation, delivery, and marketing with nuclear, fossil, wind, hydro, biomass, solar assets
- Owns diverse generation assets including nuclear, fossil, wind, hydro, biomass, solar, with additional energy-related services
The Southern Company vs Exelon Corporation Positioning
The Southern Company presents a diversified portfolio across gas and electric utilities with significant renewable assets, while Exelon focuses on energy generation and delivery with a broad mix of sources. Southern’s integrated gas operations contrast with Exelon’s utility-centric segments, reflecting varied business drivers and scale.
Which has the best competitive advantage?
Both companies exhibit slightly unfavorable MOAT evaluations, shedding value despite growing ROIC trends. The Southern Company shows less negative ROIC vs WACC than Exelon, suggesting a marginally stronger competitive position but continued challenges in value creation.
Stock Comparison
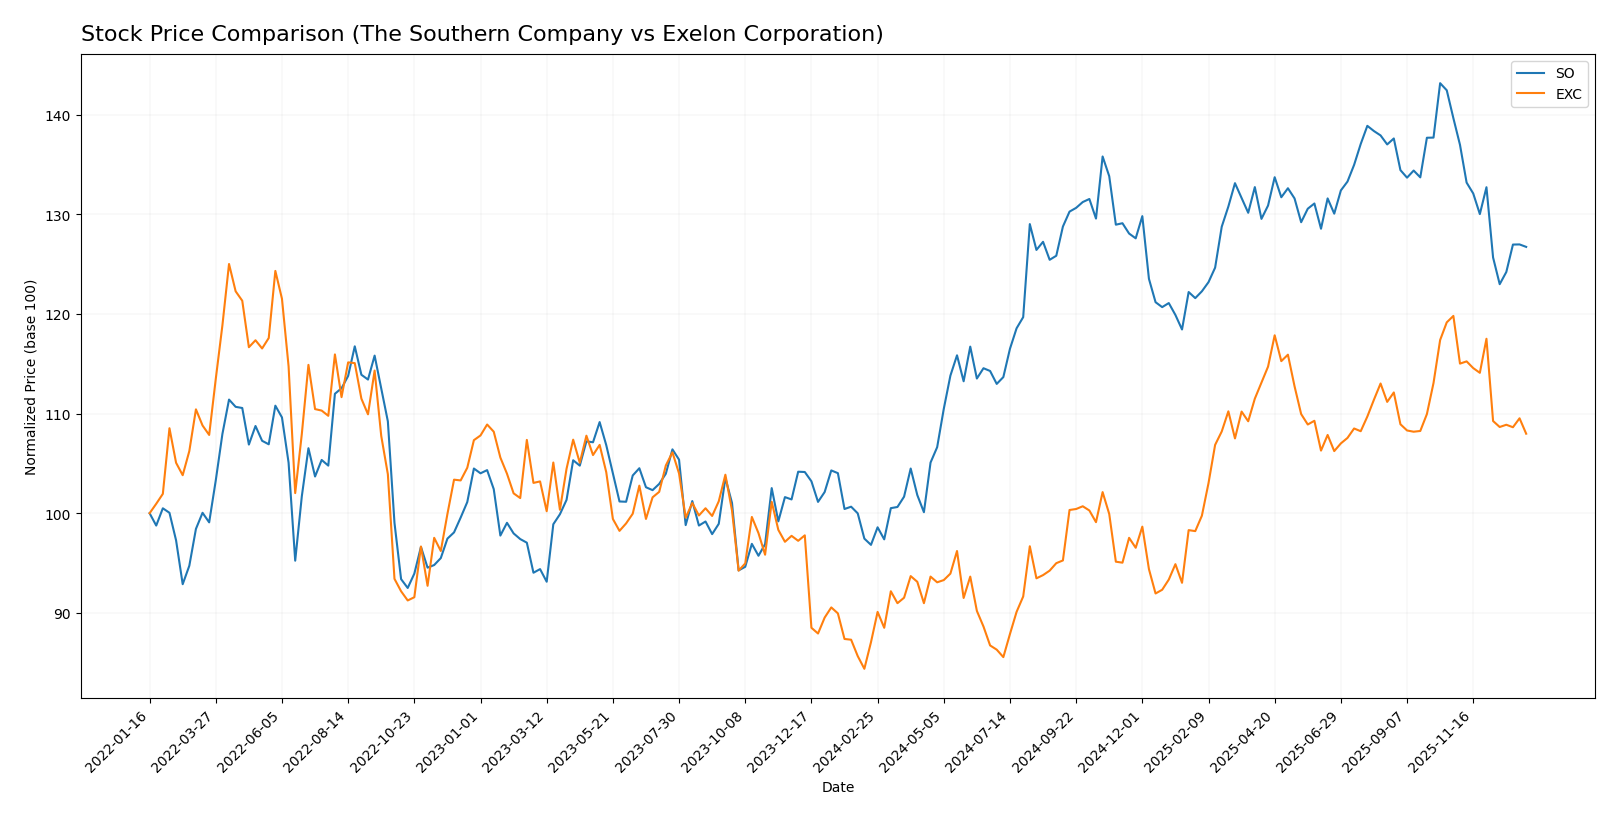
The past year showed significant bullish momentum for both The Southern Company and Exelon Corporation, with notable price gains and a recent deceleration phase in their upward trends.
Trend Analysis
The Southern Company’s stock exhibited a 30.88% increase over the past 12 months, indicating a bullish trend with deceleration. It reached a high of 98.29 and a low of 66.48, showing moderate volatility with a 7.54 standard deviation.
Exelon Corporation’s stock rose by 24.03% in the same period, also reflecting a bullish but decelerating trend. Its price fluctuated between 34.31 and 48.04, with a lower volatility measured by a 3.75 standard deviation.
Comparing the two, The Southern Company outperformed Exelon with a higher overall price increase, despite both experiencing recent negative trends and seller dominance from late 2025 to early 2026.
Target Prices
Analysts present a clear consensus on target prices for The Southern Company and Exelon Corporation.
| Company | Target High | Target Low | Consensus |
|---|---|---|---|
| The Southern Company | 103 | 76 | 93.1 |
| Exelon Corporation | 57 | 39 | 50.86 |
The Southern Company’s consensus target price of 93.1 is moderately above its current price of 87.01, indicating modest upside potential. Exelon’s consensus target at 50.86 also suggests room for growth from its current 43.3 price point, reflecting generally positive analyst expectations.
Analyst Opinions Comparison
This section compares analysts’ ratings and grades for The Southern Company and Exelon Corporation:
Rating Comparison
SO Rating
- Overall rating B- with a very favorable status reflecting solid financials.
- Discounted Cash Flow Score of 3, moderate status assessing valuation fairly.
- Return on Equity Score of 4, favorable status showing efficient profit use.
- Return on Assets Score of 3, moderate status demonstrating average asset use.
- Debt To Equity Score of 1, very unfavorable status indicating higher risk.
- Overall Score of 3, moderate status summarizing financial standing.
EXC Rating
- Overall rating B with very favorable status indicating strong financials.
- Discounted Cash Flow Score of 3, moderate status assessing valuation fairly.
- Return on Equity Score of 3, moderate status indicating average efficiency.
- Return on Assets Score of 3, moderate status demonstrating average asset use.
- Debt To Equity Score of 2, moderate status reflecting better balance sheet.
- Overall Score of 3, moderate status summarizing financial standing.
Which one is the best rated?
Exelon Corporation holds a slightly better overall rating (B) than The Southern Company (B-). SO scores higher in ROE, but EXC has a better debt-to-equity score, indicating lower financial risk. Both share a moderate overall score of 3.
Scores Comparison
Here is a comparison of the financial scores for The Southern Company and Exelon Corporation:
SO Scores
- Altman Z-Score: 0.98, in distress zone indicating high risk
- Piotroski Score: 6, average financial strength
EXC Scores
- Altman Z-Score: 0.78, also in distress zone signaling risk
- Piotroski Score: 5, average financial strength
Which company has the best scores?
Based strictly on the provided data, SO has a slightly higher Altman Z-Score and Piotroski Score than EXC, indicating marginally better financial stability and strength.
Grades Comparison
Here is a comparison of recent grades assigned to The Southern Company and Exelon Corporation by recognized grading companies:
The Southern Company Grades
The table below lists recent grades from major financial institutions for The Southern Company:
| Grading Company | Action | New Grade | Date |
|---|---|---|---|
| UBS | Maintain | Neutral | 2025-12-17 |
| JP Morgan | Maintain | Neutral | 2025-12-15 |
| Jefferies | Maintain | Neutral | 2025-12-15 |
| RBC Capital | Maintain | Sector Perform | 2025-12-12 |
| Keybanc | Maintain | Underweight | 2025-12-12 |
| Mizuho | Maintain | Neutral | 2025-12-11 |
| Barclays | Maintain | Equal Weight | 2025-11-20 |
| Jefferies | Downgrade | Neutral | 2025-11-05 |
| Ladenburg Thalmann | Downgrade | Neutral | 2025-10-17 |
| Keybanc | Maintain | Underweight | 2025-10-15 |
Overall, grades for The Southern Company have mostly remained neutral or hold-equivalent, with some underweight ratings and recent downgrades limiting upside sentiment.
Exelon Corporation Grades
Below are the recent grades from major institutions for Exelon Corporation:
| Grading Company | Action | New Grade | Date |
|---|---|---|---|
| UBS | Maintain | Neutral | 2025-12-17 |
| JP Morgan | Maintain | Neutral | 2025-12-12 |
| Morgan Stanley | Maintain | Equal Weight | 2025-10-22 |
| Keybanc | Maintain | Underweight | 2025-10-15 |
| Jefferies | Maintain | Buy | 2025-10-15 |
| Barclays | Maintain | Overweight | 2025-10-14 |
| UBS | Maintain | Neutral | 2025-10-10 |
| Morgan Stanley | Maintain | Equal Weight | 2025-09-25 |
| Keybanc | Maintain | Underweight | 2025-07-16 |
| UBS | Maintain | Neutral | 2025-07-11 |
Exelon Corporation’s grades show a balance of neutral, equal weight, and some buy/overweight ratings, indicating a slightly more positive outlook compared to peers.
Which company has the best grades?
Exelon Corporation has received generally more favorable grades, including buy and overweight ratings, compared to The Southern Company’s mostly neutral and underweight assessments. This suggests investors might view Exelon’s prospects as somewhat stronger or more growth-oriented.
Strengths and Weaknesses
Below is a comparative overview of the key strengths and weaknesses of The Southern Company (SO) and Exelon Corporation (EXC) based on recent financial and operational data.
| Criterion | The Southern Company (SO) | Exelon Corporation (EXC) |
|---|---|---|
| Diversification | Strong in gas distribution with $4.46B in 2024, moderate electric utilities exposure | Diverse energy portfolio with strong regulated electric and gas segments, $6.45B in Pepco Holdings 2024 revenue |
| Profitability | Net margin 16.47% (favorable), ROIC 4.25% (unfavorable, below WACC) | Net margin 10.68% (favorable), ROIC 3.93% (unfavorable, below WACC) |
| Innovation | Moderate innovation, steady ROIC growth but still value destroying | Significant ROIC growth near 100%, improving profitability despite current value destruction |
| Global presence | Primarily US-focused utilities, limited global footprint | US-centered utilities, no significant international presence |
| Market Share | Leading in gas distribution and electric utilities in southeastern US | Leading in multiple regional utilities with strong market share in mid-Atlantic and Midwest |
Key takeaways: Both SO and EXC currently destroy value as their ROICs fall below WACC, but both show promising ROIC growth trends. SO has stronger profitability margins and dividend yield, while EXC demonstrates more robust diversification and accelerating profitability. Investors should weigh growth potential against current value destruction and sector risks.
Risk Analysis
Below is a comparative risk profile table for The Southern Company (SO) and Exelon Corporation (EXC) based on the most recent data from 2024:
| Metric | The Southern Company (SO) | Exelon Corporation (EXC) |
|---|---|---|
| Market Risk | Low beta (0.447), stable price range | Moderate beta (0.556), slightly wider price range |
| Debt level | High debt-to-equity (2.0, unfavorable) | High debt-to-equity (1.73, unfavorable) |
| Regulatory Risk | Moderate, utilities sector heavily regulated | Moderate, similar regulatory environment |
| Operational Risk | Diverse generation mix, some asset turnover concerns | Diverse energy mix, asset turnover slightly better |
| Environmental Risk | Transition to renewables underway but fossil fuel exposure remains | Similar renewable efforts but with nuclear focus |
| Geopolitical Risk | US-centric operations, limited exposure | US and Canada operations, slightly broader exposure |
Synthesis: Both SO and EXC face moderate financial risk due to high leverage and liquidity concerns, placing them in a distress zone per Altman Z-scores. Market risk is controlled with low to moderate volatility. Regulatory and environmental risks remain significant due to the energy transition and stringent utility regulations. Operational risks stem from asset efficiency and generation mix. Exelon’s broader North American presence adds slight geopolitical complexity. Investors should weigh the impact of debt and regulatory shifts carefully.
Which Stock to Choose?
The Southern Company (SO) shows favorable income growth with a 31.16% revenue increase over five years and strong profitability indicators like a 16.47% net margin. However, its financial ratios reveal a mixed picture, with several unfavorable metrics including a high debt-to-equity ratio of 2.0 and low liquidity ratios. Its rating stands at B- with moderate overall scores, and the company is shedding value as ROIC remains below WACC despite a rising trend.
Exelon Corporation (EXC) presents steady income with a 25.32% net income growth over five years and a 10.68% net margin. Financial ratios are slightly unfavorable overall but include a favorable price-to-book ratio of 1.4 and good dividend yield at 4.04%. EXC’s rating is B, also moderate overall, and it is similarly shedding value with ROIC below WACC, though profitability shows improvement.
For investors prioritizing growth and robust profitability, The Southern Company might appear more favorable given its stronger income growth and higher net margin despite its heavier debt load. Conversely, those inclined toward a company with a more balanced financial structure and higher dividend yield may find Exelon Corporation’s profile more appealing. Both companies exhibit slightly unfavorable financial ratios and value destruction, suggesting cautious evaluation relative to investor risk tolerance and strategy.
Disclaimer: Investment carries a risk of loss of initial capital. The past performance is not a reliable indicator of future results. Be sure to understand risks before making an investment decision.
Go Further
I encourage you to read the complete analyses of The Southern Company and Exelon Corporation to enhance your investment decisions: