Exelon Corporation (EXC) and Public Service Enterprise Group Incorporated (PEG) are two leading players in the regulated electric utility sector in the United States. Both companies focus on energy generation and distribution, with strong commitments to innovation in renewable energy and infrastructure modernization. Their overlapping markets and strategic approaches make them natural competitors in the utilities space. In this article, I will help you determine which company presents the most compelling investment opportunity today.
Table of contents
Companies Overview
I will begin the comparison between Exelon Corporation and Public Service Enterprise Group Incorporated by providing an overview of these two companies and their main differences.
Exelon Overview
Exelon Corporation is a utility services holding company engaged in energy generation, delivery, and marketing across the US and Canada. It owns diverse generating facilities including nuclear, fossil, wind, hydroelectric, biomass, and solar. Exelon also sells electricity and natural gas to wholesale and retail customers and offers various support services such as legal, IT, and asset management. The company is headquartered in Chicago and employs about 20,000 people.
Public Service Enterprise Group Overview
Public Service Enterprise Group Incorporated operates primarily in the Northeastern and Mid-Atlantic US through its subsidiaries PSE&G and PSEG Power. It transmits and distributes electricity and gas to residential, commercial, and industrial customers, invests in solar projects, and provides appliance services. PSEG maintains extensive electric transmission and gas distribution infrastructure. The company is based in Newark, New Jersey, with around 13,000 employees.
Key similarities and differences
Both companies operate in the regulated electric utilities sector and provide electricity and gas services to a variety of customer segments. Exelon has a broader geographic footprint including Canada and a more diversified generation portfolio with nuclear and renewable sources, while PSEG focuses on the Northeastern and Mid-Atlantic US with significant infrastructure assets. Both offer energy-related services but differ in scale and operational scope.
Income Statement Comparison
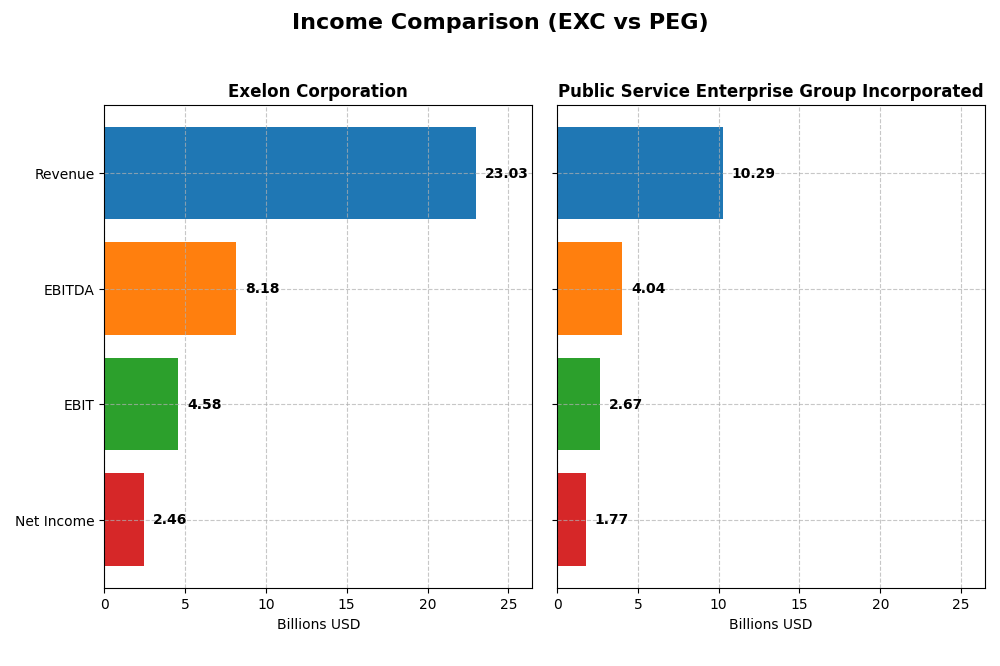
This table provides a side-by-side comparison of key income statement metrics for Exelon Corporation and Public Service Enterprise Group Incorporated for the fiscal year 2024.
| Metric | Exelon Corporation (EXC) | Public Service Enterprise Group (PEG) |
|---|---|---|
| Market Cap | 43.8B | 39.3B |
| Revenue | 23.0B | 10.3B |
| EBITDA | 8.18B | 4.04B |
| EBIT | 4.58B | 2.67B |
| Net Income | 2.46B | 1.77B |
| EPS | 2.45 | 3.56 |
| Fiscal Year | 2024 | 2024 |
Income Statement Interpretations
Exelon Corporation
Exelon’s revenue showed a mixed trend from 2020 to 2024, declining overall by 30.3% but increasing 6% in the latest year. Net income grew positively by 25.3% over the period, reaching $2.46B in 2024. Margins remained strong, with a gross margin of 40.8% and a net margin near 10.7%. The recent year saw stable margin levels despite slight net margin contraction.
Public Service Enterprise Group Incorporated
PSEG experienced moderate revenue growth of 7.15% over 2020-2024 but faced an 8.4% decline in 2024 alone. Net income declined by 7% overall, dropping to $1.77B in 2024. Although gross and EBIT margins stayed favorable at 34.4% and 25.9%, respectively, all growth metrics, including EPS and net margin, weakened significantly in the latest year, indicating operational pressures.
Which one has the stronger fundamentals?
Exelon presents stronger fundamentals with favorable margin improvements and net income growth overall, despite revenue fluctuations. PSEG’s financials show weakening profitability and consistent unfavorable growth trends, particularly in the latest year. Exelon’s higher margin stability and positive earnings trajectory contrast with PSEG’s recent operational challenges.
Financial Ratios Comparison
The table below presents a comparison of key financial ratios for Exelon Corporation (EXC) and Public Service Enterprise Group Incorporated (PEG) based on the most recent fiscal year 2024 data.
| Ratios | Exelon Corporation (EXC) | Public Service Enterprise Group (PEG) |
|---|---|---|
| ROE | 9.14% | 11.00% |
| ROIC | 3.93% | 4.40% |
| P/E | 15.35 | 23.74 |
| P/B | 1.40 | 2.61 |
| Current Ratio | 0.87 | 0.65 |
| Quick Ratio | 0.78 | 0.48 |
| D/E (Debt-to-Equity) | 1.73 | 1.42 |
| Debt-to-Assets | 43.28% | 41.89% |
| Interest Coverage | 2.26 | 2.80 |
| Asset Turnover | 0.21 | 0.19 |
| Fixed Asset Turnover | 0.29 | 0.26 |
| Payout ratio | 61.95% | 67.49% |
| Dividend yield | 4.04% | 2.84% |
Interpretation of the Ratios
Exelon Corporation
Exelon shows mixed financial ratios with favorable net margin (10.68%) and dividend yield (4.04%), but weaker metrics in return on equity (9.14%), return on invested capital (3.93%), and liquidity ratios below 1, indicating potential short-term financial stress. The payout ratio appears sustainable given the dividend per share trend, yet free cash flow coverage is negative, suggesting caution around dividend and buyback sustainability.
Public Service Enterprise Group Incorporated
Public Service Enterprise Group presents a stronger net margin (17.22%) and a higher return on equity (11.0%), though its return on invested capital (4.4%) and liquidity ratios are also below 1, indicating some operational and short-term liquidity concerns. The company pays dividends with a 2.84% yield, supported by moderate payout ratios, but free cash flow remains negative, which may affect long-term distribution capacity.
Which one has the best ratios?
Both companies face liquidity challenges and unfavorable asset turnover ratios, but Public Service Enterprise Group has a stronger net margin and return on equity while maintaining a reasonable dividend yield. Exelon benefits from a higher dividend yield but exhibits lower returns and more unfavorable leverage and liquidity metrics. Overall, neither shows a distinctly superior ratio profile.
Strategic Positioning
This section compares the strategic positioning of Exelon Corporation and Public Service Enterprise Group, including market position, key segments, and exposure to disruption:
Exelon Corporation
- Large market cap of 43.8B in regulated electric utilities, facing moderate competitive pressure.
- Diverse key segments including nuclear, fossil, wind, hydroelectric, biomass, solar, and multiple retail and wholesale energy services.
- Exposure to technological disruption through renewable energy investments and various generation technologies.
Public Service Enterprise Group
- Market cap of 39.3B focused on regulated electric in Northeast and Mid-Atlantic US.
- Operates mainly through PSE&G and PSEG Power, focusing on electricity and gas transmission, distribution, and solar projects.
- Invests in solar generation projects and energy efficiency programs, integrating technology in transmission and distribution.
Exelon Corporation vs Public Service Enterprise Group Positioning
Exelon exhibits a diversified energy portfolio across multiple generation types and services, while Public Service Enterprise Group concentrates on regional electricity and gas transmission with solar investments. Exelon’s broader segment exposure contrasts with PSEG’s regional focus.
Which has the best competitive advantage?
Both companies are shedding value with ROIC below WACC but show growing profitability trends. Their competitive advantages are slightly unfavorable, reflecting challenges in value creation despite improving returns on invested capital.
Stock Comparison
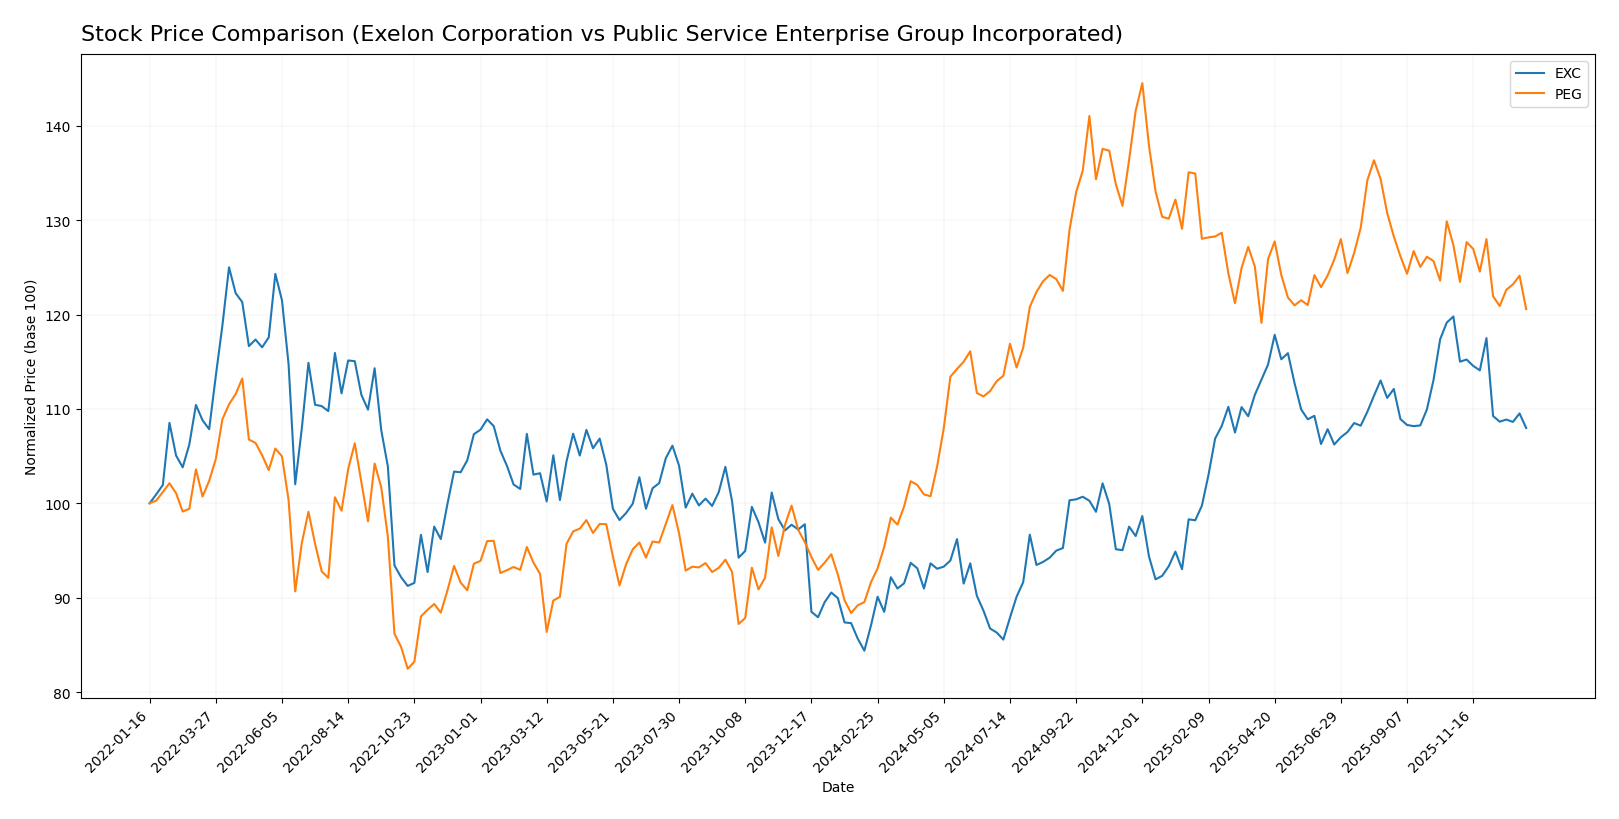
Over the past 12 months, both Exelon Corporation (EXC) and Public Service Enterprise Group Incorporated (PEG) exhibited bullish trends with decelerating momentum, reaching notable highs and lows while experiencing recent downward corrections in price.
Trend Analysis
Exelon’s stock price increased by 24.03% over the past year, indicating a bullish trend with deceleration. The highest price reached 48.04, the lowest was 34.31, and recent weeks showed a 9.87% decline.
Public Service Enterprise Group’s stock rose 31.59% over the same period, also bullish with deceleration. It recorded a high of 94.3 and a low of 59.79, followed by a recent 5.33% drop.
Comparing the two, PEG delivered the highest market performance over the year with a 31.59% increase, outperforming EXC’s 24.03% gain.
Target Prices
Analysts provide a clear target price consensus for both Exelon Corporation and Public Service Enterprise Group Incorporated.
| Company | Target High | Target Low | Consensus |
|---|---|---|---|
| Exelon Corporation | 57 | 39 | 50.86 |
| Public Service Enterprise Group Incorporated | 98 | 83 | 89 |
The target consensus for Exelon at $50.86 suggests potential upside from the current price of $43.3, while Public Service Enterprise Group’s target consensus at $89 indicates room for growth above its current price of $78.68. Overall, analysts expect moderate appreciation for both stocks.
Analyst Opinions Comparison
This section compares analysts’ ratings and grades for Exelon Corporation and Public Service Enterprise Group Incorporated:
Rating Comparison
EXC Rating
- Rating: B, classified as Very Favorable by analysts.
- Discounted Cash Flow Score: Moderate at 3, indicating balanced valuation.
- ROE Score: Moderate at 3, reflecting average efficiency in generating profit.
- ROA Score: Moderate at 3, showing average asset utilization.
- Debt To Equity Score: Moderate at 2, implying moderate financial risk.
- Overall Score: Moderate at 3, summarizing the company’s financial standing.
PEG Rating
- Rating: B-, also classified as Very Favorable.
- Discounted Cash Flow Score: Very Unfavorable at 1, suggesting potential overvaluation concerns.
- ROE Score: Favorable at 4, indicating higher efficiency in profit generation.
- ROA Score: Favorable at 4, demonstrating better asset utilization.
- Debt To Equity Score: Moderate at 2, similarly indicating moderate financial risk.
- Overall Score: Moderate at 3, reflecting a comparable overall financial assessment.
Which one is the best rated?
Based strictly on the provided data, Exelon holds a slightly higher rating of B compared to PEG’s B-. However, PEG outperforms Exelon in ROE and ROA scores, while Exelon has a significantly better discounted cash flow score. Both share similar debt-to-equity and overall scores.
Scores Comparison
Here is a comparison of the Altman Z-Score and Piotroski Score for Exelon Corporation and Public Service Enterprise Group Incorporated:
EXC Scores
- Altman Z-Score: 0.78, in distress zone indicating financial risk.
- Piotroski Score: 5, average financial strength.
PEG Scores
- Altman Z-Score: 1.32, also in distress zone but higher than EXC.
- Piotroski Score: 7, strong financial health compared to EXC.
Which company has the best scores?
Based on the provided data, PEG shows a higher Piotroski Score, indicating stronger financial health, while both are in the Altman distress zone with PEG having a slightly better score. PEG’s scores suggest relatively better financial stability than EXC.
Grades Comparison
Here is a comparison of the recent grades assigned to the two companies by reputable financial institutions:
Exelon Corporation Grades
The following table summarizes recent grades for Exelon Corporation from well-known grading companies:
| Grading Company | Action | New Grade | Date |
|---|---|---|---|
| UBS | Maintain | Neutral | 2025-12-17 |
| JP Morgan | Maintain | Neutral | 2025-12-12 |
| Morgan Stanley | Maintain | Equal Weight | 2025-10-22 |
| Keybanc | Maintain | Underweight | 2025-10-15 |
| Jefferies | Maintain | Buy | 2025-10-15 |
| Barclays | Maintain | Overweight | 2025-10-14 |
| UBS | Maintain | Neutral | 2025-10-10 |
| Morgan Stanley | Maintain | Equal Weight | 2025-09-25 |
| Keybanc | Maintain | Underweight | 2025-07-16 |
| UBS | Maintain | Neutral | 2025-07-11 |
Exelon’s grades primarily show a stable outlook with neutral to hold-equivalent ratings, alongside some buy and overweight positions, indicating mixed analyst sentiment.
Public Service Enterprise Group Incorporated Grades
Below are the recent grades issued to Public Service Enterprise Group by recognized grading companies:
| Grading Company | Action | New Grade | Date |
|---|---|---|---|
| Ladenburg Thalmann | Upgrade | Buy | 2026-01-07 |
| UBS | Maintain | Buy | 2025-12-17 |
| JP Morgan | Maintain | Overweight | 2025-12-12 |
| Jefferies | Upgrade | Buy | 2025-11-06 |
| TD Cowen | Maintain | Buy | 2025-11-05 |
| BMO Capital | Maintain | Market Perform | 2025-11-04 |
| Barclays | Maintain | Equal Weight | 2025-10-21 |
| BMO Capital | Maintain | Market Perform | 2025-10-20 |
| Morgan Stanley | Maintain | Overweight | 2025-09-25 |
| BMO Capital | Maintain | Market Perform | 2025-08-06 |
Grades for Public Service Enterprise Group indicate a generally positive trend with multiple upgrades and buy ratings, reflecting greater analyst confidence.
Which company has the best grades?
Public Service Enterprise Group has received stronger and more positive grades than Exelon, including several recent upgrades and a consensus “Buy” rating compared to Exelon’s consensus “Hold.” This suggests investors might perceive PEG as having better near-term growth or stability prospects.
Strengths and Weaknesses
Below is a comparative overview of key strengths and weaknesses for Exelon Corporation (EXC) and Public Service Enterprise Group Incorporated (PEG) based on the latest financial and operational data.
| Criterion | Exelon Corporation (EXC) | Public Service Enterprise Group (PEG) |
|---|---|---|
| Diversification | Highly diversified with multiple utility subsidiaries generating stable revenues across electric and gas sectors | Diversified across electric, gas distribution, and transmission, but less revenue spread than EXC |
| Profitability | Moderate net margin at 10.68%, but ROIC at 3.93% below WACC, indicating value destruction despite growth | Higher net margin at 17.22%, ROIC at 4.4% also below WACC; profitability improving but still shedding value |
| Innovation | Incremental innovation with growing ROIC trend, but overall efficiency and asset turnover remain low | Similar growing ROIC trend, yet asset turnover and fixed asset turnover are low, suggesting room for operational improvement |
| Global presence | Primarily focused on U.S. regional utilities, no significant global footprint | Also U.S.-centric with regional focus, limited international exposure |
| Market Share | Large scale with substantial revenues from multiple regulated utilities, e.g., Commonwealth Edison Co at $8.2B | Significant market share in New Jersey with Public Service Electric and Gas Company at $4.0B revenue |
In summary, both companies show strengths in diversification within regional utilities and improving profitability trends. However, they currently operate below their cost of capital, signaling cautious consideration. Operational efficiencies and asset utilization remain areas for improvement. Investors should weigh growth potential against the risk of value destruction.
Risk Analysis
Below is a comparative risk overview of Exelon Corporation (EXC) and Public Service Enterprise Group Incorporated (PEG) based on the most recent 2024 data:
| Metric | Exelon Corporation (EXC) | Public Service Enterprise Group (PEG) |
|---|---|---|
| Market Risk | Beta 0.56 (low volatility) | Beta 0.61 (low volatility) |
| Debt Level | Debt/Equity 1.73 (unfavorable) | Debt/Equity 1.42 (unfavorable) |
| Regulatory Risk | High (regulated electric utility) | High (regulated electric utility) |
| Operational Risk | Moderate (diverse energy sources) | Moderate (regional utility operations) |
| Environmental Risk | Moderate (nuclear + renewables) | Moderate (solar investments + gas distribution) |
| Geopolitical Risk | Low (US/Canada focused) | Low (Northeastern US focused) |
The most impactful risks for both companies are their relatively high debt levels and regulatory exposure inherent to utilities. Exelon’s diverse generation portfolio and PEG’s regional focus moderate operational and environmental risks. Both show low market volatility and limited geopolitical concerns. Recent financial distress signals from Altman Z-Scores advise caution despite stable dividend yields.
Which Stock to Choose?
Exelon Corporation (EXC) shows a favorable income statement with improving profitability but faces slight financial challenges, including a high net debt to EBITDA of 5.66 and an overall slightly unfavorable financial ratios profile. Its rating is very favorable with a “B” grade, though some ratios such as ROE and asset turnover are unfavorable.
Public Service Enterprise Group Incorporated (PEG) presents a mixed income picture with several unfavorable growth metrics recently, but maintains a slightly unfavorable financial ratios profile with somewhat better return on equity and assets. Its rating is very favorable with a “B-” grade, supported by strong Piotroski scores despite Altman Z-Score in the distress zone.
For investors, the choice might depend on risk tolerance and investment focus: those inclined toward growth could find PEG’s stronger ROE and favorable profitability metrics appealing, while investors prioritizing income statement stability and dividend yield might lean toward EXC’s consistent profitability despite its higher leverage. Both companies show signs of value destruction but with improving profitability, suggesting cautious consideration.
Disclaimer: Investment carries a risk of loss of initial capital. The past performance is not a reliable indicator of future results. Be sure to understand risks before making an investment decision.
Go Further
I encourage you to read the complete analyses of Exelon Corporation and Public Service Enterprise Group Incorporated to enhance your investment decisions: