In the evolving utilities sector, Exelon Corporation (EXC) and PPL Corporation (PPL) stand out as key players shaping the future of regulated electric services. Both companies operate extensive energy generation and delivery networks, with overlapping markets and innovative approaches to sustainable energy. This comparison will help investors understand which company offers the most compelling opportunity in terms of growth, stability, and strategic vision. Let’s explore which utility giant deserves a place in your portfolio.
Table of contents
Companies Overview
I will begin the comparison between Exelon Corporation and PPL Corporation by providing an overview of these two companies and their main differences.
Exelon Overview
Exelon Corporation operates as a utility services holding company focused on energy generation, delivery, and marketing in the US and Canada. It owns diverse generating facilities including nuclear, fossil, wind, hydroelectric, biomass, and solar. Exelon also sells electricity and natural gas to wholesale and retail customers while offering various support services. The company is headquartered in Chicago and employs around 20,000 people.
PPL Overview
PPL Corporation is a utility holding company delivering electricity and natural gas primarily in the US and the UK. It operates two main segments: Kentucky Regulated and Pennsylvania Regulated, serving over 2.7M customers across these regions. PPL generates electricity from coal, gas, hydro, and solar sources and sells wholesale electricity to municipalities. The company is based in Allentown, Pennsylvania, with approximately 6,653 employees.
Key similarities and differences
Both Exelon and PPL operate in the regulated electric utility sector, focusing on electricity and natural gas delivery. Exelon has a broader geographic footprint including Canada and a more diversified energy generation mix. In contrast, PPL concentrates on specific US regions and the UK with fewer employees and a smaller market cap of 25.6B versus Exelon’s 43.8B. Their business models share regulated utility operations but differ in scale and geographic scope.
Income Statement Comparison
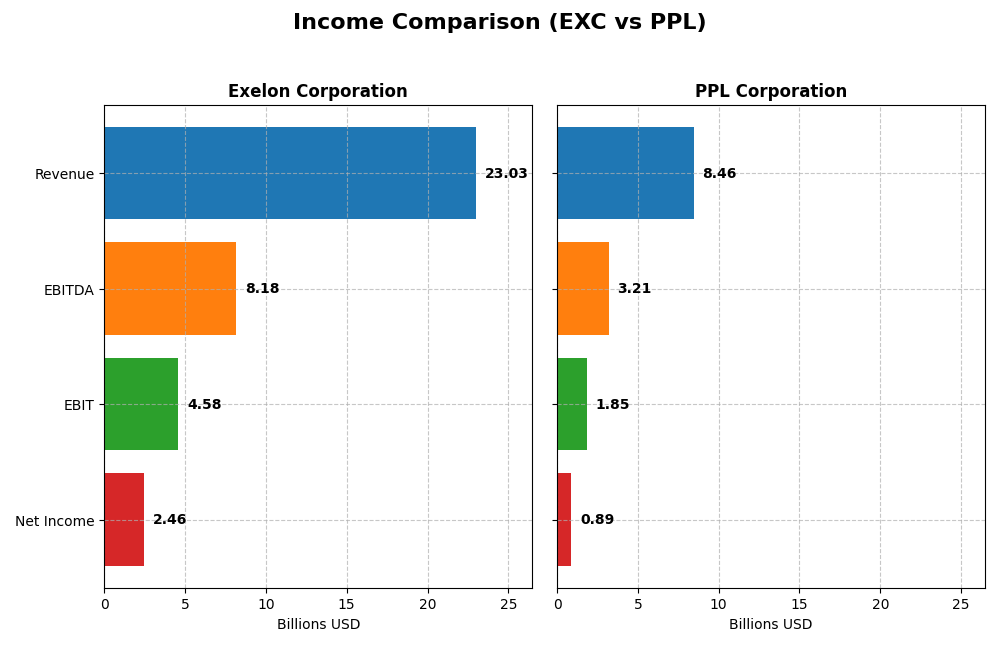
The table below presents a factual comparison of key income statement metrics for fiscal year 2024, highlighting the financial scale and profitability of Exelon Corporation and PPL Corporation.
| Metric | Exelon Corporation | PPL Corporation |
|---|---|---|
| Market Cap | 43.8B | 25.6B |
| Revenue | 23.0B | 8.5B |
| EBITDA | 8.2B | 3.2B |
| EBIT | 4.6B | 1.9B |
| Net Income | 2.5B | 888M |
| EPS | 2.45 | 1.20 |
| Fiscal Year | 2024 | 2024 |
Income Statement Interpretations
Exelon Corporation
Exelon’s revenue showed a mixed trend with a 6% growth in 2024 but a notable overall decline of 30% since 2020. Net income, however, grew by 25% over the same period, reflecting improved profitability. Margins remained strong, with gross and EBIT margins favorable at 40.8% and 19.9%, respectively. In 2024, growth slowed moderately, and net margin slightly contracted by 0.3%.
PPL Corporation
PPL experienced steady revenue growth overall, rising 55% since 2020, but only 1.8% in 2024, indicating slowing momentum. Net income declined sharply by nearly 40% over the period, though it rebounded 17.9% in 2024. Margins were consistent, with a favorable EBIT margin of 21.9% and net margin near 10.5%. The latest year saw improved profitability and EPS growth of 20%.
Which one has the stronger fundamentals?
Exelon demonstrates stronger fundamentals with more consistent net income growth and margin expansion over the long term despite revenue fluctuations. PPL’s revenue growth contrasts with deteriorating net income and margins overall, although recent profitability improvements are evident. Exelon’s higher proportion of favorable income statement metrics supports a more stable earnings profile.
Financial Ratios Comparison
The table below presents key financial ratios for Exelon Corporation (EXC) and PPL Corporation (PPL) based on their most recent fiscal year data from 2024.
| Ratios | Exelon Corporation (EXC) | PPL Corporation (PPL) |
|---|---|---|
| ROE | 9.14% | 6.31% |
| ROIC | 3.93% | 3.59% |
| P/E | 15.35 | 26.97 |
| P/B | 1.40 | 1.70 |
| Current Ratio | 0.87 | 0.86 |
| Quick Ratio | 0.78 | 0.71 |
| D/E (Debt-to-Equity) | 1.73 | 1.19 |
| Debt-to-Assets | 43.28% | 40.92% |
| Interest Coverage | 2.26 | 2.36 |
| Asset Turnover | 0.21 | 0.21 |
| Fixed Asset Turnover | 0.29 | 0.26 |
| Payout Ratio | 61.95% | 84.12% |
| Dividend Yield | 4.04% | 3.12% |
Interpretation of the Ratios
Exelon Corporation
Exelon’s 2024 ratios show a mixed picture with a favorable net margin of 10.68% and a dividend yield of 4.04%. However, key ratios such as ROE at 9.14%, ROIC at 3.93%, and liquidity measures are unfavorable, indicating operational challenges. The company pays dividends with a solid yield, but the somewhat weak coverage ratios warrant attention.
PPL Corporation
PPL’s 2024 ratios also reveal strengths in net margin (10.49%) and dividend yield (3.12%), yet the firm suffers from unfavorable ROE (6.31%) and ROIC (3.59%) alongside a high PE ratio of 26.97. Liquidity ratios remain below 1, signaling potential short-term risk. PPL maintains dividend payments, though higher leverage and valuation raise some concerns.
Which one has the best ratios?
Exelon exhibits a slightly more favorable overall ratio profile than PPL, with a lower PE and stronger dividend yield. Both companies face challenges in profitability ratios and liquidity, but Exelon’s balance of favorable to unfavorable metrics leans modestly better. Nonetheless, neither company presents a clearly dominant ratio advantage.
Strategic Positioning
This section compares the strategic positioning of Exelon Corporation and PPL Corporation, including Market position, Key segments, and Exposure to technological disruption:
Exelon Corporation
- Larger market cap at $43.8B with moderate competitive pressure in regulated electric utilities.
- Diverse energy generation including nuclear, fossil, wind, hydro, biomass, solar; multiple regulated retail segments.
- Exposure includes traditional and renewable energy sources with integrated transmission, distribution, and energy services.
PPL Corporation
- Smaller market cap at $25.6B, focused on regulated electric utilities in US and UK.
- Concentrated on Kentucky and Pennsylvania regulated electricity and natural gas segments.
- Generates electricity mainly from coal, gas, hydro, and solar, focused on regulated markets.
Exelon Corporation vs PPL Corporation Positioning
Exelon shows a diversified energy portfolio across multiple states and technologies, while PPL is more geographically concentrated with regulated electricity and gas segments. Exelon’s broader services contrast with PPL’s focused regional operations, reflecting different scale and scope advantages.
Which has the best competitive advantage?
Both companies show a slightly unfavorable MOAT status, shedding value but with growing profitability. Exelon’s larger scale and diversification suggest more operational complexity, while PPL’s focused approach may limit growth but maintain stable returns.
Stock Comparison
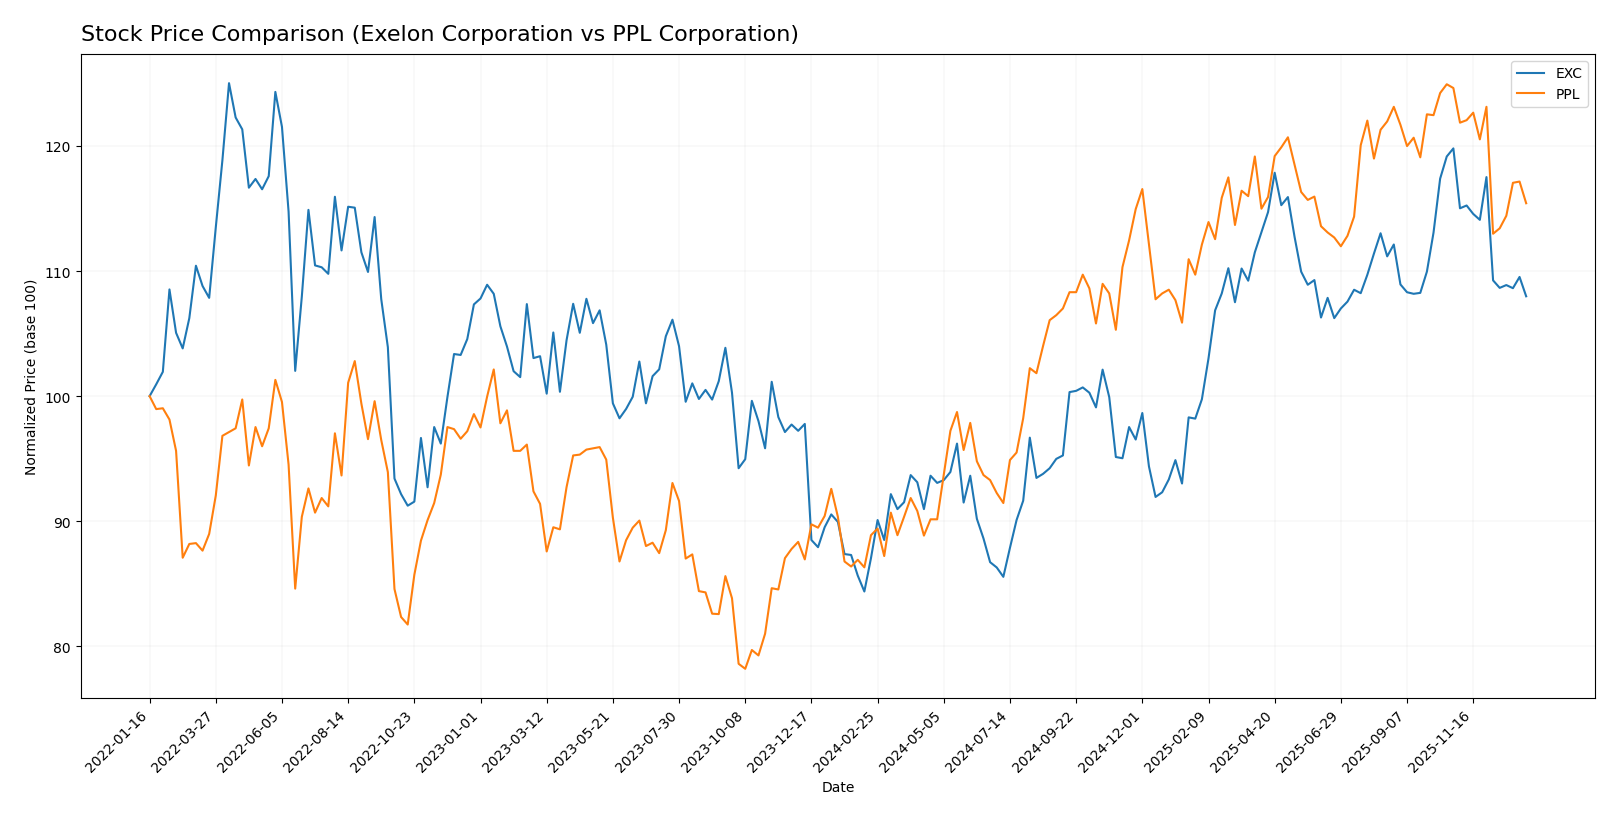
The stock price chart highlights significant bullish trends for both Exelon Corporation and PPL Corporation over the past 12 months, with notable deceleration and recent downward pressure in Q4 2025 to early 2026.
Trend Analysis
Exelon Corporation’s stock showed a 24.03% increase over the past year, indicating a bullish trend with decelerating momentum. The highest price reached 48.04, and the lowest was 34.31, with recent declines of 9.87% from late 2025 to early 2026.
PPL Corporation’s stock rose 29.84% over the same period, also bullish with deceleration. Its price ranged from 26.14 to 37.44. Recently, it experienced a 7.39% decline, reflecting a mild retracement in the last quarter of 2025.
Comparing the two, PPL Corporation delivered higher overall market performance with a 29.84% gain versus Exelon’s 24.03%, despite both facing recent downward trends.
Target Prices
The current analyst consensus presents clear target price ranges for both Exelon Corporation and PPL Corporation.
| Company | Target High | Target Low | Consensus |
|---|---|---|---|
| Exelon Corporation | 57 | 39 | 50.86 |
| PPL Corporation | 45 | 36 | 41.29 |
Analysts expect Exelon’s stock to appreciate significantly above its current price of $43.3, while PPL’s consensus target also suggests upside from its current price of $34.59.
Analyst Opinions Comparison
This section compares analysts’ ratings and grades for Exelon Corporation and PPL Corporation:
Rating Comparison
Exelon Corporation Rating
- Rating: B, regarded as Very Favorable by analysts.
- Discounted Cash Flow Score: 3, showing moderate value.
- ROE Score: 3, reflecting moderate efficiency in profit generation.
- ROA Score: 3, moderate asset utilization effectiveness.
- Debt To Equity Score: 2, moderate financial risk.
- Overall Score: 3, a moderate summary financial standing.
PPL Corporation Rating
- Rating: C+, also considered Very Favorable overall.
- Discounted Cash Flow Score: 1, indicating very unfavorable valuation.
- ROE Score: 3, similarly moderate efficiency.
- ROA Score: 3, on par with Exelon’s asset use.
- Debt To Equity Score: 2, equal moderate risk level.
- Overall Score: 2, slightly lower overall financial assessment.
Which one is the best rated?
Exelon Corporation holds a higher overall rating and better discounted cash flow score compared to PPL Corporation. Both share moderate ROE, ROA, and debt-to-equity scores, but Exelon’s stronger valuation metrics place it above PPL in analyst ratings.
Scores Comparison
The scores comparison between Exelon Corporation (EXC) and PPL Corporation (PPL) is as follows:
EXC Scores
- Altman Z-Score: 0.78, indicating financial distress zone.
- Piotroski Score: 5, reflecting average financial strength.
PPL Scores
- Altman Z-Score: 0.97, also in financial distress zone.
- Piotroski Score: 6, reflecting average financial strength.
Which company has the best scores?
Based strictly on the provided data, PPL has slightly better scores than EXC, with a higher Altman Z-Score and a Piotroski Score one point above, though both remain in the distress and average zones respectively.
Grades Comparison
Here is the comparison of recent grades and ratings for Exelon Corporation and PPL Corporation:
Exelon Corporation Grades
The table below shows recent grades from major financial institutions for Exelon Corporation:
| Grading Company | Action | New Grade | Date |
|---|---|---|---|
| UBS | Maintain | Neutral | 2025-12-17 |
| JP Morgan | Maintain | Neutral | 2025-12-12 |
| Morgan Stanley | Maintain | Equal Weight | 2025-10-22 |
| Keybanc | Maintain | Underweight | 2025-10-15 |
| Jefferies | Maintain | Buy | 2025-10-15 |
| Barclays | Maintain | Overweight | 2025-10-14 |
| UBS | Maintain | Neutral | 2025-10-10 |
| Morgan Stanley | Maintain | Equal Weight | 2025-09-25 |
| Keybanc | Maintain | Underweight | 2025-07-16 |
| UBS | Maintain | Neutral | 2025-07-11 |
Exelon’s grades mostly range between Neutral and Equal Weight, with some Underweight ratings, and a few Buy and Overweight exceptions, indicating a generally cautious sentiment.
PPL Corporation Grades
The table below shows recent grades from major financial institutions for PPL Corporation:
| Grading Company | Action | New Grade | Date |
|---|---|---|---|
| UBS | Maintain | Neutral | 2025-12-17 |
| Wells Fargo | Maintain | Overweight | 2025-12-12 |
| JP Morgan | Maintain | Overweight | 2025-12-11 |
| BMO Capital | Maintain | Outperform | 2025-10-21 |
| B of A Securities | Maintain | Buy | 2025-10-16 |
| Barclays | Maintain | Equal Weight | 2025-10-14 |
| UBS | Maintain | Neutral | 2025-10-10 |
| Morgan Stanley | Maintain | Overweight | 2025-09-25 |
| Barclays | Maintain | Equal Weight | 2025-07-01 |
| Morgan Stanley | Maintain | Overweight | 2025-06-18 |
PPL shows a stronger positive bias with multiple Overweight, Buy, and Outperform ratings, suggesting more favorable analyst sentiment compared to Exelon.
Which company has the best grades?
PPL Corporation has received generally better grades than Exelon Corporation, with more Buy and Overweight ratings versus Exelon’s Neutral and Underweight consensus. This stronger grading trend may imply higher analyst confidence in PPL’s potential, which investors might consider when assessing risk and opportunity.
Strengths and Weaknesses
Below is a comparison of the key strengths and weaknesses of Exelon Corporation (EXC) and PPL Corporation (PPL) based on the most recent data available.
| Criterion | Exelon Corporation (EXC) | PPL Corporation (PPL) |
|---|---|---|
| Diversification | Broad utility segments with strong revenue across multiple regional subsidiaries, including Commonwealth Edison and Pepco Holdings totaling over 20B USD in 2024 | Focused mainly on regulated utilities in Kentucky, Pennsylvania, and Rhode Island with revenues around 8.5B USD in 2024, less diversified geographically |
| Profitability | Net margin at 10.68%, ROIC at 3.93% (below WACC 5%), indicating slight value destruction but improving profitability trends | Net margin close at 10.49%, ROIC 3.59% (below WACC 5.5%), also shedding value but showing growth in ROIC |
| Innovation | Limited data on innovation; moderate asset turnover and fixed asset turnover indicate operational challenges | Similar operational efficiency issues with low asset turnover metrics, suggesting room for improvement in innovation and asset use |
| Global presence | Primarily US-based with no significant international operations reported | Mainly regional US focus with past exposure to UK markets, which have since been reduced or divested |
| Market Share | Large presence in multiple major US utility markets, with significant scale advantages | Smaller scale compared to EXC, concentrated market share in fewer states |
In summary, both EXC and PPL are currently facing challenges in generating returns above their cost of capital, indicating some value destruction. However, both show improving profitability trends. EXC benefits from greater diversification and scale, while PPL has a more concentrated regional focus. Investors should weigh these factors carefully, considering both risk and growth potential.
Risk Analysis
Below is a comparative risk overview of Exelon Corporation (EXC) and PPL Corporation (PPL) for the fiscal year 2024, highlighting key risk metrics relevant for investment decisions.
| Metric | Exelon Corporation (EXC) | PPL Corporation (PPL) |
|---|---|---|
| Market Risk | Beta 0.56 (lower volatility) | Beta 0.72 (moderate volatility) |
| Debt level | Debt/Equity 1.73 (high leverage) | Debt/Equity 1.19 (high leverage) |
| Regulatory Risk | High, due to regulated electric utilities | High, operating under strict US & UK regulations |
| Operational Risk | Moderate, diversified energy sources but fixed asset turnover low (0.29) | Moderate, asset turnover low (0.26) with regional exposure |
| Environmental Risk | Exposure to fossil and nuclear energy; transition risks rising | Coal and gas generation exposure; UK and US environmental policies impact |
| Geopolitical Risk | Mainly US-focused, limited international exposure | US and UK operations, exposed to Brexit and transatlantic policy shifts |
Exelon’s lower beta indicates less market volatility, but both firms carry high debt levels, increasing financial risk. Regulatory and environmental risks are significant for both, given their reliance on fossil fuels and nuclear power amidst evolving policies. Exelon’s broader energy mix may mitigate some operational risks, but both are in the distress zone per Altman Z-Score, signaling caution.
Which Stock to Choose?
Exelon Corporation (EXC) shows a favorable income statement with strong gross and net margins, but mixed financial ratios, including a slightly unfavorable global ratio evaluation and moderate profitability. Its debt levels and liquidity ratios are concerning, yet its rating is very favorable (B). The company is shedding value per ROIC vs. WACC analysis but demonstrates growing profitability.
PPL Corporation (PPL) also has a favorable income statement, with good EBIT margin growth but faces unfavorable net income and margin trends overall. Financial ratios are mostly unfavorable, reflected in a very favorable rating (C+), though with more moderate score evaluations. PPL is likewise shedding value but with improving ROIC, indicating rising profitability.
Investors focused on income statement strength and higher overall ratings might find EXC more appealing, while those prioritizing recent EBIT growth and moderate financial stability could lean towards PPL. Both companies show value destruction but improving profitability, suggesting the choice could depend on tolerance for financial risks and preference for growth versus stability.
Disclaimer: Investment carries a risk of loss of initial capital. The past performance is not a reliable indicator of future results. Be sure to understand risks before making an investment decision.
Go Further
I encourage you to read the complete analyses of Exelon Corporation and PPL Corporation to enhance your investment decisions: