In the evolving landscape of regulated electric utilities, Exelon Corporation (EXC) and Pinnacle West Capital Corporation (PNW) stand out as key players. Both companies focus on electricity generation and distribution, serving diverse customer bases with a mix of traditional and renewable energy sources. Their overlapping markets and innovation in sustainable energy make this comparison essential. Join me as we analyze which company presents the most compelling opportunity for your investment portfolio.
Table of contents
Companies Overview
I will begin the comparison between Exelon Corporation and Pinnacle West Capital Corporation by providing an overview of these two companies and their main differences.
Exelon Overview
Exelon Corporation is a utility services holding company engaged in energy generation, delivery, and marketing across the US and Canada. It operates diverse facilities including nuclear, fossil, wind, hydroelectric, biomass, and solar. Exelon also offers retail and wholesale electricity, natural gas, and renewable energy products, serving a broad customer base including utilities, municipalities, and commercial clients. The company is headquartered in Chicago, Illinois.
Pinnacle West Overview
Pinnacle West Capital Corporation primarily serves Arizona through its subsidiary, Arizona Public Service Company, focusing on generation, transmission, and distribution of electricity. Its energy mix includes coal, nuclear, gas, oil, and solar sources. The firm maintains extensive transmission lines and substations, serving about 1.3M customers. Pinnacle West is based in Phoenix, Arizona, and operates regulated generation capacity of approximately 6,323 MW.
Key similarities and differences
Both Exelon and Pinnacle West operate in the regulated electric utility sector, providing generation, transmission, and distribution services. Exelon has a broader geographic reach across the US and Canada with a more diversified energy portfolio, while Pinnacle West concentrates on Arizona with significant infrastructure in transmission and distribution. Employee count and market capitalization are notably higher at Exelon, reflecting its larger scale.
Income Statement Comparison
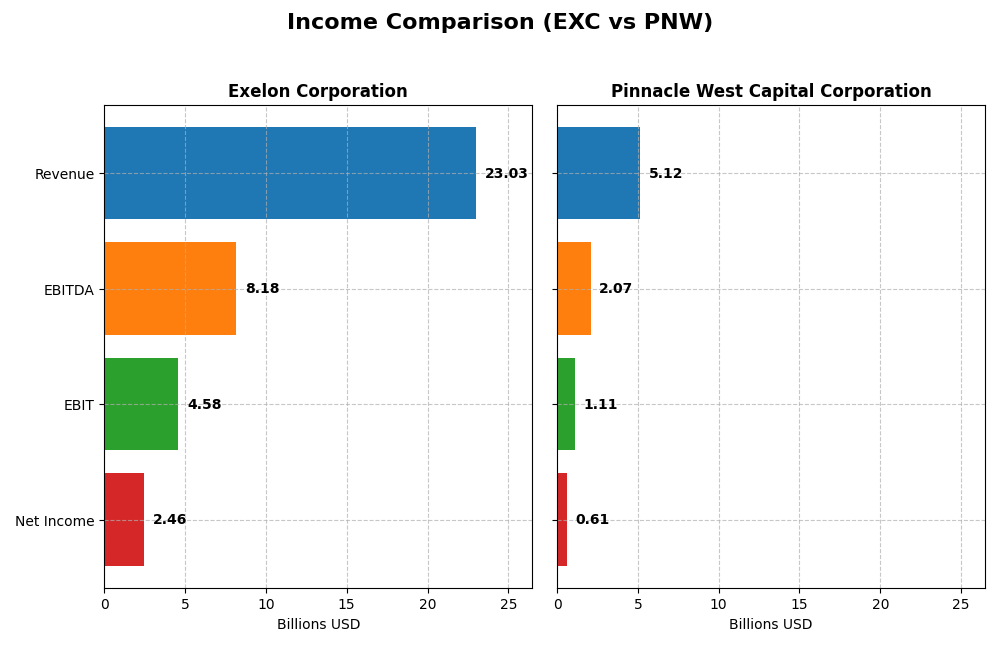
This table provides a side-by-side comparison of key income statement metrics for Exelon Corporation and Pinnacle West Capital Corporation for the fiscal year 2024.
| Metric | Exelon Corporation | Pinnacle West Capital Corporation |
|---|---|---|
| Market Cap | 43.8B | 10.7B |
| Revenue | 23.0B | 5.1B |
| EBITDA | 8.2B | 2.1B |
| EBIT | 4.6B | 1.1B |
| Net Income | 2.5B | 609M |
| EPS | 2.45 | 5.35 |
| Fiscal Year | 2024 | 2024 |
Income Statement Interpretations
Exelon Corporation
Exelon’s revenue showed a mixed trend, declining overall from 33B in 2020 to 23B in 2024, while net income increased from 1.96B to 2.46B over the same period. Margins improved notably, with a favorable gross margin at 40.84% and net margin at 10.68%. The latest year saw moderate revenue growth of 6% but a slight net margin decline of 0.3%, reflecting stable profitability.
Pinnacle West Capital Corporation
Pinnacle West exhibited steady revenue growth, rising from 3.59B in 2020 to 5.12B in 2024, accompanied by net income growth from 551M to 609M. Margins remain strong, with a favorable gross margin of 41.7% and net margin of 11.88%. In 2024, revenue and net income increased by 9.13% and 11.22%, respectively, supported by solid EBIT growth of 20.17%, though operating expenses grew unfavorably relative to revenue.
Which one has the stronger fundamentals?
Both companies present favorable income statement fundamentals, with Pinnacle West showing stronger revenue and net income growth over the last year and a higher EBIT margin at 21.74%. Exelon benefits from higher net income growth overall and improved margins despite revenue contraction. Pinnacle West’s operating expense growth relative to revenue is a caution, while Exelon faces a slight net margin dip recently, indicating trade-offs in their financial profiles.
Financial Ratios Comparison
The table below presents the most recent key financial ratios for Exelon Corporation and Pinnacle West Capital Corporation as of fiscal year 2024, facilitating a straightforward comparative analysis.
| Ratios | Exelon Corporation (EXC) | Pinnacle West Capital Corporation (PNW) |
|---|---|---|
| ROE | 9.1% | 9.0% |
| ROIC | 3.9% | 3.5% |
| P/E | 15.3 | 15.9 |
| P/B | 1.40 | 1.43 |
| Current Ratio | 0.87 | 0.59 |
| Quick Ratio | 0.78 | 0.42 |
| D/E (Debt-to-Equity) | 1.73 | 1.64 |
| Debt-to-Assets | 43.3% | 42.3% |
| Interest Coverage | 2.26 | 2.68 |
| Asset Turnover | 0.21 | 0.20 |
| Fixed Asset Turnover | 0.29 | 0.25 |
| Payout ratio | 62.0% | 64.8% |
| Dividend yield | 4.0% | 4.1% |
Interpretation of the Ratios
Exelon Corporation
Exelon’s financial ratios present a mixed picture, with favorable net margin (10.68%) and dividend yield (4.04%) contrasting against weak liquidity ratios (current ratio 0.87, quick ratio 0.78) and low asset turnover (0.21). The company shows moderate leverage (debt-to-equity 1.73) and an average interest coverage of 2.39. The dividend appears sustainable given the payout and yield, but caution is warranted due to uneven operational efficiency.
Pinnacle West Capital Corporation
Pinnacle West exhibits favorable net margin (11.88%) and dividend yield (4.09%) alongside challenges in liquidity (current ratio 0.59, quick ratio 0.42) and asset turnover (0.20). Leverage remains high with a debt-to-equity ratio of 1.64. Interest coverage stands at 2.95, indicating moderate risk. The company maintains a consistent dividend, supported by solid cash flow, though asset utilization is a concern.
Which one has the best ratios?
Both companies share a similar profile with 28.57% favorable ratios and 50% unfavorable, leading to a slightly unfavorable overall rating. Pinnacle West has a marginally better interest coverage, while Exelon offers a slightly higher net margin. Liquidity and asset turnover are weak for both, suggesting neither distinctly outperforms the other in ratio strength.
Strategic Positioning
This section compares the strategic positioning of Exelon Corporation and Pinnacle West Capital Corporation, focusing on market position, key segments, and exposure to technological disruption:
Exelon Corporation
- Leading regulated electric utility in US and Canada, facing moderate competitive pressure.
- Diversified revenue streams across multiple subsidiaries including nuclear, fossil, wind, and solar generation.
- Engages in a mix of traditional and renewable energy generation, balancing legacy assets with renewables.
Pinnacle West Capital Corporation
- Regional regulated electric utility primarily serving Arizona, with limited competitive pressure.
- Concentrated business mainly in electric service, transmission, and wholesale energy segments.
- Utilizes coal, nuclear, gas, oil, and solar with significant regulated transmission infrastructure.
Exelon Corporation vs Pinnacle West Capital Corporation Positioning
Exelon’s diversified portfolio across multiple states and energy types contrasts with Pinnacle West’s concentrated focus on Arizona’s regulated electric market. Exelon benefits from broad revenue sources, while Pinnacle West’s regional focus limits scale but may simplify operational risks.
Which has the best competitive advantage?
Both companies are currently shedding value with ROIC below WACC. Exelon shows a slightly unfavorable moat with improving profitability, whereas Pinnacle West faces a very unfavorable moat with declining returns, indicating weaker competitive advantage.
Stock Comparison
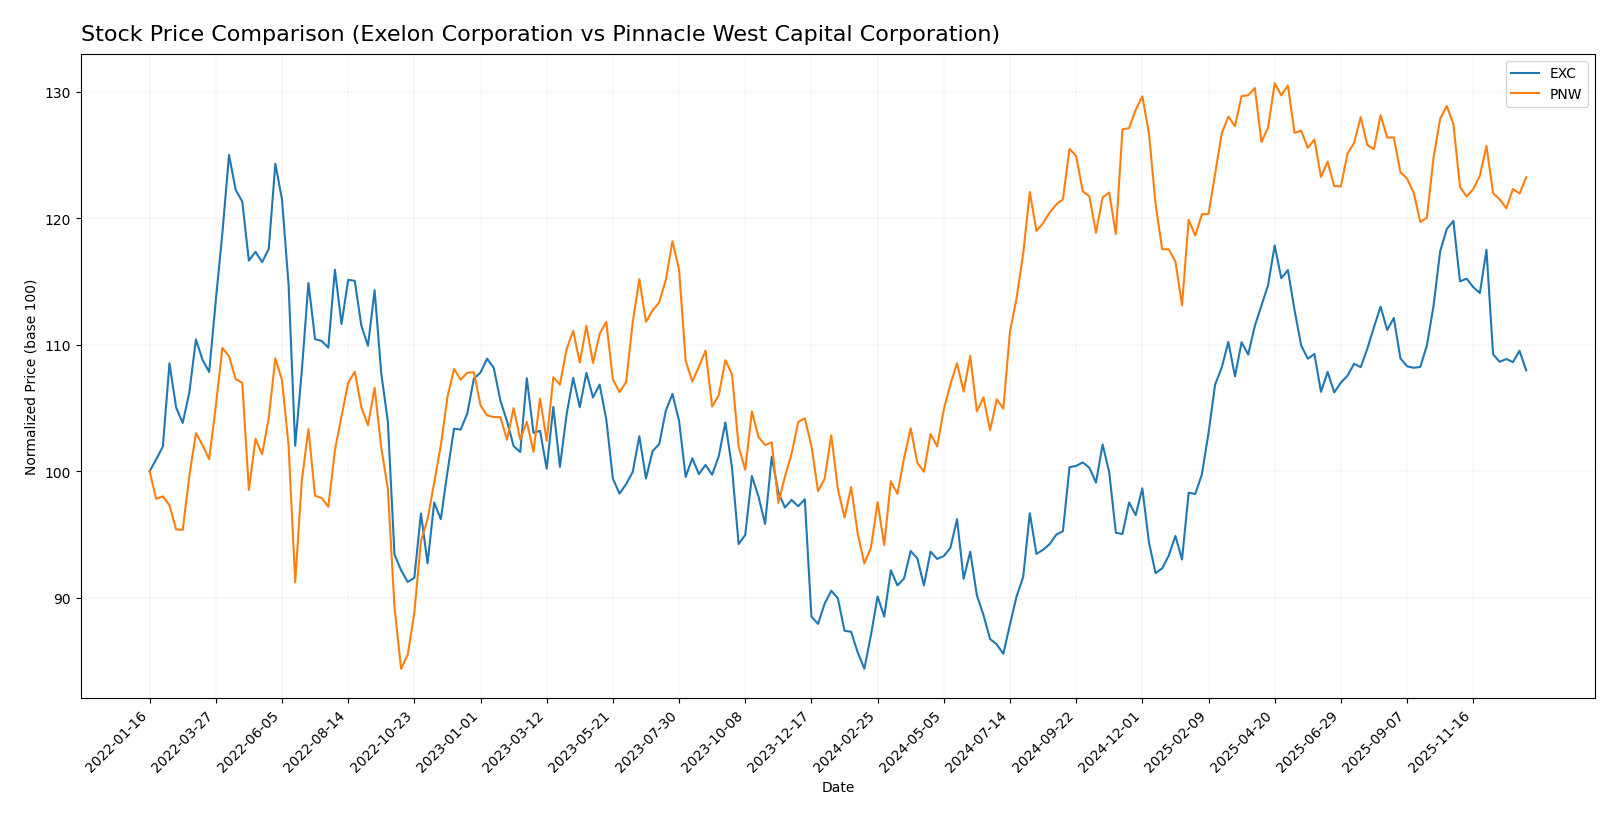
The past 12 months have shown notable bullish trends for both Exelon Corporation (EXC) and Pinnacle West Capital Corporation (PNW), despite recent decelerations and downward price movements in the last quarter.
Trend Analysis
Exelon Corporation’s stock gained 24.03% over the past year, reflecting a bullish trend with decelerating momentum and a standard deviation of 3.75. The price ranged between 34.31 and 48.04, but recent months show a 9.87% decline.
Pinnacle West Capital Corporation’s stock rose 31.14% over the same period, also bullish with deceleration and higher volatility at 6.87 standard deviation. Prices fluctuated from 67.92 to 94.45, with a recent 3.31% drop.
Comparing both stocks, Pinnacle West Capital Corporation delivered the highest market performance over the past year, despite similar decelerating trends and recent price declines.
Target Prices
The current analyst consensus indicates moderate upside potential for both Exelon Corporation and Pinnacle West Capital Corporation.
| Company | Target High | Target Low | Consensus |
|---|---|---|---|
| Exelon Corporation | 57 | 39 | 50.86 |
| Pinnacle West Capital Corporation | 115 | 85 | 96.33 |
Analysts expect Exelon’s stock price to rise from its current 43.3 USD toward a consensus target near 50.9 USD, while Pinnacle West’s 89.07 USD price shows potential to increase toward 96.3 USD consensus.
Analyst Opinions Comparison
This section compares analysts’ ratings and financial scores for Exelon Corporation (EXC) and Pinnacle West Capital Corporation (PNW):
Rating Comparison
EXC Rating
- Rating: B, indicating a very favorable overall evaluation.
- Discounted Cash Flow Score: Moderate at 3, reflecting fair valuation based on cash flows.
- ROE Score: Moderate at 3, showing efficient profit generation from equity.
- ROA Score: Moderate at 3, indicating effective asset utilization.
- Debt To Equity Score: Moderate at 2, suggesting moderate financial risk.
- Overall Score: Moderate at 3, reflecting balanced financial health.
PNW Rating
- Rating: C+, also considered very favorable by analysts.
- Discounted Cash Flow Score: Very unfavorable at 1, signaling concerns on valuation.
- ROE Score: Moderate at 3, similar efficiency in generating profits.
- ROA Score: Moderate at 3, comparable asset efficiency.
- Debt To Equity Score: Very unfavorable at 1, indicating higher financial risk.
- Overall Score: Moderate at 2, slightly lower overall assessment.
Which one is the best rated?
Based strictly on these data, Exelon (EXC) holds a stronger position with higher overall, discounted cash flow, and debt-to-equity scores. Pinnacle West (PNW) matches EXC in ROE and ROA but scores notably lower on cash flow valuation and financial risk metrics.
Scores Comparison
Here is a comparison of the financial scores for Exelon Corporation and Pinnacle West Capital Corporation:
EXC Scores
- Altman Z-Score: 0.78, placing EXC in the distress zone, indicating high bankruptcy risk.
- Piotroski Score: 5, reflecting average financial strength and investment potential.
PNW Scores
- Altman Z-Score: 0.73, placing PNW in the distress zone, indicating high bankruptcy risk.
- Piotroski Score: 4, reflecting average financial strength and investment potential.
Which company has the best scores?
Based on the provided data, EXC has slightly higher Altman Z-Score and Piotroski Score than PNW, indicating marginally better financial health and lower bankruptcy risk. However, both remain in the distress zone with average Piotroski scores.
Grades Comparison
Here is a comparison of the latest grades assigned to Exelon Corporation and Pinnacle West Capital Corporation by major grading firms:
Exelon Corporation Grades
The table below shows recent grades from reputable financial institutions for Exelon Corporation:
| Grading Company | Action | New Grade | Date |
|---|---|---|---|
| UBS | Maintain | Neutral | 2025-12-17 |
| JP Morgan | Maintain | Neutral | 2025-12-12 |
| Morgan Stanley | Maintain | Equal Weight | 2025-10-22 |
| Keybanc | Maintain | Underweight | 2025-10-15 |
| Jefferies | Maintain | Buy | 2025-10-15 |
| Barclays | Maintain | Overweight | 2025-10-14 |
| UBS | Maintain | Neutral | 2025-10-10 |
| Morgan Stanley | Maintain | Equal Weight | 2025-09-25 |
| Keybanc | Maintain | Underweight | 2025-07-16 |
| UBS | Maintain | Neutral | 2025-07-11 |
Exelon’s grades range mostly from Neutral to Equal Weight, with a few Buy and Overweight ratings, and some Underweight assessments, indicating a mixed but generally cautious outlook.
Pinnacle West Capital Corporation Grades
The table below shows recent grades from reputable financial institutions for Pinnacle West Capital Corporation:
| Grading Company | Action | New Grade | Date |
|---|---|---|---|
| UBS | Maintain | Neutral | 2025-12-17 |
| Keybanc | Downgrade | Sector Weight | 2025-12-12 |
| Keybanc | Maintain | Overweight | 2025-10-15 |
| UBS | Maintain | Neutral | 2025-10-10 |
| Barclays | Maintain | Equal Weight | 2025-10-07 |
| Argus Research | Maintain | Buy | 2025-09-30 |
| Morgan Stanley | Maintain | Equal Weight | 2025-09-25 |
| UBS | Maintain | Neutral | 2025-09-12 |
| Mizuho | Downgrade | Neutral | 2025-09-09 |
| Barclays | Maintain | Equal Weight | 2025-08-13 |
Pinnacle West’s grades primarily cluster around Neutral and Equal Weight, with some Overweight and Buy ratings offset by recent downgrades, reflecting a cautious to moderate investment stance.
Which company has the best grades?
Both companies share a consensus rating of Hold. Exelon Corporation received more Buy and Overweight ratings compared to Pinnacle West, which has recently seen some downgrades. This suggests Exelon may have a slightly more favorable outlook from analysts, potentially impacting investor sentiment and portfolio positioning.
Strengths and Weaknesses
Below is a comparison of key strengths and weaknesses for Exelon Corporation (EXC) and Pinnacle West Capital Corporation (PNW), based on the most recent financial and operational data available.
| Criterion | Exelon Corporation (EXC) | Pinnacle West Capital Corporation (PNW) |
|---|---|---|
| Diversification | Highly diversified with multiple regulated utilities and energy segments generating revenues between $438M and $8.2B across several subsidiaries. | Less diversified, primarily reliant on Electric Service ($2.56B) with smaller transmission and wholesale segments. |
| Profitability | Net margin 10.68% (favorable), ROIC 3.93% (unfavorable, below WACC 5%), showing slight value destruction but improving ROIC trend. | Net margin 11.88% (favorable), ROIC 3.48% (unfavorable, below WACC 4.68%), with declining ROIC indicating worsening profitability. |
| Innovation | Moderate innovation reflected in steady ROIC improvement despite value loss, but asset turnover ratios are low, signaling efficiency issues. | Limited signs of innovation; declining ROIC and low asset turnover (0.2) suggest operational challenges and weaker capital efficiency. |
| Global presence | Primarily US-focused with strong presence in multiple regional utilities, no significant international exposure. | US-focused regional utility with limited geographic reach compared to EXC. |
| Market Share | Large market share within its service areas, supported by multiple regulated subsidiaries with revenues up to $8.2B. | Smaller market share focused on Arizona region, with revenues around $2.56B in electric services. |
Key takeaways: Exelon Corporation benefits from strong diversification and improving profitability trends, though it currently sheds value and has operational inefficiencies. Pinnacle West shows better net margins but struggles with declining profitability and less diversification, indicating higher risk. Both face challenges in capital efficiency and liquidity ratios.
Risk Analysis
The table below summarizes key risks associated with Exelon Corporation (EXC) and Pinnacle West Capital Corporation (PNW) based on the latest data from 2024.
| Metric | Exelon Corporation (EXC) | Pinnacle West Capital Corporation (PNW) |
|---|---|---|
| Market Risk | Moderate (Beta 0.56) | Moderate (Beta 0.54) |
| Debt Level | High (D/E 1.73, 43.3% debt to assets) | High (D/E 1.64, 42.3% debt to assets) |
| Regulatory Risk | Elevated (Utility sector, nuclear & fossil exposure) | Elevated (Utility with coal, nuclear, gas) |
| Operational Risk | Medium (Diverse generation assets, aging infrastructure) | Medium (Large grid with extensive lines and substations) |
| Environmental Risk | Significant (Nuclear and fossil fuel reliance) | Significant (Coal, nuclear, gas, oil generation mix) |
| Geopolitical Risk | Low to Medium (US and Canada operations) | Low (Primarily Arizona, US) |
Both companies face notable financial leverage, with debt-to-equity ratios above 1.6 and interest coverage ratios around 2.4 to 3.0, signaling moderate risk in servicing debt. Regulatory and environmental risks are prominent due to exposure to nuclear and fossil fuel energy sources amid tightening policies and transition pressures. Operational risks arise from managing complex generation and transmission assets. Market risk is moderate, with betas below 0.6, indicating lower volatility relative to the market. Geopolitical risk is relatively low but present due to regional regulatory environments.
The most impactful risks are financial leverage combined with regulatory and environmental pressures, which could affect profitability and require careful monitoring. Investors should weigh these risks against dividend yields and sector stability.
Which Stock to Choose?
Exelon Corporation (EXC) shows a favorable income statement with solid net and gross margins and positive net income growth over five years. However, its financial ratios are slightly unfavorable, marked by weak liquidity and high leverage, despite a favorable dividend yield and valuation metrics. The company holds a very favorable rating overall, but its economic moat is slightly unfavorable due to value destruction despite rising profitability.
Pinnacle West Capital Corporation (PNW) exhibits a favorable income statement with strong recent revenue and earnings growth, though its net margin growth over the longer term is unfavorable. Financial ratios mirror a similar pattern to EXC, with liquidity concerns and moderate leverage, yet favorable dividend yield and valuation. Its rating is very favorable but less strong than EXC’s, and its economic moat is very unfavorable, reflecting value destruction and declining profitability.
For investors, the choice could depend on risk tolerance and investment focus: those prioritizing improving profitability with a slightly unfavorable moat might find EXC appealing, while investors valuing recent robust growth but facing a deteriorating moat may see PNW as more aligned. Both companies present liquidity and leverage challenges, so cautious consideration of financial health and growth expectations appears prudent.
Disclaimer: Investment carries a risk of loss of initial capital. The past performance is not a reliable indicator of future results. Be sure to understand risks before making an investment decision.
Go Further
I encourage you to read the complete analyses of Exelon Corporation and Pinnacle West Capital Corporation to enhance your investment decisions: